Abstract
We present a system for near infrared functional tomography based on a single pulsed source and a time-gated camera, for non-contact collection over a large area. The mean penetration depth of diffusely reflected photons is dependent on the arrival time of photons, but not on the source–detector distance. Thus, time-encoded data can be used to recover depth information while photon exiting point is exploited for lateral localization. This approach was tested against simulations, demonstrating both detection and localization capabilities. Preliminary measurements on inhomogeneous phantoms showed good detection sensibility, even for a low optical perturbation, and localization capabilities, yet with decreasing spatial resolution for increasing depths. Potential application of this method to in vivo functional studies on the brain is discussed.
OCIS codes: (170.5280) Photon migration, (170.3890) Medical optics instrumentation, (170.6920) Time-resolved imaging
1. Introduction
Light is a powerful tool for in-vivo investigation of biological tissues. In the 600-1100 nm range it is not harmful for biological media at low power densities (few mW/mm2), permitting design of in vivo non-invasive diagnostics. The low tissue absorption in this wavelength range makes it possible to look into the body at few cm of depth (e.g. the brain cortex) or through more than 6 cm of tissue in transmission (e.g. compressed breast). Furthermore, light carries multiple useful information from the visited tissues linked either to absorption (e.g. tissue composition, oxygenation), or to scattering (e.g. tissue microstructure) or even by exploiting selective fluorescent markers to specific biochemical targets. In the same spectral range most tissues are highly scattering. This is a most severe challenge causing scattering to absorption coupling, strong attenuation of the remitted light with exponential dependence on the visited depth, blurring effects impairing spatial resolution.
An attractive approach to study photon propagation in highly scattering media (photon migration) is the adoption of a time-domain scheme [1]. Separating photons propagated through the medium as a function of their traveling time permits to uncouple absorption from scattering contributions, to probe the medium at increasing mean penetration depths by collecting longer lived photons, and to improve spatial resolution using early less dispersed photons.
In particular, in the case of brain imaging, addressed to detection of hemoglobin content and oxygenation, time-domain measurements have been proposed as a means to reach deeper structures (brain cortex) uncoupling for the masking effects caused by more superficial tissues [2–7]. Different approaches have been proposed to exploit time-encoded depth information, such as selection of late time-gates [4,5,8], subtraction of early gates from late gates [4,9], derivation of the variance of the Distribution of Time of Flight (DTOF) that is almost exclusively sensitive to absorption changes in deep tissue layers [3], use of the whole DTOF interpreted with Monte Carlo based sensitivity factors [2], as well as the adoption of a full 3D reconstruction scheme [6,10].
At present, in most cases, only a tiny fraction of the potentially available information is retrieved in a typical time-resolved measurement. The ultimate physical limitation would correspond to a uniform illumination over the head with a power density corresponding to the safety limits (few mW/mm2), combined with a corresponding collection of the emitted signal from the same area with an accepting solid angle of 2π. Current time-resolved systems are quite far from this limit. Just a small fraction of the available signal is collected due to the very poor (<1%) spatial coverage of the head, both for sources and detectors. Furthermore, in the case of Time-Correlated Single-Photon counting (TCSPC) systems, the maximum detectable signal is limited by the maximum count rate of the detection electronics that at present is at best about counts/s for a board running at 50% of the saturated count rate [11]. This limit is easily reached with a source power of about 1 mW, and a set of collecting bundles with an interfiber distance of few cm. Thus, it is not possible with classical schemes to fully exploit the future availability of compact pulsed fiber sources with at least 100 times more power than diode lasers, as well as to foresee a dense coverage of the head, or even to take advantage of the higher contrast and spatial resolution offered by very short interfiber distances [12]. A possibility to overcome these limitations is to use a Single-Photon Avalanche Diode (SPAD) operated in time-gated mode [13], even though the small detector area is at present a limiting factor if a single SPAD is employed. Alternatively, it is possible to adopt a time-gated Intensified CCD camera (ICCD) that has lower limitations in term of maximum signal level, even though the signal quality is possibly worse than for TCSPC systems. This approach has been widely studied by Selb et al. [5,8,10] empowering a set of bundles of different lengths to sample different propagation times with a single time-gate. Alternatively, Sawosz et al. [14] have adopted a completely non-contact scheme with a scanning source and a wide field collection.
In this paper we have implemented a system capable to acquire a large data set from a wide region surrounding a single injection point, exploiting the time information to recover a 3D tomography. The system is based on a single injection source and on a gated camera for acquisition. Compared to previous work of Selb et al. [8] here we explore a large area with non-contact approach that could permit a better light harvesting together with a higher number of source-detector pairs. In the case of molecular imaging, a wide-field non-contact approach has been proven superior to fiber-based collection schemes for tomographic reconstruction both in terms of spatial resolution and image quality [15]. Also, sequential acquisition of different time windows permits to change light attenuation for each image so to properly fill the whole dynamic range of the CCD, and reach a better equalization of the signal at different time gates. Conversely, with respect to the work of Sawosz et al. [14], here we present a complete 3D tomographic approach. In addition, the use of a single fixed launching fiber makes it possible to recover a full 3D tomography in a short time, compatible with functional imaging studies. Compared to our current implementation, the work of Sawosz et al. is more aggressive, aiming at performing measurements even at null interfiber distance, that permits, also, to achieve a fully non-contact scheme. Here we follow a more conservative approach, using a shield to mask a small circle around the launching fiber that prevents to expose the camera to the high photon flux arising from small distances, and most of all to reduce radial-dependent variations in signal level. Nevertheless, it will be possible to implement in future a spatial filter on the imaging optics so to facilitate fully non-contact measurements.
In the following, we will first revise two concepts that constitute the basis of the present work, and then we will test the validity of the method for 3D functional tomography both on simulations and on phantom measurements. Finally, the possible application to in vivo functional imaging of brain activity will be discussed.
2. Concepts
The key ideas underpinning this work are depicted in Fig. 1 , and Fig. 2 . A first concept (Fig. 1) is the use of time to reconstruct a 3D tomography. Considering an homogeneous diffusive medium, upon increasing the arrival time of photons, the mean depth of visited tissue increases as well. Most noticeably, the mean depth is not affected by the source-detector distance, being encoded solely in the time. This opens the possibility for a 3D tomographic scheme with a single injection point, where depth information is provided by the photon transit time, while lateral information is gained from the different collection points. The graph in Fig. 1 shows the mean penetration depth as a function of the photon arrival time, calculated as described in Ref [16]. for a homogeneous medium with a reduced scattering coefficient () of 10 cm−1. The function does not depend neither on the absorption coefficient (), nor on the source-detector separation (ρ).
Fig. 1.
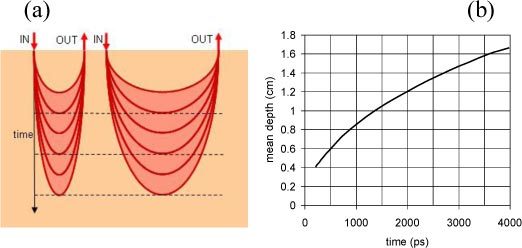
Use of time to explore different depths in the medium. Left: upon increasing the photon arrival time, the probability function of photon paths (banana shape) gets deeper, in a same way for all source-detector couples. Right: mean depth of photon paths as a function of the photon traveling time, calculated for cm−1 as described in Ref [16]. The plot is the same for any source-detector separation.
Fig. 2.
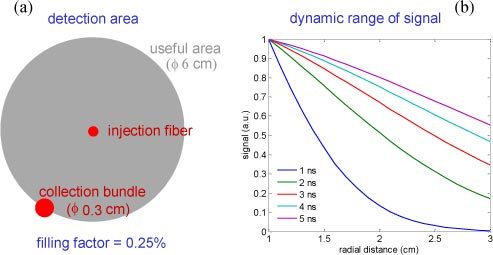
Use of a large collection area. Left: assuming a source-detector pair with a detector radius of 0.15 cm, compared to the useful area with radius of 3 cm, the spatial coverage (detector area over total area) is only 0.25% of the physical limit. Right: signal level calculated as a function of distance from the source for different values of the photon arrival time. All curves are normalized to the value at 1 cm, which is the minimum distance used in this paper. Upon increasing time, the signal gets more uniform over the whole collection area.
The second concept is to fully exploit light exiting from the tissue (Fig. 2). In a typical set-up for optical functional imaging, a certain number of bundles are used to couple light to and from the tissue. Spatial coverage is rather poor (about 0.25%) since a relatively large source-detector distance is adopted and only a limited number of bundles can be positioned on the head. Here we want to exploit a much larger filling factor (about 90%) by collecting most of the exiting light starting from a lower distance of 1 cm from the injection point up to a maximum distance of 3 cm. The inner region is excluded (shielded) to avoid saturation of the ICCD due to the overwhelming number of early photons at short distances. Conversely, at larger distances, the radial dependence of signal becomes smoother, particularly at later times. The graph in Fig. 2 shows the radial dependence of the emitted signal for 5 different delays (1, 2, 3, 4, and 5 ns). All curves are normalized to the value derived for . By applying these two concepts we want to attain enough information to get a 3D reconstruction from a single injection point and in a short time.
These two concepts were shown for a homogeneous medium. Similar trends are expected also for an inhomogeneous case, with a small perturbation, since the effect both on depth sensitivity (Fig. 1) and signal level (Fig. 2) is small. Out of the small perturbation regime, those concepts are still valid qualitatively, although the trends could be quite distorted.
3. Reconstruction strategy
3.1. Forward model
The geometry of the problem is depicted in Fig. 3 . One single source was used both in simulations and in phantom experiments. The position of the source was defined as the origin of the Cartesian coordinate system. Collection points on the medium surface are identified by r, while locates any point (voxel) within the diffusive medium. The time t represents the arrival time of photons at the detector point.
Fig. 3.
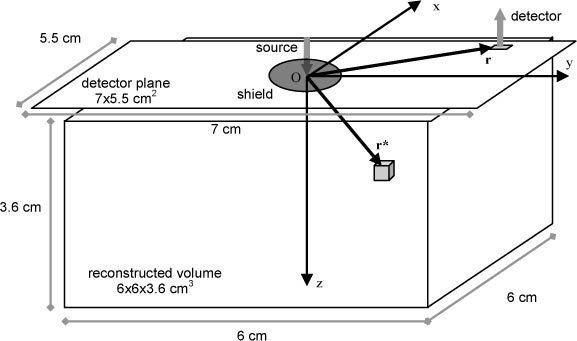
Geometry of the problem. A single injection source is set on the origin of the Cartesian system. The volume is divided into nvoxels cubic voxels, addressed by r*. The surface not covered by the black circular shield around the injection source is divided into nSD square detectors, addressed by r.
We indicate with a reference photon fluence for the unperturbed medium (for an in vivo functional imaging experiment, this can correspond to an initial rest state), and with the perturbed photon fluence obtained when the absorption coefficient in the medium at location r* is changed compared to the reference initial state by the amount .
For small absorption changes the problem can be simplified assuming a linearized perturbation approach: a small localized perturbation yields a perturbed photon fluence given by [2,3,17]:
| (1) |
where is the time-resolved internal mean pathlength, that photons, detected at time t, have traveled inside the inhomogeneity [17]. Thus, the observed change in signal attenuation can be expressed as:
| (2) |
Moving from the continuous to the discretized case, the reconstructed region is a volume (6 × 6 × 3.6 cm3) centered beneath the injection source, and divided into cubic voxels with side 0.3 cm. The plane, parallel to the surface (detector plane), was discretized at steps of 0.3 cm both in the x and y directions. Then, all pixels included in the field of view of the imaging system (5.5 × 7 cm2), and out of the circular black shield (∅ 2 cm) were selected as detectors, yielding a total of source-detector pairs. For every collection point, a set of measurements are derived, corresponding to integration from an initial time up to , where is the width of the time-gated window. The width is kept fixed, while is moved at increased delays, yielding measurements with increasing average propagation times. Measurements are stored in the array , with dimensions . A global change in the absorption properties of the medium can be expressed by the array , with elements, defined for every voxel of the medium. Assuming that the time-resolved fluence resulting from a distributed change in the absorption coefficient can be obtained as the superposition of localized perturbations, from Eq. (2) we can derive
| (3) |
where is a matrix with indices addressing the detector position , the voxel position , and the time window , and dimensions . Matrix L represents the mean internal pathlengths spent within each voxel by photons measured at each detector position and each time gate. Since the longer the mean pathlength in a given voxel, the larger the effect produced on the measurements, the mean pathlength matrix L is also called sensitivity matrix [10]. We calculated it using the analytical expression for provided in Ref. [17], Eq. (6), for a homogeneous medium with known optical properties, evaluated at time , that is at the beginning of each time window. This approximation can be justified for larger taking into account that the majority of the photons collected in each time window arrives to the detector at the opening of the gate, being the photon fluence rapidly decaying in time. Yet, some larger discrepancy is expected at early times.
3.2. Inverse problem
The estimated image of in Eq. (3) was reconstructed using the Tikhonov regularization [18,19]:
| (4) |
The parameter α in Eq. (4) was used to restrain the sensitivity of to the noise level of the data.
Let’s go back now to the two leading concepts formulated in the previous paragraph. Regarding Fig. 1, we observe that the mean photon internal pathlength in deeper voxels increases upon increasing the photon arrival times t, resulting in higher sensitivity of the measurement to the local perturbation (see Fig. 10 in Ref. [17]). Thus the L matrix provides a higher weight for deeper voxels upon increasing. In the CW case, for each detector position a single measurement is achieved, and the L matrix contains the internal mean pathlengths corresponding to an “average” propagation time t. Thus, deeper regions are reached exploiting large source-detector distances that yield a larger average propagation time. Conversely, the use of multiple time gates permits, for every source-detector couple, to have multiple measurements with increasing depth sensitivity. In a way, lateral and depth sensitivity are separated, being the former encoded in the detector position, and the latter in the time gate . Furthermore, depth information is reached just by increasing, without changing source-detector position, thus keeping exactly the same collection efficiency.
Regarding Fig. 2, we observe that increasing the detection coverage we increase both the total collected signal and the spatial coverage of the measurement . Since depth information is already provided by time, this should help in amending the ill-posed nature of the problem. The determination of the optimal sectioning of the detection surface and the optimal choice of the time gates is not obvious and depends on a deeper analysis of the matrix L and of the available SNR, and goes beyond the scope of the present paper. Conversely, we have adopted a simple choice by sectioning the detection surface with the same size of the voxels, and taking a number of time-gates compatible with a real-time in vivo acquisition. Anyhow, it is reasonable that the maximum information is gained when the entire signal exiting the surface is collected, and that a spare coverage, as the one depicted in the left of Fig. 2 in the case of the bundle is quite far from the ultimate limit.
4. Materials and methods
4.1. Simulations
The photon fluence Φ, simulating a local perturbation, was calculated using an higher order perturbative approach yielding a better accuracy than the purely linear equation [17]:
| (5) |
where the photon fluence for the unperturbed state was calculated using the time-dependent diffusion equation solved for a homogeneous slab applying the extrapolated boundary conditions [20,21], while was calculated again using Eq. (6) of Ref 17. Then, was integrated between and for each delay. Since, both for simulations and phantom measurements the slab thickness was rather large, identical results would be obtained using the semi-infinite model.
The perturbations were simulated by a sphere (radius 0.6 cm) embedded in a homogeneous medium with , , and a slab thickness of 15 cm (almost semi-infinite). The reduced scattering coefficient of the inclusion was kept the same as the background, while 5 different values for the absorption coefficient () were considered, namely 0.1 cm−1 (), same as background, 0.2 cm−1 (), 0.4 cm−1 (), 0.8 cm−1 (), and 2.0 cm−1 (), to mimic a completely absorbing inclusion. Position in the xy plane was (0,1) cm. Along the direction z, four depths were tested: 0.5, 1.0, 1.5, and 2.0 cm. Eight time-delays were used (2.25, 2.5, 2.75, 3, 3.25, 3.5, 3.75, 4 ns), while keeping fixed the width .
Poisson noise was added to the simulation in accordance to what expected for the measurements with the ICCD. In detail, simulated images were multiplied by a proper factor so to yield a given signal intensity. At each detector position, the signal-to-noise ratio (SNR) was calculated as the square root of the number of counts, thus assuming purely Poisson noise. Then, the global SNR was derived as the median of the SNR at each detector position and each delay. The actual dynamic range of the ICCD was effectively taken into account by limiting the peak value in each simulated image to the maximum counts, and normalizing the entire image accordingly.
4.2. Experimental set-up
A scheme of the experimental set-up is depicted in Fig. 4 . A pulsed diode laser (PDL800B, PicoQuant, Germany), operating at 690 nm, with pulse width ≈200 ps, and repetition rate of 80 MHz was used as the illuminating source. Light was delivered to the tissue by means of a 50 μm core graded index fiber, and expanded to few mm2 using a spacer. The maximum power impinging onto the phantom or onto the tissue was 1 mW. The launching fiber was inserted into a black cylinder (∅ = 2 cm) so to mask the region too close to the injection point that could saturate the camera at an early gate. The cylinder was kept over the surface, with the PVC in contact with the water solution. Detection was achieved using a time-gated intensifier tube (HRI, Kentech, Didcot, UK), coupled to a low-noise, Peltier cooled CCD camera (PCO GmbH, Gottingen, Germany), set at a distance of 20 cm over the surface and collecting diffusely remitted light from an area centered in the injection point. The camera was operated with a 500 ps wide gate and a rising edge of 120 ps set at a given programmable delay with respect to the laser pulse. A hardware binning of 2x2 pixels was applied to the ICCD so to reduce the incidence of the read-out noise. All operations involved in the measurement were automated, that are: i) moving the optical inhomogeneity using a translating stage; ii) adjusting the gate delay; iii) rotating the circular variable attenuator to reduce injected power at early delays; iv) setting the intensifier gain; v) acquiring and saving the images.
Fig. 4.
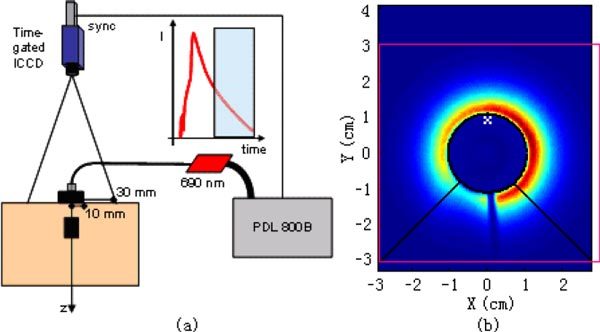
(a) Experimental set-up. Light source: pulsed diode laser, operated at 690 nm with 80 MHz repetition rate. Detection: time-gated intensified CCD camera, gate width 1 ns, risetime 120 ps. The launching fiber is embedded into a black cylinder (1 cm radius) to shield the camera from early photons at short source-detector distances. (b) One raw image captured by the ICCD camera. The red rectangle shows the imaging region in X-Y plane for reconstruction. The black circle indicates the position of the black cylinder. The region enclosed by the black lines and the bottom line of the rectangle was removed to avoid influence of the optical fiber.
The imaging region of the ICCD was 5.5 × 7.0 cm2. Before processing, a software binning procedure was applied by adding pixels in 0.3 × 0.3 cm2 blocks (28 × 28 pixels) to reduce noise level. To eliminate the defocused shading effect of the launching fiber crossing the imaged field, a part of the raw image was removed. The remaining 205 pixels were selected as detectors. The imaging region for reconstruction was 6 × 6 cm2, as indicated by the red square block in Fig. 4(b). The black circle indicates the position of the black cylinder. The region enclosed by the black lines and the bottom line of the rectangle was removed to avoid influence of the optical fiber.
5. Results and Discussion
5.1. Validation on simulated data sets
The proposed method was tested first on simulations. Figure 5 shows vertical sections of the 3D reconstructions of at for increasing values of (rows) and of the perturbation depth z (columns) recovered from simulated data. For the same depth, the reconstructed augments for increasing values of (each column has the same colorbar). The perturbation can be detected at all depths, although with decreasing contrast and worse spatial resolution. Also, the lateral and axial positions of the perturbation are recovered with reasonable agreement. The SNR of simulations in Fig. 5 is 1000, leading to a choice of .
Fig. 5.
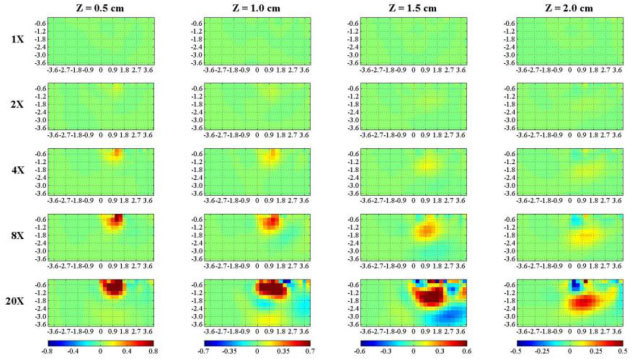
Vertical section along the yz plane of 3D reconstructions of from simulated data, using . A localized perturbation (sphere with radius 0.6 cm) with increasing values of compared to (rows) is set at increasing depths z (columns). The first and last row represent a completely homogeneous case ( = 1 × ), and a very high (completely absorbing) inhomogeneity ( = 20 × ), respectively. Axis dimensions are in cm, while colorbar is in cm−1.
To investigate the relevance of the signal level on the outcome of the reconstruction, we have repeated the exercise using a SNR = 40. The reconstructed is reported in Fig. 6 . Although detection is still possible, compared to higher SNR simulations (Fig. 5), spatial localization is worsened, since the perturbed area is quite large, and depth dependence is lost. This confirms that spatial resolution in diffuse optical tomography is ultimately limited by the available SNR [22].
Fig. 6.
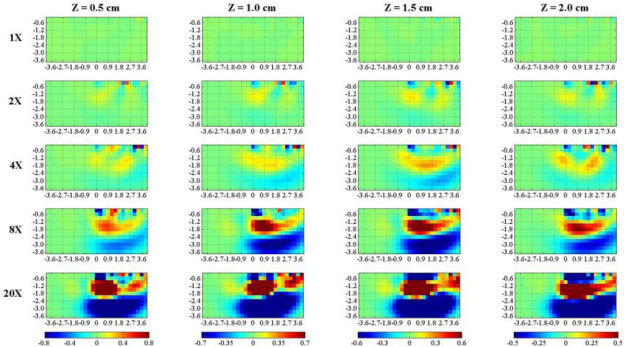
Vertical section along the yz plane of 3D reconstructions of from simulated data, generated as in Fig. 5, apart from a lower SNR = 40 and a value of . A localized perturbation (sphere with radius 0.6 cm) with increasing values of compared to (rows) is set at increasing depths z (columns). The first and last row represent a completely homogeneous case ( = 1 × ), and a very high (completely absorbing) inhomogeneity ( = 20 × ), respectively. Axis dimensions are in cm, colorbar is in cm−1.
It must be recalled that the reconstruction model is based on the assumption of a small perturbation. It has been shown [17], that – for a sphere with 0.5 cm radius – set at a depth of 2 cm, this approximation starts deviating from the real case for cm−1. Larger perturbations could be better described using a higher order perturbation approach [23]. Yet, this would lead to a non-linear problem, to be solved with an iterative approach.
5.2. Phantom measurements
For the homogeneous medium we used a water solution of Intralipid and black ink with and [24], poured in a large tank (surface 15x20 cm2, height 19 cm). A total of 5 black PVC cylindrical (height equal to diameter) inclusions, with increasing volume (0.021, 0.050, 0.098, 0.270, 0.400 cm3) were hold beneath the point (0,1.5) cm of the plane at 4 increasing depths z: 0.5, 1.0, 1.5 and 2.0 cm (measured from the upper surface of the inclusion). The gating window applied to the ICCD was shifted in time at 8 increasing time-delays (2.25, 2.5, 2.75, 3, 3.25, 3.5, 3.75, 4 ns), while the gate width was fixed at 500 ps. The acquisition time of the CCD camera was 2.5 s for each delay.
Figure 7 shows vertical sections of the 3D reconstructions of at for increasing volumes of the PVC cylinder (rows) and of depth z (columns). The perturbation can be detected with enough contrast up to the larger depth (2.0 cm). Furthermore, there is a reasonable dependence of the reconstructed on the amount of perturbation (PVC volume). Localization properties are also adequate both for the y coordinate, and for the depth z dependence. Spatial resolution suffers for the lower contrast at larger depths, with a swelling and decreasing of maximum upon increasing z.
Fig. 7.
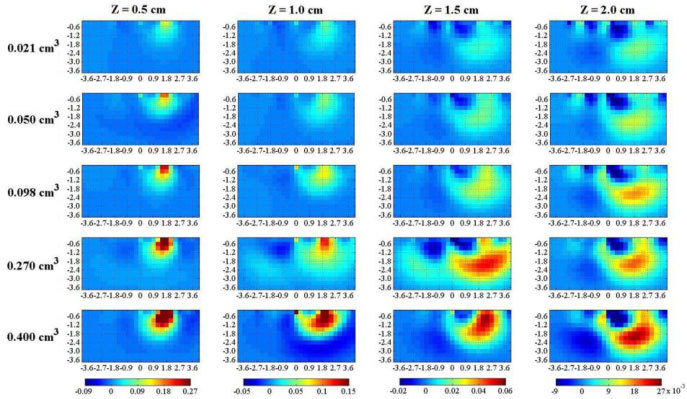
Vertical section along the yz plane with x = 0 cm of tomographies of from phantom measurements, using . From left to right the depth (Z) of the inclusion is increased. From top to bottom, the volume of the PVC cylinder is increased. Axis dimensions are in cm, while colorbar is in cm−1.
The use of black PVC cylinders was motivated by the need to produce controllable perturbations. Different solutions have been proposed to simulate optical inhomogeneities, such as glass/plastic tubes or gloves filled with liquid solution, yet some arrangements are prone to light-guiding effects, others are difficult to handle or to control in shape and position. Conversely, we have checked via Monte Carlo simulations that small totally absorbing inhomogeneities produce a perturbation on the DTOF of the same shape and amplitude of realistic absorption changes provided that the depth of the inhomogeneity is equal to or larger than 1 cm. Although phantom measurements have been carried out also for the depth cm, in this situation, for which the inhomogeneity may be very close to source or detector, the perturbations of black PVC cylinders is not equivalent to that of realistic absorption changes. Conversely, forcm, the equivalence holds true. For instance, a total absorber with a volume of 0.250 cm3 yields a temporal perturbation quite similar to an optical inhomogeneity with a volume of 1 cm3 and (data not shown).
Apart from the central black disk, the medium boundary was air (92% of the imaged area), thus was used for the refractive index of the external medium. Yet, some perturbations caused by the different refractive index of the black holder cannot be ruled out.
The available source power in this experiment was rather low (1 mW). Results presented on simulations show that a gain in SNR could indeed lead to a better spatial resolution and localization. Thus, there is large space for improvement, considering that around 100 mW of source power could be used in vivo, provided that the source diameter is enlarged (e.g. 0.5-0.7 cm) so to stay within the safety limits. Yet, the power stability of the source needs to be well controlled so to permit detection of time-gated intensity changes as low as 1%.
5.3. Potential application to functional imaging of the brain
One of the key advantages of the proposed approach is the exploitation of both significant light harvesting as well as optimal collection of available information. As a consequence a full 3D acquisition is feasible in a relatively short time. Phantom measurements have been demonstrated with a total acquisition time per reconstructed image of 15 s. The available power was just 1 mW, with room for a realistic gain by 2 orders of magnitude, possibly resulting in better image quality and/or reduced acquisition time. This makes the technique particularly appealing for in vivo functional imaging, involving the reconstruction of absorption changes compared to an initial reference state.
The study of the applicability of this approach to in vivo functional imaging will be addressed in the near future with the aid of a more powerful source. By now we just performed some preliminary tests on a shaved subject leading to 3 observations: i) when the subject is lying on a bed, it is rather easy to keep the same working distance of the camera from the head (20 cm) and field of view (5.5x7.0 cm2) as for phantom measurements; ii) the signal level at 690 nm is similar to what observed on phantoms; iii) movement artifacts seem not to be so critical, with a shift in the position of the launching fiber, identified by the black cylinder fiber holder, less than the size of one voxel (<3 mm) during 15 min.
Clearly, the presence of hair could hamper practical applicability of the proposed approach. In any case, all measurements performed on the forehead (e.g. those related to cognitive tasks) could be easily managed. Also, on regions covered by hair, proper combing could create rows or zones of exposed skin. We will study whether this kind of reduced data set is still valuable to provide 3D reconstruction.
6. Conclusion
We have proposed a novel scheme to functional tomography based on a single source injection point and on a time-gated ICCD camera for detection. A non-contact modality is adopted for collection, with direct imaging of the medium surface via the camera lens. Shielding of a small region around the launching fiber helps preventing reduction of the useful dynamic range. Simulations of a localized perturbation of the absorption coefficient demonstrate the feasibility of the proposed approach both for detection and localization of a small perturbation, with an image quality clearly dependent on the SNR. Phantom measurements using black PVC cylinders demonstrate detection of a 0.050 cm3 perturbation down to a depth of 2 cm within a diffusive tissue-like medium. Also, fairly good localization is achieved both in depth and lateral direction, while spatial resolution and contrast is degraded for increasing depth. Total acquisition time to acquire a full 3D data set was 15 s for an injected power of 1 mW. Work is in progress to study the applicability of this method to in vivo functional imaging of the brain and to exploit more powerful (100 mW) sources.
Acknowledgments
The research leading to these results has been partially funded by the European Community’s Seventh Framework Programme under the nEUROPt project (FP7-HEALTH-2007-201076).
References and links
- 1.Patterson M. S., Chance B., Wilson B. C., “Time resolved reflectance and transmittance for the non-invasive measurement of tissue optical properties,” Appl. Opt. 28(12), 2331–2336 (1989). 10.1364/AO.28.002331 [DOI] [PubMed] [Google Scholar]
- 2.Steinbrink J., Wabnitz H., Obrig H., Villringer A., Rinneberg H., “Determining changes in NIR absorption using a layered model of the human head,” Phys. Med. Biol. 46(3), 879–896 (2001). 10.1088/0031-9155/46/3/320 [DOI] [PubMed] [Google Scholar]
- 3.Liebert A., Wabnitz H., Steinbrink J., Obrig H., Möller M., Macdonald R., Villringer A., Rinneberg H., “Time-resolved multidistance near-infrared spectroscopy of the adult head: intracerebral and extracerebral absorption changes from moments of distribution of times of flight of photons,” Appl. Opt. 43(15), 3037–3047 (2004). 10.1364/AO.43.003037 [DOI] [PubMed] [Google Scholar]
- 4.Contini D., Torricelli A., Pifferi A., Spinelli L., Paglia F., Cubeddu R., “Multi-channel time-resolved system for functional near infrared spectroscopy,” Opt. Express 14(12), 5418–5432 (2006). 10.1364/OE.14.005418 [DOI] [PubMed] [Google Scholar]
- 5.Selb J., Stott J. J., Franceschini M. A., Sorensen A. G., Boas D. A., “Improved sensitivity to cerebral hemodynamics during brain activation with a time-gated optical system: analytical model and experimental validation,” J. Biomed. Opt. 10(1), 011013 (2005). 10.1117/1.1852553 [DOI] [PubMed] [Google Scholar]
- 6.Hebden J. C., Gibson A., Yusof R. M., Everdell N., Hillman E. M., Delpy D. T., Arridge S. R., Austin T., Meek J. H., Wyatt J. S., “Three-dimensional optical tomography of the premature infant brain,” Phys. Med. Biol. 47(23), 4155–4166 (2002). 10.1088/0031-9155/47/23/303 [DOI] [PubMed] [Google Scholar]
- 7.Hoshi Y., Oda I., Wada Y., Ito Y., Yutaka Yamashita M., Oda K., Ohta Y., Yamada, Mamoru Tamura, “Visuospatial imagery is a fruitful strategy for the digit span backward task: a study with near-infrared optical tomography,” Brain Res. Cogn. Brain Res. 9(3), 339–342 (2000). 10.1016/S0926-6410(00)00006-9 [DOI] [PubMed] [Google Scholar]
- 8.Selb J., Joseph D. K., Boas D. A., “Time-gated optical system for depth-resolved functional brain imaging,” J. Biomed. Opt. 11(4), 044008 (2006). 10.1117/1.2337320 [DOI] [PubMed] [Google Scholar]
- 9.J. Selb, E. M. C. Hillman, D. Joseph, and D. A. Boas, “Discrimination between superficial and cerebral signals during functional brain imaging with a time-gated system,” presented at the European Conferences on Biomedical Optics (ECBO), Munich, Germany, June 13–16, 2005. [Google Scholar]
- 10.Selb J., Dale A. M., Boas D. A., “Linear 3D reconstruction of time-domain diffuse optical imaging differential data: improved depth localization and lateral resolution,” Opt. Express 15(25), 16400–16412 (2007). 10.1364/OE.15.016400 [DOI] [PMC free article] [PubMed] [Google Scholar]
- 11.W. Becker, Advanced TCSPC with Advanced Time-Correlated Single Photon Counting Techniques (Springer, Berlin, Germany 2006). [Google Scholar]
- 12.Torricelli A., Pifferi A., Spinelli L., Cubeddu R., Martelli F., Del Bianco S., Zaccanti G., “Time-resolved reflectance at null source-detector separation: improving contrast and resolution in diffuse optical imaging,” Phys. Rev. Lett. 95(7), 078101 (2005). 10.1103/PhysRevLett.95.078101 [DOI] [PubMed] [Google Scholar]
- 13.Pifferi A., Torricelli A., Spinelli L., Contini D., Cubeddu R., Martelli F., Zaccanti G., Tosi A., Mora A. D., Zappa F., Cova S., “Time-resolved diffuse reflectance at null source-detector separation using a fast gated single-photon avalanche diode,” Phys. Rev. Lett. 100(138), 101 (2008). [DOI] [PubMed] [Google Scholar]
- 14.P. Sawosz, M. Kacprzak, A. Liebert, and R. Maniewski, “Application of time-gated, intensified CCD camera for imaging of absorption changes in non-homogenous medium,” in 11th Mediterranean Conference on Medical and Biomedical Engineering and Computing 2007, T. Jarm, P. Kramar, and A. Zupanic, eds., vol. 16 of IFMBE Proceedings (International Federation for Medical and Biological Engineering, 2007), pp. 410–412 [Google Scholar]
- 15.Schulz R. B., Peter J., Semmler W., D’Andrea C., Valentini G., Cubeddu R., “Comparison of noncontact and fiber-based fluorescence-mediated tomography,” Opt. Lett. 31(6), 769–771 (2006). 10.1364/OL.31.000769 [DOI] [PubMed] [Google Scholar]
- 16.Del Bianco S., Martelli F., Zaccanti G., “Penetration depth of light re-emitted by a diffusive medium: theoretical and experimental investigation,” Phys. Med. Biol. 47(23), 4131–4144 (2002). 10.1088/0031-9155/47/23/301 [DOI] [PubMed] [Google Scholar]
- 17.Carraresi S., Shatir T. S. M., Martelli F., Zaccanti G., “Accuracy of a perturbation model to predict the effect of scattering and absorbing inhomogeneities on photon migration,” Appl. Opt. 40(25), 4622–4632 (2001). 10.1364/AO.40.004622 [DOI] [PubMed] [Google Scholar]
- 18.Arridge S. R., “Optical tomography in medical imaging,” Inverse Probl. 15(2), R41–R93 (1999). 10.1088/0266-5611/15/2/022 [DOI] [Google Scholar]
- 19.H. W. Engl, M. Hanke, and A. Neubauer, Regularization of Inverse Problems (Kluwer, Dordrecht, 1996). [Google Scholar]
- 20.Contini D., Martelli F., Zaccanti G., “Photon migration through a turbid slab described by a model based on diffusion approximation. I. Theory,” Appl. Opt. 36(19), 4587–4599 (1997). 10.1364/AO.36.004587 [DOI] [PubMed] [Google Scholar]
- 21.F. Martelli, S. Del Bianco, A. Ismaelli, and G. Zaccanti, Light Propagation Through Biological Tissue and Other Diffusive Media (SPIE, Bellingham, Washington, 2010), Chaps. 4 and 7. [Google Scholar]
- 22.Azizi L., Zarychta K., Ettori D., Tinet E., Tualle J.-M., “Ultimate spatial resolution with diffuse optical tomography,” Opt. Express 17(14), 12132–12144 (2009). 10.1364/OE.17.012132 [DOI] [PubMed] [Google Scholar]
- 23.Sassaroli A., Martelli F., Fantini S., “Perturbation theory for the diffusion equation by use of the moments of the generalized temporal point-spread function. III. Frequency-domain and time-domain results,” J. Opt. Soc. Am. A 27(7), 1723–1742 (2010). 10.1364/JOSAA.27.001723 [DOI] [PMC free article] [PubMed] [Google Scholar]
- 24.Spinelli L., Martelli F., Farina A., Pifferi A., Torricelli A., Cubeddu R., Zaccanti G., “Calibration of scattering and absorption properties of a liquid diffusive medium at NIR wavelengths. Time-resolved method,” Opt. Express 15(11), 6589–6604 (2007). 10.1364/OE.15.006589 [DOI] [PubMed] [Google Scholar]


