Abstract
Atherosclerotic plaques are distributed differently in the aortic arches of C57BL/6 (B6) and 129/SvEv (129) apolipoprotein E (apoE)- deficient mice. It is now recognized that hemodynamic shear stress plays an important role in the localization of atherosclerotic development. Since the blood flow field in the vessel is modulated by the vascular geometry, we quantitatively examined the difference in the aortic arch geometry between the two corresponding wild-type mouse strains. The three-dimensional (3-D) geometry of fourteen murine aortic arches, seven from each strain, was characterized using casts and stereo microscopic imaging. Many geometric features, including aortic arch shape, vessel diameter, and branch locations were significantly different at p<0.05 between the two mouse strains. Based on the geometry of each cast, an average 3-D geometry of the aortic arch for each mouse strain was obtained, and computational fluid dynamic calculations were performed in the two average aortic arches. Lower shear stress was found at the inner curvature of the aortic arch in the 129 strain, corresponding to greater involvement in the corresponding apoE-deficient mice relative to the B6 strain. These results support the notion that heritable features of arterial geometry can contribute to individual differences in local susceptibility to arterial disease.
Keywords: Mouse model, Aortic arch, Atherosclerosis, Geometric risk factors, Stereo light microscopic imaging, Computational fluid dynamics, Wall shear stress
INTRODUCTION
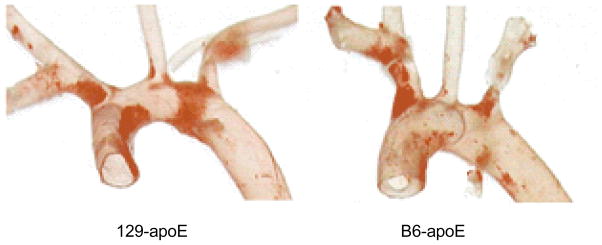
Atherosclerotic cardiovascular disease is the leading single cause of mortality worldwide.1 Over the last decade, the mouse has become an important animal model for studying atherosclerosis, owing to the availability of knockouts that demonstrate rapid development of human-like vascular disease and pure strains that have a defined genetic background, and its relatively low cost.2,5,18,25 In earlier work, it was observed that atherosclerotic plaques could develop in the aortic arches of both apolipoprotein E (apoE)-deficient C57BL/6 (B6) and 129/SvEv (129) mice, even on regular chow. Although the disease distributions showed similar patterns within each strain, there were differences between the two strains (e.g., Fig.1).17 Generally, in both B6 and 129 strains, fatty plaques are similar in the aortic sinus area, extending into the first branch (right innominate artery). However, while the B6 has very little plaque in the more distal aortic arch, much more involvement is seen in the inner curvature of the aortic arch in the 129 strain. This suggests that local factors affecting the development of disease in the aortic arch differ between the two strains.
Fig. 1.
Different plaque distributions in apoE-deficient C57BL/6 and 129/SvEv mice visualized by Sudan IVB staining.
There is ample evidence that vessel wall mechanics and hemodynamics are involved in atherosclerotic development.9,10,24 Unlike the traditionally identified risk factors, such as hypertension, smoking, inactivity, obesity, hypercholesterolemia, diabetes, and male gender, which are all systemic, mechanical and hemodynamic stresses vary spatially and may play a role as localizing factors for the disease. Possible biomechanical factors that have been proposed include low fluid dynamic shear stress and impaired mass transfer, concentrations of mechanical stress in the wall, long near-wall residence times, oscillatory or reversing shear stress including the presence of high harmonics of shear, high spatial or temporal gradients in shear, and an imprecisely defined “disturbed flow” characterized by oscillatory and low mean stress, and possibly including true turbulence. Among these factors, hemodynamic wall shear stress (WSS) is the most studied; nevertheless it is still a relatively new topic in mice.7,11,13,22
From fundamental mechanics, both the fluid dynamics in the vessel and the stress distribution in the vessel wall are dependent on the vessel geometry. Therefore, it is plausible that some geometric features may affect the course of atherosclerosis through their influence on the local mechanical environment; those that promote atherogenesis would be “geometric risk factors”.8 Following this reasoning, the differences between disease progression in the aortic arches of B6 and 129 apoE-deficient mice could be, to some extent, a consequence of different distributions of hemodynamic or mechanical stress in the two strains, originating from corresponding differences in aortic arch geometry.
Our goal for this study was to quantitatively compare the arterial geometry and the hemodynamic WSS in the aortic arch between B6 and 129 mice. Since no difference is seen between the aortic arch geometry of wild-type and knockout mice in either strain, wild-type mice were used here to assess the potential role of geometric differences in determining the different disease distributions in the aortic arches of the two mouse strains. In this paper, the three-dimensional (3-D) axes of B6 and 129 aortic arches are reconstructed from their casts using stereo light microscopic imaging. Then, the cast axes are characterized by several geometric parameters and compared between the two mouse strains. Vessel diameters along the aortic arch are also obtained from the casts and compared. Finally, using the 3-D axes and vessel diameters, an average aortic arch is generated for each strain, and is used for computational fluid dynamics (CFD) simulation and estimation of WSS.
MATERIALS AND METHODS
Mice and Aortic Cast Preparation
Mouse surgeries and cast preparation were performed in the Department of Pathology and Laboratory Medicine, University of North Carolina at Chapel Hill (UNC-CH).
Seven B6 and seven 129 male wild-type mice were used for geometry characterization. They were six months of age, and weighed 24–28 grams at sacrifice. Mice were maintained on a regular chow and experiments were carried out under protocols approved by the Institutional Animal Care and Use Committee of UNC-CH.
Aortic casts were made using Batson’s No. 17 Plastic Replica and Corrosion Kit (Polysciences Inc., Warrington, PA). Immediately following a lethal dose of avertin, the aorta of each mouse was catheterized with MRE 025 tubing (Braintree Scientific Inc., Braintree, MA) just proximal to the iliac bifurcation. The mouse was then perfused, first with 3 ml heparinized saline (40 u/ml), and then with freshly prepared casting material, until approximately 1.0–1.5 ml had been infused over approximately 4–5 minutes. A small puncture of the vena cava allowed draining of the vascular bed and exit of excess casting material. Carcasses were stored at 4 °C overnight and subsequently placed in a maceration solution (saturated KOH) at 37 °C with frequent volume changes to clear surrounding tissue (24–48 hrs). Small branches were trimmed, leaving only the aorta and major branches for imaging.
Cast Imaging and 3-D Axis Reconstruction
Aortic cast imaging, image processing, data analysis, and hemodynamics simulations were carried out in the Cardiovascular Simulation Laboratory at Duke University.
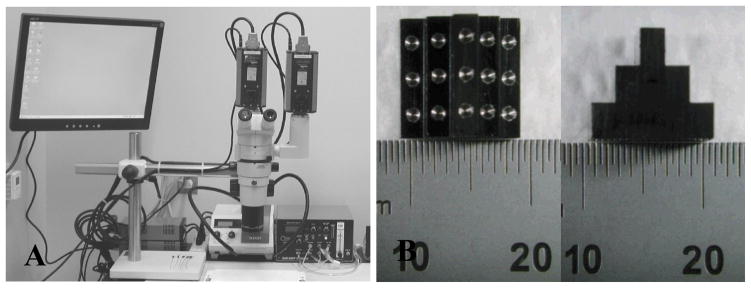
The imaging system (Fig. 2A) is based on a Nikon SMZ1000 stereomicroscope (Nikon Instruments, Melville, NY) with a 0.5X objective, a dual beam splitter, and a Schott KL 2500 LCD fiber-optic light source (Schott, Marlborough, MA). Two PCO 1600 high-performance digital CCD cameras (The Cooke Corporation, Romulus, MI) are mounted on the dual beam splitter to capture stereo images. The captured images are stored on the cameras’ internal memory, and downloaded to a computer through IEEE 1394 cables.
Fig. 2.
(A) The stereo light microscopic imaging system; (B) Top and side views of the calibration device (scale is mm).
All fourteen aortic casts were imaged using the same microscope settings. To facilitate the image processing, the light source was adjusted to optimize the contrast between the casts and the background. After all cast images were captured, and without disturbing the microscope, a calibration device (Fig. 2B), which contains fifteen round markers whose relative locations are known, was imaged in approximately the same location as the casts.
The positions of the markers in the two images are located by circle detection using a Hough transform.20 From the known locations of the markers in 3-D and the 2-D positions of the markers in the stereo images, the 3-D to 2-D projection transformation (the “projection matrix”) can be determined for each stereo view. Using the two projection matrices, a 3-D point can be reconstructed from 2-D stereo images under the epipolar constraint.12
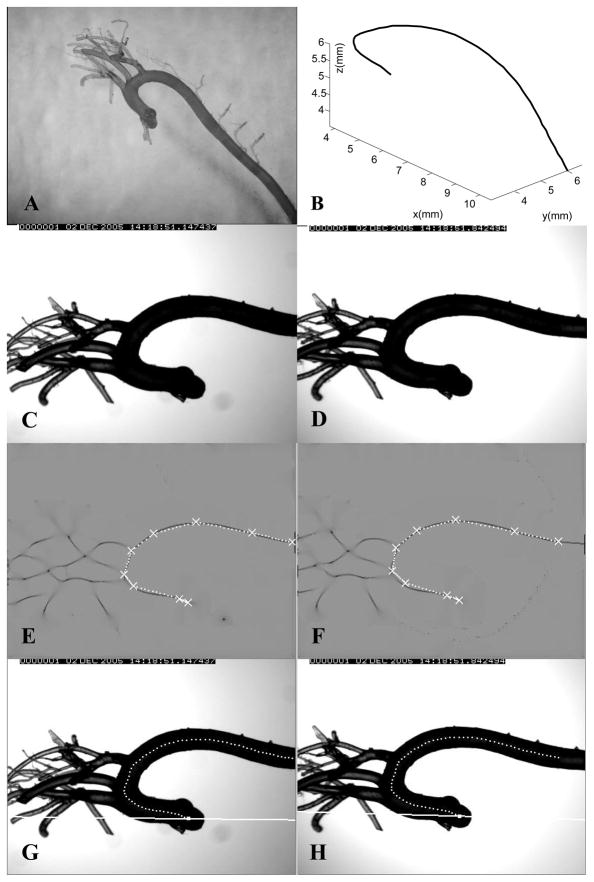
Fig. 3A shows a B6 cast. Figs. 3C and 3D are a pair of stereo images of the cast. For each cast, to extract the aortic axis, we first smoothed the image using a Gaussian filter and performed a “creaseness” computation16 to greatly enhance the centerlines of the cast in the two images (Figs. 3E and 3F). Creaseness is a measure of the maximum curvature of the gray level surface at a given point in an image. After smoothing, the gray level profile transverse to the axis forms a valley shape, and creaseness is high along the axis. After the centerline is enhanced, several candidate points along the axis are marked in one image. Using the two projection matrices and epipolar lines, these points are paired with the corresponding points in the other image. Each point pair represents the projections of the same 3-D “source” point. The 3-D locations of these source points are reconstructed, and they are initially connected by straight lines as an initial estimate of the 3-D cast axis (Figs. 3E and 3F). Finally, this initial 3-D curve is refined to obtain an estimate of the real axis by minimizing an energy function defined on the curve; the energy function consists of external forces that arise from the object creaseness in the two images, as well as an internal force to control the smoothness of the curve. The final reconstructed 3-D axis of the cast is shown in Fig. 3B. Its stereo projections are shown in Figs. 3G and 3H. The 3-D axes of the major branches off the aortic arch are reconstructed similarly.
Fig. 3.
(A) An aortic cast from a C57BL/6 (B6) mouse; (B) The reconstructed 3-D axis of the cast; (C) and (D) Two stereo images of the B6 aortic cast in Fig. 3A; (E) and (F) Computed creaseness (intensity from grey to dark) and the initial plan of the cast axis (white), for the same stereo images; (G) and (H) Final axis projected on the two original images, showing the epipolar lines for the most proximal point.
Characterization of Aortic Arch Geometry
Objective definition of the aortic arch region
In describing the murine anatomy, the aortic arch normally refers to an extended segment consisting of most of the ascending aorta, the aortic bend, and a proximal portion of the descending aorta, with three major branches off this area; in sequence from proximal to distal, they are the right innominate artery (RIA), the common carotid artery (CCA), and the subclavian artery (SCA).4 To characterize the geometry of the aortic arch in the consistent fashion needed for comparison studies, an objective definition of the region is required. Therefore, for the purpose of our study, we define the aortic arch as the symmetrical portion of the aorta, shaped like an inverted “U”, starting from the aortic root. Based on this definition, the distal end of the aortic arch is obtained by finding the point along the vessel axis such that the curve between the aortic root and that point is most symmetrical in the best-fit plane of the curve. This is achieved in the following fashion:
The portion of the axis from the aortic root (the initial point) to the candidate termination point is projected onto its best-fit plane;
In this plane, a coordinate system is defined: the y-axis is defined by the vector in the plane between the two projected end points, and the x-axis is perpendicular to the y-axis, with the origin midway between the two end points;
The skewness of the projected axis segment in the x-y plane is calculated, and the candidate termination point that yields the minimum skewness is defined as the termination of the aortic arch.
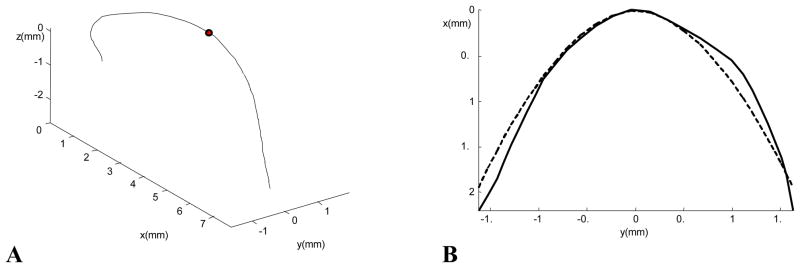
A new coordinate system is also established in this way, for further calculation. The x-y plane is the best-fit plane of the aortic arch, and the x-axis is the axis of symmetry of the arch in the plane. For the convenience of characterizing the geometric features of the arch axis, the origin of the coordinate system is moved to the intersection of the x-axis and the vessel axis, with the x-axis directed caudally. Fig. 4A shows the aortic arch segment in Fig. 3B transformed to this standard coordinate system. The arch portion extends from the origin of the axis at the aortic root to the marked dot.
Fig. 4.
(A) The 3-D cast axis transformed to the standard coordinate system defined in the text. The aortic arch extends from the aortic root to the marked dot; (B) The axis of the aortic arch (solid curve) projected on its best-fit plane, and the power function fit to the axis (dashed curve).
Geometric features of the aortic axis
After the aortic arch region was defined, four sets of geometric features of the arch were examined.
The shape of the arch is obtained from the 2-D projection of its axis onto its best-fit plane. A power function x= a|y|b is used to fit the curve (Fig. 4B). The smaller the b value, the sharper the arch is at its peak (y = 0). In addition, we measure the deviation from planarity (DFP) of the aortic arch, which is defined as the root-mean-square deviation between the axis of the arch and its projection on to its best-fit plane.
The vessel diameters of the aortic arch and the three branches are measured from the casts manually using a vernier caliper. For each aortic arch, in-plane and out-of-plane diameters are measured at six sites along the vessel in the arch area as in Fig. 5, and measurements are made at four more downstream sites for CFD purposes. The diameter of each major branch is measured about one vessel diameter from its ostium. For normalization purposes (see below), the diameter at each site is defined as the geometric mean of the two orthogonally measured diameters, and the mean diameter of the aortic arch is represented by the average of the diameters at the six proximal sites.
Fig. 5.
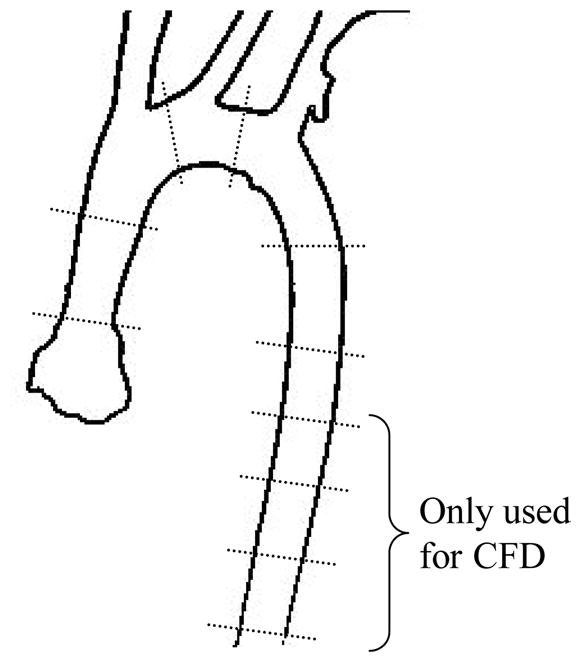
Diameter measurement sites along the aortic arch. The measurements at the four distal sites are only used for computational fluid dynamics.
The branch locations on the aortic arch are characterized. A method similar to Brinkman et al3 is used to determine the branch locations. First, the 3-D axis of a branch vessel is reconstructed in a fashion similar to the aorta. Then the proximal axis of the vessel, over a length of two vessel diameters, is fitted by a straight line, and the branch location on the aortic arch is the closest point on the arch axis to that line. The distance from the symmetry point to each branch, measured along the axis, is recorded. If the branch is proximal to the symmetry point, the distance is negative; otherwise, it is positive. Next, this distance is normalized by the diameter of the aortic arch.
Two branch angles are needed to uniquely determine the relationship between a branch and the aortic arch in 3-D. Based on the Frenet-Serret frame in differential geometry, the tangential angle (between the branch and the tangential direction of the arch axis) and the normal angle (between the branch and the normal direction of the arch axis) are calculated.
Statistical Analysis
Statistical analyses were performed using JMP 6.0 (SAS Institute Inc., Cary, NC). Data are presented as mean ± standard deviation for continuous variables. Student’s t-tests were used to compare each of the geometrical parameters between the B6 and 129 strains. The results are considered statistically significant when p<0.05.
Computational Hemodynamics
To perform the 3-D hemodynamic simulations, an average shape of the aortic arch of each mouse strain was constructed. First, a cylindrical coordinate system was established for each arch with the out-of-plane direction as the z axis and the origin at the midpoint of a straight line connecting the projections of the arch axis at the aortic root and the termination of the arch, as described previously. In this way, all aortic arches in each strain can be transformed to the same coordinate system and an average shape can more readily be determined. Rays were constructed from the origin in the best-fit plane; at each angle, the radial and z coordinates of the arch axes in each strain were averaged. The branch axes were placed along the average aortic arch axis based on their average locations and branch angles.
Computational meshes for each strain were generated using Gambit (version 2.3, ANSYS, Inc.) with custom user defined functions. Briefly, the procedure was as follows: first, the vessel diameters at the ten measurement sites were associated with their corresponding arch axial locations. The diameters between those sites were interpolated using cubic splines. Then, a series of ellipses were generated along the centerline to create the vessel lumen, using the in-plane and out-of-plane diameter measures. Since the aortic arch is not in a plane, the orientations of the ellipses along the arch axis were gradually rotated along the axial curve according to the Frenet-Serret frame of the curve. The three major branches off the arch were modeled as straight cylinders, approximately ten diameters long. The junctions between the branches and the arch were not smoothed. A hexahedral mesh was then generated in Gambit. Mesh-independence studies showed a mesh with 440,000 – 550,000 nodes was sufficient for the subsequent hemodynamic simulations.
The unsteady Navier-Stokes equations were numerically solved using commercial software (Fluent 6.3, ANSYS, Inc., Canonsburg, PA). Newtonian blood rheology and a kinematic viscosity of 3.5 cS were assumed.
To obtain the strain-specific inlet flow waveforms, high resolution ultrasound imaging was performed at the Centre for Modeling Human Disease (Toronto, Canada). The cardiac output of mice does not change much after eight weeks of age.21 Here, ten-week-old wild type B6 (n=8) and 129 (n=8) mice were used for inlet flow waveform measurements. The mice were anesthetized with 1.5% isoflurane. Blood flow velocity was measured at the ascending aorta using an ultrasound biomicroscope (Vevo 770, VisualSonics, Toronto, Canada) as described in Zhou et al.26 Inlet flow waveforms were then averaged within each strain. The heart rates of both strains were decreased from ~650 to ~450 min−1 under isoflurane. Since the decrease in cardiac output under anesthesia is primarily due to the decrease in heart rate,15 the measured waveforms were scaled to the conscious heart rate by compressing the diastolic portion while maintaining the systolic portion. After scaling, the ejection time was about half of the cardiac cycle for both strains, which is consistent with measurements in conscious mice.14
A blunt velocity profile was applied at the inlet, and a stationary vessel wall was assumed. The outlet flow rates were specified as 15%, 8%, 7% and 70% of the inlet flow rate for the RIA, CCA, SCA and distal descending aorta respectively, based on the measurements by Feintuch et al.7 A time step size of 0.5 ms was used, and the wall shear stress was calculated at every time step.
RESULTS
Comparison of the Geometry of the Aortic Arch in the Two Strains
The geometry characterization results are listed in Tables 1 and 2.
TABLE 1.
Comparison of the geometric features of the aortic arch region of C57BL/6 and 129/SvEv mice. Data are presented as mean±SD. See text for definitions of parameters.
| Mouse Strain |
||||
|---|---|---|---|---|
| Parameter | C57BL/6 (n=7) | 129/SvEv (n=7) | p-value | |
| Shape | a | 0.50±0.27 | 0.44±0.12 | NS |
| b | 2.51±0.58 | 3.20±0.57 | 0.022 | |
| DFP (mm) | 0.059±0.046 | 0.125±0.075 | 0.049 | |
| Vessel Diameter (mm) | In-plane | 0.93±0.15 | 0.84±0.10 | <0.001 |
| Out-of-plane | 0.88±0.13 | 0.72±0.10 | <0.001 | |
| Branch Locations | RIA | −0.46±0.80 | −2.01±1.21 (n=6) | 0.013 |
| CCA | 0.25±0.49 (n=6) | −0.68±1.13 | 0.041 | |
| SCA | 1.40±0.59 | 0.93±0.78 | NS | |
TABLE 2.
Comparison of the branch diameters and angles between C57BL/6 and 129/SvEv mice. See text for definitions of the branch angles.
| Mouse Strain |
||||
|---|---|---|---|---|
| Parameter | C57BL/6 (n=7) | 129/SVEV (n=7) | p-value | |
| RIA | Diameter (mm) | 0.54±0.1 | 0.54±0.07 | 0.949 |
| Tangential Angle (°) | 68.84±31.06 | 48.22±18.07 | 0.228 | |
| Normal Angle (°) | 85.53±30.03 | 115.18±20.10 | 0.039 | |
| CCA | Diameter (mm) | 0.38±0.05 | 0.39±0.06 | 0.673 |
| Tangential Angle (°) | 75.02±12.60 | 63.68±11.94 | 0.961 | |
| Normal Angle (°) | 125.51±6.62 | 119.31±12.87 | 0.551 | |
| SCA | Diameter (mm) | 0.47±0.07 | 0.47±0.08 | 0.914 |
| Tangential Angle (°) | 98.04±16.23 | 93.09±15.31 | 0.569 | |
| Normal Angle (°) | 132.91±9.30 | 123.37±8.97 | 0.075 | |
Regarding the shape of the aortic arch (Table 1), the value of the exponent b for the 129 strain is the larger one, indicating that their aortic arches are blunter at the peak than those of the B6 strain. The DFP of the 129 strain is about twice that of the B6 strain, indicating that the aortic arch of B6 mice is more planar than that of 129 mice. B6 mice have a larger arch diameter than 129 mice; however, the branch diameters in the two strains are similar (Table 2).
Relative to the symmetry point of the aortic arch, the locations of the first two branches, the RIA and CCA, are different in the two mouse strains (Table 1). Furthermore, while the distance between the RIA and SA spans about two diameters of the aortic arch in the B6 strain, it extends about three diameters in the 129 strain. On average, the midpoint of the aortic arch lies between the RIA and CCA branches in the B6 mice, and between the CCA and SA branches in the 129 mice. However, few interstrain differences were seen in the branch angles (Table 2).
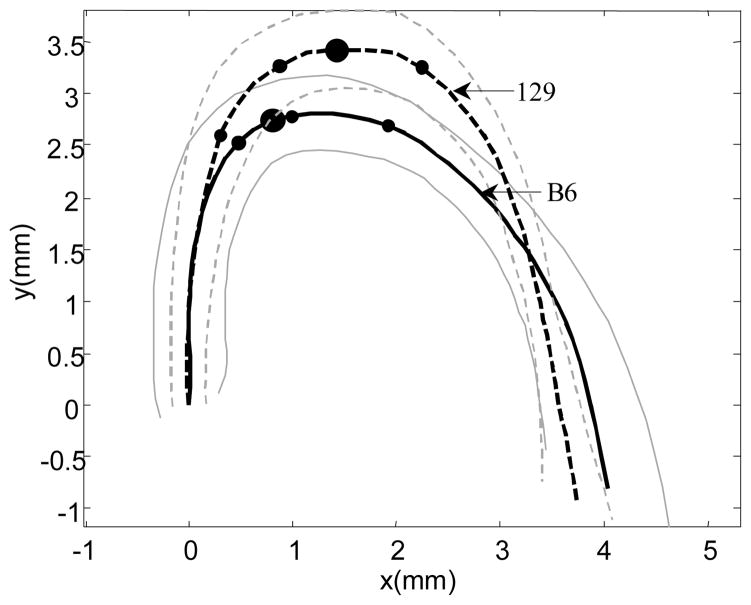
Figure 5 shows the average shapes of the two arches projected on to their best-fit planes (Fig. 5). This provides a visualization of the interstrain differences in geometry that is difficult to obtain from the derived parameters alone. The average shapes in the two stains are aligned so that the tangents to the axes at the origin of the arches coincide.
Comparison of WSS in the Two Strains
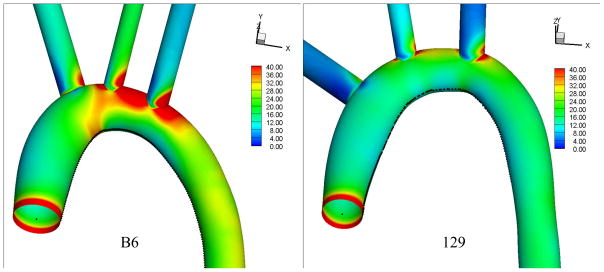
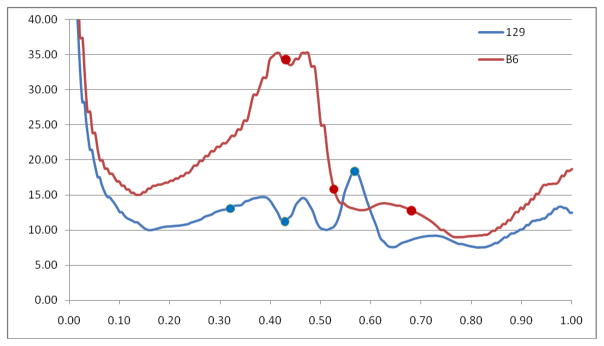
The time average WSS magnitude calculated from the CFD simulations in the average aortic arches of B6 and 129 mice are shown in Fig. 6. The WSS in the B6 strain exceeds that in the 129 strain throughout most of the aortic arch. The WSS profiles along the inner curvature of the arch in the two mouse strains are compared in Fig. 7. The mean WSS along the inner curvature line in the B6 strain (17.5 Pa) is more than 50% higher than that in the 129 strain (11.2 Pa), and the maximum WSS in the B6 strain (35.2 Pa) is about twice that in the 129 strain (17.5 Pa).
Fig. 6.
Comparison of the average shapes of the B6 (solid curve) and 129 (dashed curve) aortic arches in their respective best-fit plane. The corresponding ±1 SD envelopes are shown in the same line styles in grey. The two aortic axes are aligned at the aortic root along each vessel’s tangent direction at the root. On each aortic axis, the large dot represents the symmetry point of the aortic arch as defined in Materials and Methods, and the three small dots denote the average locations of the right innominate, common carotid and subclavian ostia.
Fig. 7.
Time averaged wall shear stress magnitude in the aortic arches of B6 (left) and 129 (right) mice.
DISCUSSION
It is well known that the distribution of vascular disease in humans is not uniform, but rather shows a predilection for particular sites.6 It is the same in the mouse.19 Such phenomena cannot be explained by the traditionally established risk factors, which are all systemic. Vascular hemodynamics and mechanical stresses might interact with the systemic risk factors to cause the site selectivity of the disease.23 Although it is not fully clear which mechanical factors mediate the atherosclerotic process, all of the candidates are influenced by vascular geometry. Geometric risk factors would complement the traditionally established risk factors.
In this study, we have compared objective geometric features of the aortic arch in two wild-type mouse strains, the C57BL/6 and the 129/SvEv, in which the corresponding apoE – deficient strains exhibit different disease patterns. These features were obtained from stereo light microscopic images of vascular casts.
The statistical results show that the B6 and 129 mice exhibit significant differences in aortic arch geometry. The shapes and diameters of the arch, and the branch locations, in the two strains are all significantly different. Each of these geometric parameters can influence the fluid dynamics in the aortic arch.
The CFD simulation results indicate that the WSS in the aortic arches of the two mouse strains are significantly different. The 129 strain experiences a much lower WSS in the aortic arch area than does the B6 strain, and exhibits more plaque development in this region.17 This is consistent with the hypothesis that low WSS promotes the development of atherosclerotic lesions. Although it must be acknowledged that this result could also be caused by differences in the atherosusceptibility of the apoE-deficient variants of the two strains, it also has to be noted that both strains show similar plaque patterns at the aortic sinus area, extending into the right innominate artery. Therefore, it is plausible that the high shear stress in B6 mice protects the inner curvature of the aortic arch from greater involvement.
In addition to the vessel geometry, inlet blood flow velocity is also a factor affecting the WSS. The higher WSS in the B6 strain could be due to the larger time averaged inlet flow velocity (284.7 mm/s in the B6, 224.0 mm/s in the 129). However, this effect is opposed by the larger diameter of the B6 strain (1.01 mm inlet diameter in the B6, 0.76 mm in the 129). In a long straight tube, the time-average WSS in fully developed flow is proportional to V/D, where V is the temporally and spatially averaged velocity and D is the tube diameter. In the absence of geometry effects, considering only the inlet blood flow velocity and inlet vessel diameter, B6 mice (V/D = 282 1/s) would be expected to experience a WSS similar to, or even lower than, the WSS in 129 mice (V/D = 295 1/s). However, the CFD results show the opposite relationship. Therefore, differences in the geometries of the two aortic arches must play a critical role in determining the relationship between the WSS values in the two strains. This is consistent with the “geometric risk factor” hypothesis. Further investigation is needed to examine the interplay between aortic arch shape, vessel taper and branch location and flow in determining the distribution of WSS in the two strains.
Just as children look like their parents, some internal forms, such as vascular geometry, may also be inherited. In this study, the geometric features of the aortic arch have shown similarities within each of two pure mouse strains. Therefore, the well documented familial linkage of atherosclerosis might be the result, at least in part, of genetically determined characteristics manifested in vessel geometry. The mouse appears to be an excellent model in which to examine the heritability of vascular geometry, as well as its implications regarding disease susceptibility.
Fig. 8.
Wall shear stress profile along the inner curvature of the aortic arch of B6 and 129 mice. The dots mark the ostia of the three branches off the arch.
Acknowledgments
This work is supported in part by NIH grants HL058856 (MHF, HZ, DSL, FLB), HL050442 (MHF, JZ). HL042630 (NM), HL083715 (DSL), and EB001630 (DSL). We would like to acknowledge the Centre for Modeling Human Disease (www.cmhd.ca) for their technical services.
References
- 1.Preventing chronic diseases: a vital investment. Geneva: World Health Organization; 2005. p. 182. [Google Scholar]
- 2.Breslow JL. Mouse Models of Atherosclerosis. Science. 1996;272:685–688. doi: 10.1126/science.272.5262.685. [DOI] [PubMed] [Google Scholar]
- 3.Brinkman AM, Baker PB, Newman WP, Vigorito R, Friedman MH. Variability of human coronary-artery geometry - an angiographic study of the left anterior descending arteries of 30 autopsy hearts. Ann Biomed Eng. 1994;22:34–44. doi: 10.1007/BF02368220. [DOI] [PubMed] [Google Scholar]
- 4.Cook MJ. The anatomy of the laboratory mouse. New York: Academic Press; 1965. p. 143. [Google Scholar]
- 5.Daugherty A. Mouse models of atherosclerosis. Am J Med Sci. 2002;323:3–10. doi: 10.1097/00000441-200201000-00002. [DOI] [PubMed] [Google Scholar]
- 6.Debakey ME, Lawrie GM, Glaeser DH. Patterns of Atherosclerosis and Their Surgical Significance. Ann Surg. 1985;201:115–131. doi: 10.1097/00000658-198502000-00001. [DOI] [PMC free article] [PubMed] [Google Scholar]
- 7.Feintuch A, Ruengsakulrach P, Lin A, Zhang J, Zhou YQ, Bishop J, Davidson L, Courtman D, Foster FS, Steinman DA. Hemodynamics in the mouse aortic arch as assessed by MRI, ultrasound, and numerical modeling. Am J Physiol Heart Circ Physiol. 2007;292:H884–H892. doi: 10.1152/ajpheart.00796.2006. [DOI] [PubMed] [Google Scholar]
- 8.Friedman MH, Deters OJ, Mark FF, Bargeron CB, Hutchins GM. Arterial Geometry Affects Hemodynamics - a Potential Risk Factor for Atherosclerosis. Atherosclerosis. 1983;46:225–231. doi: 10.1016/0021-9150(83)90113-2. [DOI] [PubMed] [Google Scholar]
- 9.Fung YC. Biomechanics : circulation. New York: Springer; 1997. p. 571. [Google Scholar]
- 10.Giddens DP, Zarins CK, Glagov S. The Role of Fluid-Mechanics in the Localization and Detection of Atherosclerosis. J Biomech Eng. 1993;115:588–594. doi: 10.1115/1.2895545. [DOI] [PubMed] [Google Scholar]
- 11.Greve JM, Les AS, Tang BT, Draney Blomme MT, Wilson NM, Dalman RL, Pelc NJ, Taylor CA. Allometric scaling of wall shear stress from mice to humans: quantification using cine phase-contrast MRI and computational fluid dynamics. Am J Physiol Heart Circ Physiol. 2006;291:H1700–H1708. doi: 10.1152/ajpheart.00274.2006. [DOI] [PubMed] [Google Scholar]
- 12.Hartley R, Zisserman A. Multiple view geometry in computer vision. Cambridge: Cambridge University Press; 2003. p. 655. [Google Scholar]
- 13.Huo Y, Guo X, Kassab GS. The Flow Field along the Entire Length of Mouse Aorta and Primary Branches. Ann Biomed Eng. 2008;36:685–699. doi: 10.1007/s10439-008-9473-4. [DOI] [PubMed] [Google Scholar]
- 14.Janssen B, Debets J, Leenders P, Smits J. Chronic measurement of cardiac output in conscious mice. Am J Physiol Regul Integr Comp Physiol. 2002;282:R928–R935. doi: 10.1152/ajpregu.00406.2001. [DOI] [PubMed] [Google Scholar]
- 15.Janssen BJA, De Celle T, Debets JJM, Brouns AE, Callahan MF, Smith TL. Effects of anesthetics on systemic hemodynamics in mice. Am J Physiol Heart Circ Physiol. 2004;287:1618–1624. doi: 10.1152/ajpheart.01192.2003. [DOI] [PubMed] [Google Scholar]
- 16.Lopez AM, Lloret D, Serrat J, Villanueva JJ. Multilocal creaseness based on the level-set extrinsic curvature. Comput Vis Image Und. 2000;77:111–144. [Google Scholar]
- 17.Maeda N, Johnson L, Kim S, Hagaman J, Friedman M, Reddick R. Anatomical differences and atherosclerosis in apolipoprotein E-deficient mice with 129/SvEv and C57BL/6 genetic backgrounds. Atherosclerosis. 2007;195:75–82. doi: 10.1016/j.atherosclerosis.2006.12.006. [DOI] [PMC free article] [PubMed] [Google Scholar]
- 18.Meir KS, Leitersdorf E. Atherosclerosis in the Apolipoprotein E-Deficient Mouse: A Decade of Progress. Arterioscler Thromb Vasc Biol. 2004;24:1006–1014. doi: 10.1161/01.ATV.0000128849.12617.f4. [DOI] [PubMed] [Google Scholar]
- 19.Nakashima Y, Plump AS, Raines EW, Breslow JL, Ross R. Apoe-Deficient Mice Develop Lesions of All Phases of Atherosclerosis Throughout the Arterial Tree. Arterioscler Thromb. 1994;14:133–140. doi: 10.1161/01.atv.14.1.133. [DOI] [PubMed] [Google Scholar]
- 20.Sonka M, Hlavac V, Boyle R. Image processing, analysis, and machine vision. Pacific Grove, CA: PWS Pub; 1999. p. 770. [Google Scholar]
- 21.Stypmann J, Engelen MA, Epping C, van Rijen HVM, Milberg P, Bruch C, Breithardt G, Tiemann K, Eckardt L. Age and gender related reference values for transthoracic Doppler-echocardiography in the anesthetized CD1 mouse. Int J Cardiovasc Imaging. 2006;22:353–362. doi: 10.1007/s10554-005-9052-9. [DOI] [PubMed] [Google Scholar]
- 22.Suo J, Ferrara DE, Sorescu D, Guldberg RE, Taylor WR, Giddens DP. Hemodynamic Shear Stresses in Mouse Aortas: Implications for Atherogenesis. Arterioscler Thromb Vasc Biol. 2007;27:346. doi: 10.1161/01.ATV.0000253492.45717.46. [DOI] [PubMed] [Google Scholar]
- 23.VanderLaan PA, Reardon CA, Getz GS. Site specificity of atherosclerosis -Site-selective responses to atherosclerotic modulators. Arterioscler Thromb Vasc Biol. 2004;24:12–22. doi: 10.1161/01.ATV.0000105054.43931.f0. [DOI] [PubMed] [Google Scholar]
- 24.Yoshida Y, Yamaguchi T, Caro CG, Glagov S, Nerem RM. Role of Blood Flow in Atherogenesis. Tokyo: Springer-Verlag; 1988. p. 272. [Google Scholar]
- 25.Zadelaar S, Kleemann R, Verschuren L, de Vries-Van der Weij J, van der Hoorn J, Princen HM, Kooistra T. Mouse Models for Atherosclerosis and Pharmaceutical Modifiers. Arterioscler Thromb Vasc Biol. 2007;27:1706–1721. doi: 10.1161/ATVBAHA.107.142570. [DOI] [PubMed] [Google Scholar]
- 26.Zhou YQ, Foster FS, Nieman BJ, Davidson L, Chen XJ, Henkelman RM. Comprehensive transthoracic cardiac imaging in mice using ultrasound biomicroscopy with anatomical confirmation by magnetic resonance imaging. Physiol Genomics. 2004;18:232–244. doi: 10.1152/physiolgenomics.00026.2004. [DOI] [PubMed] [Google Scholar]


