Abstract
His93Gly sperm whale myoglobin (H93G Mb) has the proximal histidine ligand removed to create a cavity for exogenous ligand binding, providing a remarkably versatile template for the preparation of model heme complexes. The investigation of model heme adducts is an important way to probe the relationship between coordination structure and catalytic function in heme enzymes. In this study, we have successfully generated and spectroscopically characterized the H93G Mb cavity mutant ligated with less common alkylamine ligands (models for Lys or the amine group of N-terminal amino acids) in numerous heme iron states. All complexes have been characterized by electronic absorption and magnetic circular dichroism spectroscopy in comparison with data for parallel imidazole-ligated H93G heme iron moieties. This is the first systematic spectral study of models for alkylamine- or terminal amine-ligated heme centers in proteins. High-spin mono- and low-spin bis-amine-ligated ferrous and ferric H93G Mb adducts have been prepared together with mixed-ligand ferric heme complexes with alkylamine trans to nitrite or imidazole as heme coordination models for cytochrome c nitrite reductase or cytochrome f, respectively. Six-coordinate ferrous H93G Mb derivatives with CO, NO and O2 trans to the alkylamine have also been successfully formed, the latter for the first time. Finally, a novel high-valent ferryl species has been generated. The data in this study represent the first thorough investigation of the spectroscopic properties of alkylamine-ligated heme iron systems as models for naturally occurring heme proteins ligated by Lys or terminal amines.
Introduction
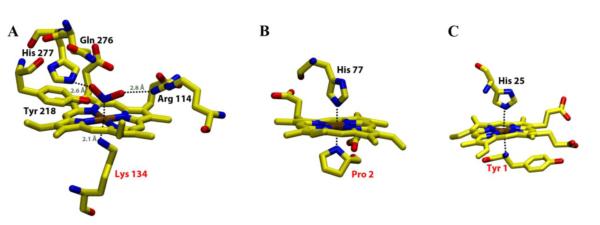
Investigations into the relationship between the active site coordination structure of heme enzymes and their catalytic activity has long fascinated chemists.1-3 Characterization of porphyrin models gives direct insight into the properties of the heme prosthetic group.3 Although His, Cys, Met and Tyr are the most commonly observed axial ligands in heme proteins, ligation by Lys or the amine group of N-terminal amino acids has been found in a number of native heme proteins possessing important biological function (Figure 1).4-7 Cytochrome c nitrite reductase (ccNiR) catalyzes the reduction of nitrite to ammonia and sulfite to sulfide with high specificity.4 The X-ray crystal structures of ccNiR from sulfurospirillum deleyianum4 and Wolinella succinogens5 reveal Lys to be the proximal high-spin ferric heme ligand with water in the distal site (Figure 1A). CO oxidation activator (CooA) is a dimeric heme b-containing CO-sensing transcription factor in the photosynthetic bacterium Rhodospirillum rubrum.6, 7 The 2.6 Å structure of ferrous Fe(II) CooA shows that in both subunits the N-terminal amine of Pro2 from one subunit is the axial ligand trans to the proximal His77 provided by the other subunit (Figure 1B).7 The membrane-bound cytochrome b6f complex is well-known to play an essential role in the oxygenic photosynthetic electron transfer chain.8, 9 The X-ray structure of truncated cytochrome f from Chlamydomonas reinhardtii has shown that the terminal-amino group of Tyr-1 coordinates trans to His-25 in the active site of this c-type heme protein (Figure 1C).8 The reason why these physiologically essential proteins feature less common alkylamine ligation in their active sites is unclear. The preparation of a systematic set of well-defined alkylamine-ligated ferrous, ferric and ferryl heme complexes is a useful first step toward a better understanding of the manner in which Lys and terminal amine ligation impacts on the structural and functional properties of heme centers in proteins.
Figure 1.
Schematic representation of the active site of (A) Fe(III) cytochrome c nitrite reductase (ccNiR) substrate (nitrite) complex heme-binding region5 showing coordination by substrate (nitrite) and the amine group of Lys; (B) Fe(II) CooA transcription factor heme-binding region7 showing coordination by His and the terminal amine of Pro; (C) Fe(III) cytochrome f heme-binding region8 showing coordination by His and the terminal amine of Tyr. All the structures were prepared using X-ray crystallography measurements obtained from Protein Data Bank pdb files (2E80 for ccNiR, 1FT9 for CooA and 1CFM for Cyt f). Atoms are shown in following colors: oxygen-red; nitrogen-blue; iron-brown and carbon-yellow.
Considerable effort has focused on generating synthetic heme active site analogues to directly probe the influence of axial ligation on heme group properties.3, 10-13 For example, six-coordinate Fe(II/III) heme complexes with imidazole (Im) and pyridine have been extensively characterized by X-ray crystallography,14 computational methods15 and spectroscopy16. In contrast, only limited data have been reported for alkylamine-ligated iron(III) porphyrins. In general, treatment of ferric porphyrins with excess amine leads to bis(amine)iron(II) adducts with the amine serving as a one-electron reductant.10, 17-19 For example, Epstein et al. reported that bis-(piperidine)iron(II) tetraphenylporphyrin, not the bis-ligated iron(III) complex, was formed by reacting chloroiron(III) tetraphenylporphine with piperidine.11 Marques et al. have described the preparation in methanol of an iron(III) amine-ligated hematohemin derivative with either hydroxide or water at the sixth ligand.13 Microperoxidases, heme-containing peptides obtained by proteolytic digestion of cytochrome c, contain His as the proximal heme iron ligand.20-23 Upon addition of excess amine, the distal site of microperoxidase-8 (an octapeptide) can be occupied by the amine to form a low-spin Fe(III) alkylamine/His heme adduct.24 However, no microperoxidase crystal structures have been reported to date. Moreover, microperoxidases often aggregate in water, i.e., the resulting complexes are not very stable.25
His93Gly sperm whale myoglobin (H93G Mb) has the proximal His replaced with the much smaller non-coordinating Gly leaving a cavity on the proximal side of the heme that can accommodate a wide variety of exogenous ligands.26, 27 The differential ligand binding affinities of the H93G Mb proximal and distal pockets facilitates generation of mixed-ligand heme iron derivatives not easily prepared with other heme systems.28 To improve our understanding of the electronic properties of the less commonly encountered amine-ligated heme protein centers, we report herein the first systematic study of ferrous, ferric and ferryl alkylamine-ligated heme complexes. The successful preparation of such adducts in different oxidation and spin states as models for Lys or terminal amine ligation will provide useful information about the influence of the amine ligand on the properties of the heme center. Compared to electronic absorption (EA) spectroscopy, magnetic circular dichroism (MCD) spectroscopy possesses a greater fingerprinting capacity and is therefore particularly useful for studying the electronic structure and the coordination modes of heme iron systems.29 The ability to prepare a variety of alkylamine-ligated heme iron adducts with H93G Mb will facilitate future studies into the electronic structure and reactivity of such complexes and further demonstrates the versatility of H93G Mb as a scaffold for the preparation of heme protein model complexes.
Experimental Section
Materials
Sperm whale H93G Mb was expressed and purified in the presence of 10 mM Im as previously described.27 All chemicals were obtained from Sigma/Aldrich or Fluka. CO, NO, and O2 gases were purchased from Matheson.
Sample Preparation
H93G Mb concentrations were determined by the pyridine hemochromogen method.30 Complete heme iron oxidation was achieved by addition of a few crystals of potassium ferricyanide followed by gel-filtration chromatography. As previously reported,27 Im was completely removed from the H93G proximal cavity by heme extraction/reconstitution by the method of Teale.31 Im or amine stock solutions were prepared in buffer using HCl to adjust the pH to 7.0. Reduction of heme complexes was achieved by adding a small amount of solid or a few μL of concentrated aqueous sodium dithionite (25 mg/mL) after degassing the protein under N2 in a septum sealed cuvette. The ferrous-CO, -NO and -O2 Mb adducts were generated by first reducing the amine- or Im-ligated adducts to the ferrous state followed by gentle bubbling with CO, NO or O2 gas, respectively, under N2.27, 32 The integrity of ferrous-O2 complexes was confirmed by addition of CO to form the CO adduct to probe for the presence of ferric heme iron contamination. The ferryl [Fe(IV)=O] derivative was generated from ferric H93G (ethylamine) Mb by adding 2.0 equivalent of H2O2 (relative to the H93G concentration).
Spectroscopic Techniques
MCD spectra were measured at a magnetic field strength of 1.41 T using a JASCO J815 spectropolarimeter equipped with a JASCO MCD-1B electromagnet and interfaced with a Silicon Solutions PC through a JASCO IF-815-2 interface unit. EA spectra were recorded with a Cary 400 spectrophotometer interfaced to a Dell PC. All spectral measurements were obtained in 100 mM potassium phosphate buffer (pH 7.0) at 4 °C using 0.5 or 0.2 cm cuvettes (H93G concentrations of about 25 or 50 μM, respectively). Data acquisition and manipulation with Cary or JASCO software has been previously described.27 EA spectra were recorded before and after MCD measurements to verify sample integrity. The spectra of the Im-ligated H93G Mb complexes are taken from previous published work.27, 28
Results and Discussion
Our previous studies have demonstrated that Im- and thiolate-ligated H93G Mb cavity mutants are excellent active site biomimics of wild type Mb and high-spin ferric P450-CAM, respectively.27, 33 In the present study, we have prepared and characterized ferrous, ferric and ferryl H93G Mb ligated by alkylamines as models for Lys- and terminal amine-ligated heme proteins such as cytochrome c nitrite reductase (ccNiR) or cytochrome f and to establish spectral signatures for such heme systems. All the complexes have been characterized by EA and MCD spectroscopy. Of particular interest, mixed ligand H93G Mb amine adducts having a different sixth ligand, such as Im or nitrite in the ferric state and CO, NO, O2 in the ferrous state, respectively, have been prepared. Alkylamines and imidazoles are both nitrogenous ligands that are primarily coordinated to the heme iron center as sigma donors. Not surprisingly, therefore, the alkylamine-ligated H93G Mb derivatives are spectroscopically similar in general to parallel Im-ligated H93G Mb species.
Ferric Mono- and Bis-Alkylamine H93G Adducts
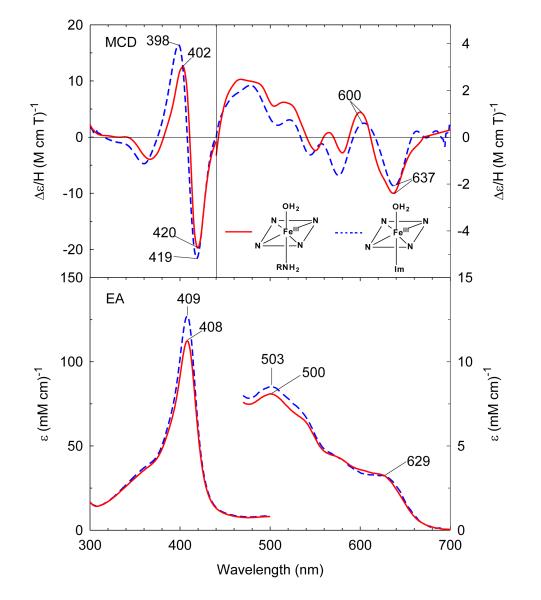
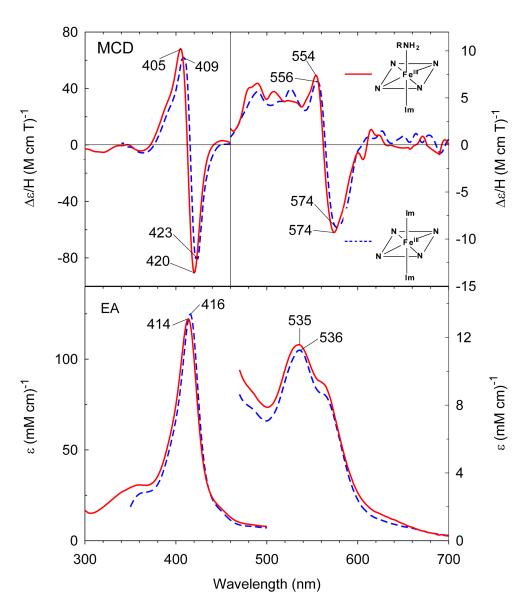
Ferric exogenous ligand-free H93G Mb exhibits an EA spectrum with a Soret absorption peak at 405–406 nm and charge transfer transition at ~600 nm.28 Addition of 0.3 M cyclohexylamine (CHA) at neutral pH produces significant changes throughout the EA spectrum as seen in Figure 2. The Soret absorption maximum red-shifts ~2 nm to 408 nm and the charge transfer band at ~600 nm red-shifts to 629 nm, consistent with formation of a six-coordinate high-spin complex. The resulting EA and MCD spectrum closely resemble those of the well-defined ferric H93G(Im/water) adduct (Figure 2).27 The close spectral similarity between the two complexes indicates that the ferric CHA-ligated H93G Mb is a six-coordinate high-spin H93G Mb derivative with the CHA amine group as the proximal donor ligand and water as the distal site ligand.34 The ferric H93G(CHA/water) Mb moiety at neutral pH is a heme iron coordination model for the ferric resting state of ccNiR,36 a heme derivative that cannot be simply prepared with synthetic heme iron model systems in organic solvents in the presence of amines.
Figure 2.
MCD (top) and electronic absorption (bottom) spectra of ferric H93G(cyclohexylamine) Mb (0.3 M cyclohexylamine) (solid line) compared to previously reported ferric H93G(Im) Mb (1 mM Im) (dashed line).27 The spectra were recorded in 0.1 M potassium phosphate at pH 7.0 at 4 °C.
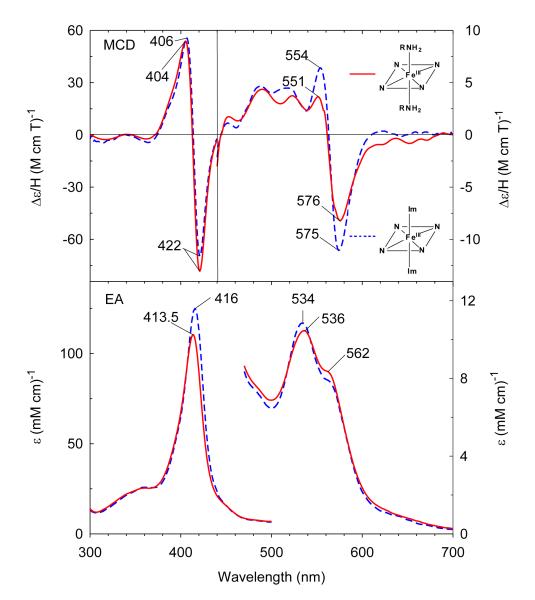
In the presence of higher concentrations of CHA (2 M), the Soret absorption peak further red-shifts to 413.5 nm due to formation of a low-spin six-coordinate ferric complex (Figure 3). The visible region (500-700 nm) has a maximum at 536 nm, a shoulder at 562 nm, and the band at 629 nm in the starting high-spin adduct is entirely gone. The EA and MCD spectra of the ferric bis-CHA H93G Mb species are very similar to those of ferric bis-Im H93G Mb (Figure 3). The ferric bis-CHA H93G Mb derivative at neutral pH is a heme iron coordination model for the proposed Fe(III)-NH3 product state in the nitrite reduction reaction cycle of ccNiR.37
Figure 3.
MCD (top) and electronic absorption (bottom) spectra of ferric H93G(bis-cyclohexylamine) Mb (2 M cyclohexylamine) (solid line) compared to previously reported ferric H93G(bis-Im) Mb (2 M Im) (dashed line).28 The spectra were recorded in 0.1 M potassium phosphate at pH 7.0 at 4 °C.
Models for Ferric ccNiR and Cytochrome f
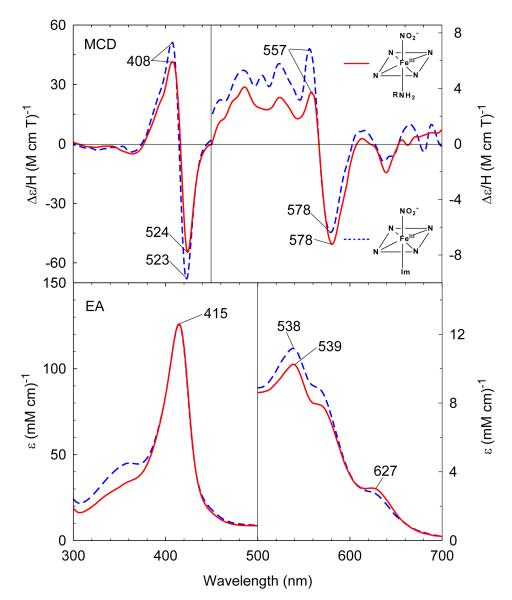
Stepwise titration of ferric H93G(CHA/water) Mb with sodium nitrite produces significant changes in the Soret and visible regions of the EA spectrum (Figure S1). The Soret maximum gradually red-shifts from 409 nm to 415 nm and there is a single set of isosbestic points during the entire titration. This indicates that addition of sodium nitrite to the ferric H93G-CHA leads to displacement of the distal water by NO2− to give a complex with neutral CHA and anionic nitrite bound to the heme iron center. Analysis of the titration data indicates that the Kd for nitrite binding is approximately 4 mM. Very little spectral change is seen above 100 mM nitrite (Figure S1), i.e. the mixed ligand adduct is nearly (~96%) homogenous. The MCD and EA spectra resemble those of the corresponding nitrite derivative of ferric 4-methylimidazole-bound H93G Mb (Figure 4). The Soret transitions in the EA spectra of each adduct have identical intensity and peak positions. The charge transfer bands at 538 nm and ~575 nm in the visible region indicate the low-spin six-coordinate structure of the heme iron active site has been formed. However, the spectral features around 627 nm, typical of high-spin ferric heme state, indicates that the ferric CHA/nitrite H93G Mb mixed ligand adduct likely has an admixed spin state as is the case with nitrite-bound ferric myoglobin.38 The ferric CHA/nitrite H93G Mb species is the first heme iron model for ferric ccNiR with substrate nitrite coordinated in the distal site trans to Lys.37 However, based on the work of Richter-Addo,39 the nitrite in ferric CHA/nitrite H93G Mb is likely O-bound whereas the nitrite in ferric ccNiR has been shown to bind via its nitrogen atom.4
Figure 4.
MCD (top) and electronic absorption (bottom) spectra of cyclohexylamine and nitrite (NO2)-bound ferric H93G Mb (0.5 M cyclohexylamine, 0.1 M NaNO2) (solid line) compared to 4-methylimidazole (4Me-Im) and nitrite (NO2)-bound ferric H93G Mb (0.1 mM 4Me-Im, 0.1 M NaNO2) (dashed line). The spectra were recorded in 0.1 M potassium phosphate at pH 7.0 at 4 °C.
Upon addition of CHA to ferric mono-Im-bound H93G Mb, the EA spectrum gradually changes with the Soret absorption maximum red-shifting from 409 to 412 nm and the transition at 630 nm, indicative of the high-spin state of the starting complex, significantly diminishing in intensity consistent with formation of a low-spin adduct (Figure S2). The titration data again show a single set of isosbestic points indicating that water in the distal site of ferric H93G(Im/water) Mb is displaced by the added CHA. However, the affinity for CHA is not as strong as for nitrite. Thus, we could not achieve complete saturation in the titration. Nonetheless the EA peak at 629 nm for the starting mono-Im complex is almost completely gone (Figure 5) indicating that the final spectrum is that of a nearly homogeneous Im/CHA mixed-ligand adduct. This is in contrast to the spectrum of ferric H93G(CHA/nitrite) Mb (Figure 4) which includes features above 600 nm in both the EA and MCD spectra. The EA and MCD spectra of ferric H93G(CHA/Im) Mb are presented in Figure 5 in comparison to that of ferric bis-Im H93G. The band shapes in both EA and MCD spectra are almost identical to each other, except for the overall 2 nm blue-shift of the spectrum of ferric H93G(CHA/Im) Mb. The ferric CHA/Im H93G complex is a heme iron coordination model for ferric cytochrome f (Lys/His).7
Figure 5.
MCD (top) and electronic absorption (bottom) spectra of cyclohexylamine and Im-bound ferric H93G Mb (0.2 mM Im, 1 M cyclohexylamine) (solid line) compared to and previously reported bis-Im-bound ferric H93G(Im) Mb (2 M Im) (dashed line).28 The spectra were recorded in 0.1 M potassium phosphate at pH 7.0 at 4 °C.
Ferrous Mono- and Bis-Alkylamine H93G Adducts
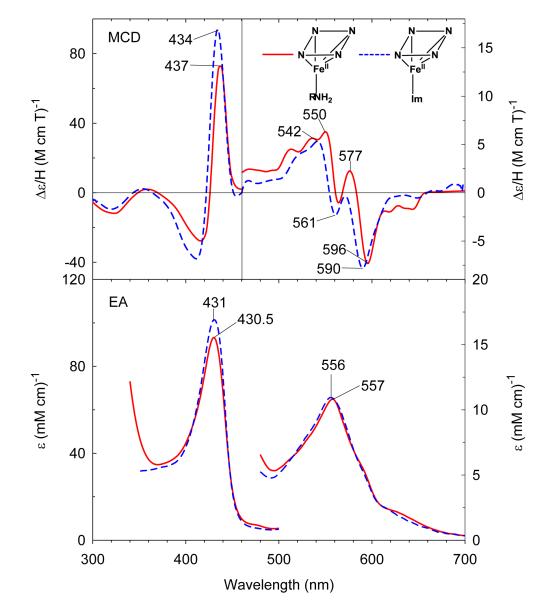
Anaerobic reduction of ferric H93G(CHA) Mb with dithionite results in the formation of five-coordinate high-spin deoxyferrous complex with EA and MCD spectral characteristics quite similar to those of deoxyferrous H93G(Im) Mb (Figure 6). The EA spectrum of the deoxyferrous H93G(CHA) Mb species has a Soret absorption transition at 430.5 nm and a single band in the visible region at 557 nm. These peak positions exactly match those seen for deoxyferrous H93G(Im) Mb (five-coordinated complex), but are somewhat less intense. Small amines like methylamine simply give bis-ligated adducts in the deoxyferrous state. Clearly the increased size of CHA diminishes its affinity for the deoxyferrous H93G heme iron, enabling a mono-ligated moiety to be isolated.
Figure 6.
MCD (top) and electronic absorption (bottom) spectra of the deoxyferrous H93G(cyclohexylamine) Mb (0.3 M cyclohexylamine) (solid line) compared to previously reported deoxyferrous H93G(Im) Mb (1 mM Im) (dashed line).27 The spectra were recorded in 0.1 M potassium phosphate at pH 7.0 at 4 °C.
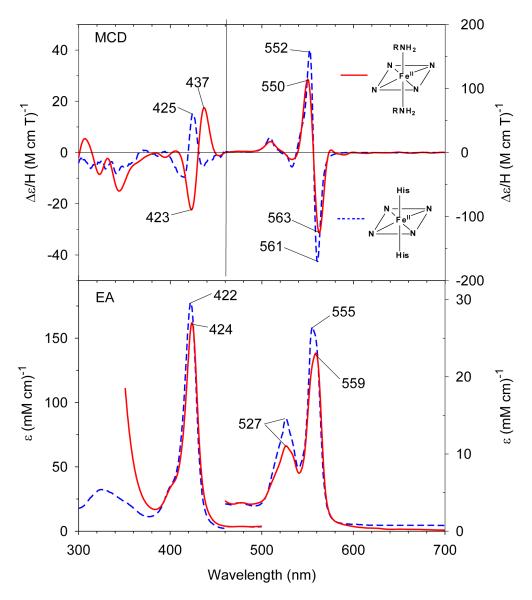
In the presence of the smaller methylamine (144 mM), ferrous H93G Mb forms a six-coordinate low-spin adduct with an EA spectrum that resembles that of the corresponding ferrous bis-His-ligated cytochrome b5 (Figure 7).40 The relatively weak Soret MCD features combined with the especially intense derivative-shaped MCD band centered at 556 nm for ferrous bis-methylamine H93G Mb are typical of a six-coordinate low-spin species.29 Although, His and methylamine are both nitrogenous neutral sigma donors, the derivative-shaped Soret MCD feature is particularly sensitive to the nature of the axial ligand with the band for the ferrous H93G(bis-methylamine) Mb adduct red-shifted by several nm relative to that of ferrous b5. A similar sensitivity to the nature of the donor was seen in the position of the derivative-shaped Soret MCD bands of bis-thiol and -thioether adducts of ferrous H93G Mb.41 Upon addition of a high concentration of CHA (2 M) to ferrous exogenous ligand-free H93G Mb, the overall EA and MCD spectral features match those of the ferrous bis-methylamine H93G Mb complex (data not shown). However, the broadness of the Soret MCD feature suggests that ferrous bis-CHA H93G may not be fully formed, presumably because the bulkier CHA ligand has lower affinity and is unable to bind twice even at 2 M concentration. Similar difficulties were observed fully forming a ferrous bis-thioether H93G Mb adduct.41
Figure 7.
MCD (top) and electronic absorption (bottom) spectra of the deoxyferrous H93G(bis-methylamine) Mb (144 mM methylamine) (solid line) compared to previously reported deoxyferrous cytochrome b5 (dashed line).40 The spectra were recorded in 0.1 M potassium phosphate at pH 7.0 at 4 °C.
Ferrous Alkylamine-Ligated H93G Adducts with CO, NO and O2
Under anaerobic conditions, bubbling CO gas into deoxyferrous CHA-bound H93G Mb (0.3 M CHA) yields a complex with similar EA spectral characteristics to that of ferrous-CO H93G(Im) Mb (Figure S3) as well as the parallel wild type Mb adduct (data not shown). The Soret maximum of ferrous-CO H93G(CHA) Mb is at 422 nm, with two visible region bands at 539 nm and 569 nm. This indicates that a six-coordinate low-spin moiety forms with the alkylamine nitrogen donor coordinated in the proximal pocket trans to the distal CO. The MCD spectrum shows two derivative-shaped transitions centered at 421 nm and 569 nm, respectively. The overall spectrum is slightly more intense than that of ferrous-CO H93G(Im) Mb.
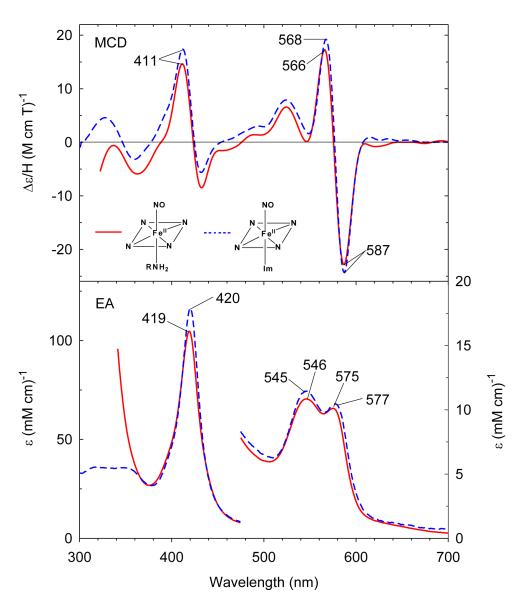
We have previously reported that the ferrous H93G(Im) Mb is able to form a six-coordinate ferrous-NO complex.27 In the presence of 18 mM Im, ferrous H93G Mb binds NO to form a six-coordinate ferrous-NO adduct with a Soret absorption transition at 420 nm and visible bands at 545 nm and 577 nm (Figure 8). Ferrous CHA-bound H93G Mb (0.3 M) also binds NO to form a derivative with EA and MCD spectra that are very similar although slightly less intense than those of the corresponding six-coordinate ferrous-NO H93G(Im) Mb moiety with a Soret absorption maximum at 419 nm and visible peaks at 546 nm and 575 nm. The MCD spectrum of the ferrous-NO species has an asymmetric derivative-shaped feature centered at 423 nm and a symmetrical visible derivative-shaped band centered at 576 nm that is completely different from that of the five-coordinate ferrous-NO state.27 Ferrous-NO H93G(CHA) Mb is the first model for the proposed ferrous-NO intermediate in the reduction path from nitrite to ammonia catalyzed by ccNiR.37
Figure 8.
MCD (top) and electronic absorption (bottom) spectra of six-coordinate ferrous-NO complexes of cyclohexylamine-bound H93G Mb (solid line) and previously reported ferrous-NO H93G(Im) Mb (dashed line).27 The spectra were recorded in 0.1 M potassium phosphate at pH 7.0 at 4 °C.
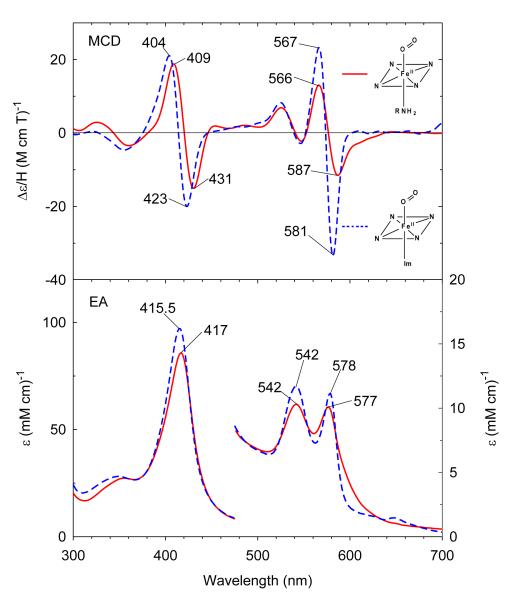
Addition of pre-cooled dioxygen gas to a solution of deoxyferrous H93G(CHA) Mb (0.3 M CHA) leads to formation of the oxyferrous complex. Like the corresponding oxyferrous H93G(Im) derivative, this adduct is stable enough so that during the course of MCD measurements at 4 °C (about 40 min), the complex is unchanged. The EA and MCD spectra of oxyferrous H93G(CHA) and H93G(Im) Mb are shown in Figure 9. The EA spectrum of oxyferrous H93G(CHA) has a Soret maximum at 417 nm, a near-UV (delta) band at ~355 nm, and two peaks in the visible region at 542 nm and 577 nm. The MCD spectrum has a derivative-shaped Soret transition centered at 420 nm and a derivative-shaped band centered at 576 nm. The EA and MCD spectral features of oxyferrous H93G(CHA) Mb are less intense than the corresponding features for oxyferrous H93G(Im) Mb.
Figure 9.
MCD (top) and electronic absorption (bottom) spectra of six-coordinate oxyferrous complexes of cyclohexylamine-bound H93G Mb (solid line) and previously reported oxyferrous H93G(Im) Mb (dashed line).27 The spectra were recorded in 0.1 M potassium phosphate at pH 7.0 at 4 °C.
To determine whether the oxyferrous H93G(CHA) Mb protein remained fully reduced during the data acquisition, the oxyferrous samples were converted to the ferrous-CO form by bubbling with CO at ~4 °C. An O2 to CO ligand exchange reaction in ferrous state can be easily used for this purpose because of rapid exchange was observed at ~4 °C. The resulting ferrous-CO H93G(CHA) Mb sample has EA spectra that exactly match those displayed in Figure S3, indicating that little if any autoxidation or denaturation occurred during formation of the oxyferrous derivative. This is the first successful example of an alkylamine-ligated oxyferrous heme iron complex.
The Ferryl Alkylamine H93G Adduct
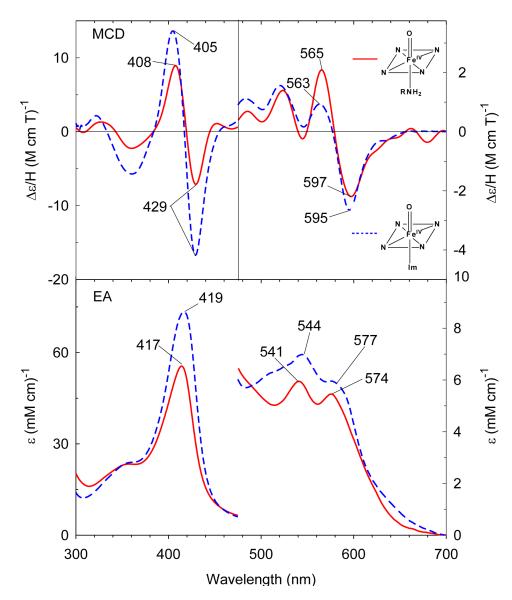
Addition of H2O2 (2 equiv) to ferric H93G(ethylamine) Mb leads to a new species with EA transitions at 417 nm (Soret) and at 541 nm and 574 nm and with an MCD spectrum featuring a derivative-shaped bands centered at 418 nm and at 574 nm (Figure 10). The EA and MCD spectra are generally similar to those of ferryl H93G(Im) Mb indicating that the new complex formed from ferric H93G(ethylamine) Mb is also a ferryl derivative. However, detailed comparison of the MCD spectra of the two ferryl moieties reveals small differences in relative intensities with the spectrum in the ferryl-ethylamine case being less intense in the Soret region (300-500 nm) but more intense in the visible region relative to the spectrum of the ferryl-Im adduct. These spectral dissimilarities are likely due to the subtle differences in the nature of the proximal axial ligands, amine and Im, in the two ferryl complexes. This is the first report of a ferryl alkylamine complex.
Figure 10.
MCD (top) and electronic absorption (bottom) spectra of ferryl complexes of ethylamine-bound H93G Mb (solid line) and previously reported ferryl H93G(Im) Mb (dashed line).27 The spectra were recorded in 0.1 M potassium phosphate at pH 7.0 at 4 °C.
Conclusions
Establishing the structure of the heme iron unit by the identification of axial ligands is essential to a complete understanding of the mechanism of action of heme proteins and enzymes. The H93GMb cavity mutant system works especially well to generate accurate ambient-temperature model complexes for heme proteins. A particularly useful aspect of this system is the ability to generate mixed-ligand adducts27 that are generally very difficult to achieve with synthetic models in organic solvents.
In this study, H93G myoglobin complexes with exogenous alkylamine ligands have been successfully prepared as models for native heme iron protein active sites ligated by proximal Lys or the amine group of N-terminal amino acids. By utilizing the H93G myoglobin cavity mutant, we are also able to prepare and characterize axial alkylamine ligand adducts in ferrous, ferric, as well as ferryl oxidation states. These results contrast with the rather limited success that has been achieved to date in the preparation of purely synthetic alkylamine-ligated heme model complexes in organic solvents.3, 10-13 All of the newly prepared H93G Mb adducts have been characterized with MCD and EA absorption spectroscopy (the spectra of all the amine complexes are displayed in the supporting material). The ferric high-spin alkylamine/water-bound H93G Mb is the heme coordination model for the resting state of ccNiR. The alkylamine/nitrite-ligated heme coordination structure mimics the catalytic cycle intermediate for substrate (nitrite) bound to the heme iron center of ccNiR. Ferric six-coordinate low-spin alkylamine/Im-bound H93G Mb is a model for cytochrome f in which terminal-amino group of Tyr-1 coordinates trans to His-25 in the active site. The resulting data have substantially expanded the spectral database which is utilized by our laboratory to establish the coordination structure of heme centers in newly discovered heme proteins of unknown structure at the metal unit.42-45 The generation of a new set of heme iron ligand adducts with alkylamine ligation further demonstrates the efficacy of the H93G Mb “cavity mutant” as a versatile template for the preparation of heme model complexes to probe the coordination structure of heme iron centers in native proteins.
Supplementary Material
Acknowledgments
We thank Professor Steven G. Boxer for the H93G expression system and Dr. Masanori Sono for helpful discussions. Support from the NIH (GM 26730) and Research Corp. (to J.H.D.).
Footnotes
Supporting Information Available: Additional MCD and electronic absorption spectra for the derivatives of H93G myoglobin examined in this study. This material is available free of charge via the Internet at http://pubs.acs.org.
References
- 1.Dawson JH. Science. 1988;240:433–439. doi: 10.1126/science.3358128. [DOI] [PubMed] [Google Scholar]
- 2.Paoli M, Marles-Wright J, Smith A. DNA Cell Biol. 2002;21:271–280. doi: 10.1089/104454902753759690. [DOI] [PubMed] [Google Scholar]
- 3.Dawson JH, Sono M. Chem. Rev. 1987;87:1255–1276. [Google Scholar]
- 4.Einsle O, Messerschmidt A, Stach P, Bourenkov GP, Bartunik HD, Huber R, Kroneck PMH. Nature. 1999;400:476–480. doi: 10.1038/22802. [DOI] [PubMed] [Google Scholar]
- 5.Einsle O, Stach P, Messerschmidt A, Simon J, Kroger A, Huber R, Kroneck PMH. J. Biol. Chem. 2000;275:39608–39616. doi: 10.1074/jbc.M006188200. [DOI] [PubMed] [Google Scholar]
- 6.Aono S, Nakajima H, Saito K, Okada M. Biochem. Biophys. Res. Commun. 1996;228:752–756. doi: 10.1006/bbrc.1996.1727. [DOI] [PubMed] [Google Scholar]
- 7.Lanzilotta WN, Schuller DJ, Thorsteinsson MV, Kerby RL, Roberts GP, Poulos TL. Nature Struct. Biol. 2000;7:876–880. doi: 10.1038/82820. [DOI] [PubMed] [Google Scholar]
- 8.Chi Y-I, Huang L-S, Zhang Z, Fernández-Velasco JG, Berry EA. Biochemistry. 2000;39:7689–7701. doi: 10.1021/bi000090k. [DOI] [PubMed] [Google Scholar]
- 9.Sujak A, Drepper F, Haehnel W. J. Photochem. Photobiol. B: Biology. 2004;74:135–143. doi: 10.1016/j.jphotobiol.2004.03.007. [DOI] [PubMed] [Google Scholar]
- 10.Del Gaudio J, LaMar GN. J. Am. Chem. Soc. 1978;100:1112–1119. [Google Scholar]
- 11.Epstein LM, Straub DK, Maricondi C. Inorg. Chem. 1967;6:1720–1724. [Google Scholar]
- 12.Radonovich LJ, Bloom A, Hoard JL. J. Am. Chem. Soc. 1972;94:2073–2078. doi: 10.1021/ja00761a046. [DOI] [PubMed] [Google Scholar]
- 13.Marques HM, Munro OQ, Crawcour ML. Inorg. Chim. Acta. 1992;196:221–229. [Google Scholar]
- 14.Safo MK, Nesset MJM, Walker FA, Debrunner PG, Scheidt WR. J. Am. Chem. Soc. 1997;119:9438–9448. [Google Scholar]
- 15.Grodzicki M, Flint H, Winkler H, Walker FA, Trautwein AX. J. Phys. Chem. A. 1997;101:4202–4207. [Google Scholar]
- 16.Polam JR, Wright JL, Christensen KA, Walker FA, Flint H, Winkler H, Grodzicki M, Trautwein AX. J. Am. Chem. Soc. 1996;118:5272–5276. [Google Scholar]
- 17.Dolphin DA, Sams JR, Tsin TB, Wong KL. J. Am. Chem. Soc. 1976;98:6970–6975. doi: 10.1021/ja00438a037. [DOI] [PubMed] [Google Scholar]
- 18.Del Gaudio J, La Mar GN. J. Am. Chem. Soc. 1976;98:3014–3015. doi: 10.1021/ja00426a056. [DOI] [PubMed] [Google Scholar]
- 19.Dixon DW, Kirmaier C, Holten D. J. Am. Chem. Soc. 1985;107:808–813. [Google Scholar]
- 20.Mathews FS, Levine M, Agros P. Nat. New Biol. 1971;233:15–16. doi: 10.1038/newbio233015a0. [DOI] [PubMed] [Google Scholar]
- 21.Dunford HB, Stillman JS. Coord. Chem. Rev. 1976;19:187–251. [Google Scholar]
- 22.Hodgkinson J, Jordan RB. J. Am. Chem. Soc. 1973;95:763–768. [Google Scholar]
- 23.Harbury HA, Loach PA. J. Biol. Chem. 1960;235:3646–3653. [PubMed] [Google Scholar]
- 24.Byfield MP, Hamza MSA, Pratt JM. J. Chem. Soc. Dalton Trans. 1993:1641–1645. [Google Scholar]
- 25.Marques HM. J. Chem. Soc. Dalton Trans. 2007:4371–4385. doi: 10.1039/b710940g. [DOI] [PubMed] [Google Scholar]
- 26.Barrick D. Biochemistry. 1994;33:6546–6554. doi: 10.1021/bi00187a023. [DOI] [PubMed] [Google Scholar]
- 27.Pond AE, Roach MP, Thomas MR, Boxer SG, Dawson JH. Inorg. Chem. 2000;39:6061–6066. doi: 10.1021/ic0007198. [DOI] [PubMed] [Google Scholar]
- 28.Du J, Sono M, Dawson JH. Spectroscopy. 2008;22:123–141. [Google Scholar]
- 29.Cheek J, Dawson JH. In: The Porphyrin Handbook. Kadish K, Smith K, Guilard R, editors. Academic Press; New York: 2000. pp. 339–369. [Google Scholar]
- 30.Paul K-G, Theorell H, Åkeson Å. Acta Chem. Scand. 1953;7:1284–1287. [Google Scholar]
- 31.Teale FW. Biochim. Biophys. Acta. 1959;35:543–543. doi: 10.1016/0006-3002(59)90407-x. [DOI] [PubMed] [Google Scholar]
- 32.Yonetani T, Yamamoto H, Erman JE, Leigh JS, Jr., Reed GS. J. Biol. Chem. 1972;247:2447–2455. [PubMed] [Google Scholar]
- 33.Roach MP, Pond AE, Thomas MR, Boxer SG, Dawson JH. J. Am. Chem. Soc. 1999;121:12088–12093. [Google Scholar]
- 34.The assumption that the added amine ligand binds in the proximal pocket is based on the crystal structures of ferric H93G Mb with Im26, thiolate35 or acetate35 bound adducts. In addition, the distal pocket is more polar than the proximal cavity and thus is the more likely location for water to bind as seen in the Im and acetate complexes.26, 35
- 35.Qin J, Perera R, Lovelace LL, Dawson JH, Lebioda L. Biochemistry. 2006;45:3170–7. doi: 10.1021/bi052171s. [DOI] [PMC free article] [PubMed] [Google Scholar]
- 36.Bamford VA, Angove HC, Seward HE, Thomson AJ, Cole JA, Butt JN, Hemmings AM, Richardson DJ. Biochemistry. 2002;41:2921–2931. doi: 10.1021/bi015765d. [DOI] [PubMed] [Google Scholar]
- 37.Einsle O, Messerschimdt A, Huber R, Kroneck PMH, Neese F. J . Am. Chem. Soc. 2002;124:11737–11745. doi: 10.1021/ja0206487. [DOI] [PubMed] [Google Scholar]
- 38.Sono M, Dawson JH. J. Biol. Chem. 1982;257:5496–5502. [PubMed] [Google Scholar]
- 39.Copeland DM, Soares AS, West AH, Richter-Addo GB. J. Inorg. Biochem. 2006;100:1413–1425. doi: 10.1016/j.jinorgbio.2006.04.011. [DOI] [PubMed] [Google Scholar]
- 40.Cheek J, Mandelman D, Poulos TL, Dawson JH. J. Biol. Inorg. Chem. 1999;4:64–72. doi: 10.1007/s007750050290. [DOI] [PubMed] [Google Scholar]
- 41.Perera R, Sono M, Sigman JA, Pfister TD, Lu Y, Dawson JH. Proc. Natl. Acad. Sci. 2003;100:3641–3646. doi: 10.1073/pnas.0737142100. [DOI] [PMC free article] [PubMed] [Google Scholar]
- 42.Airola MV, Du J, Dawson JH, Crane BR. Biochemistry. 2010;49:4327–4338. doi: 10.1021/bi901945w. [DOI] [PMC free article] [PubMed] [Google Scholar]
- 43.Kinloch RD, Sono M, Sudhamsu J, Crane BR, Dawson JH. J. Inorg. Biochem. 2010;104:357–364. doi: 10.1016/j.jinorgbio.2009.12.014. [DOI] [PubMed] [Google Scholar]
- 44.Osborne RL, Sumithran S, Coggins MK, Chen YP, Lincoln DE, Dawson JH. J Inorg Biochem. 2006;100:1100–1108. doi: 10.1016/j.jinorgbio.2006.02.008. [DOI] [PubMed] [Google Scholar]
- 45.Eakanunkul S, Lukat-Rodgers GS, Sumithran S, Ghosh A, Rodgers KR, Dawson JH, Wilks A. Biochemistry. 2005;44:13179–13191. doi: 10.1021/bi050422r. [DOI] [PubMed] [Google Scholar]
Associated Data
This section collects any data citations, data availability statements, or supplementary materials included in this article.


