

Abstract
A loss of stromal caveolin-1 (Cav-1) in the tumor fibroblast compartment is associated with early tumor recurrence, lymphnode metastasis and tamoxifen-resistance, resulting in poor clinical outcome in breast cancer patients. Here, we have used Cav-1 (−/−) null mice as a pre-clinical model for this “lethal tumor micro-environment”. Metabolic profiling of Cav-1 (−/−) mammary fat pads revealed the upregulation of numerous metabolites (nearly 100), indicative of a major catabolic phenotype. Our results are consistent with the induction of oxidative stress, mitochondrial dysfunction and autophagy/mitophagy. The two most prominent metabolites that emerged from this analysis were ADMA (asymmetric dimethyl arginine) and BHB (beta-hydroxybutyrate; a ketone body), which are markers of oxidative stress and mitochondrial dysfunction, respectively. Transcriptional profiling of Cav-1 (−/−) stromal cells and human tumor stroma from breast cancer patients directly supported an association with oxidative stress, mitochondrial dysfunction and autophagy/mitophagy, as well as ADMA and ketone production. MicroRNA profiling of Cav-1 (−/−) stromal cells revealed the upregulation of two key cancer-related miR's, namely miR-31 and miR-34c. Consistent with our metabolic findings, these miR's are associated with oxidative stress (miR-34c) or activation of the hypoxic response/HIF1α (miR-31), which is sufficient to drive authophagy/mitophagy. Thus, via an unbiased comprehensive analysis of a lethal tumor micro-environment, we have identified a number of candidate biomarkers (ADMA, ketones and miR-31/34c) that could be used to identify high-risk cancer patients at diagnosis, for treatment stratification and/or for evaluating therapeutic efficacy during anti-cancer therapy. We propose that the levels of these key biomarkers (ADMA, ketones/BHB, miR-31 and miR-34c) could be (1) assayed using serum or plasma from cancer patients or (2) performed directly on excised tumor tissue. Importantly, induction of oxidative stress and autophagy/mitophagy in the tumor stromal compartment provides a means by which epithelial cancer cells can directly “feed off” of stromal-derived essential nutrients, chemical building blocks (amino acids, nucleotides) and energy-rich metabolites (glutamine, pyruvate, ketones/BHB), driving tumor progression and metastasis. Essentially, aggressive cancer cells are “eating” the cancer-associated fibroblasts via autophagy/mitophagy in the tumor micro-environment. Lastly, we discuss that this “autophagic tumor stroma model of cancer metabolism” provides a viable solution to the “autophagy paradox” in cancer etiology and chemotherapy.
Key words: caveolin-1, autophagy, mitophagy, the Warburg effect, tumor stroma, metabolomics, ADMA (asymmetric dimethyl arginine), 3-hydroxybutyrate (ketone bodies), miR-31, miR-34c
Introduction
It is now well-recognized that the tumor micro-environment plays a primary role in determining tumor progression and metastasis in many different types of epithelial cancers.1–4 In this regard, “activated or myofibroblastic” cancer-associated fibroblasts5,6 have emerged as one of the most prominent cell types in the tumor stroma that may determine clinical outcome in breast and prostate cancers.
We have recently identified a loss of stromal Cav-1 in the tumor associated fibroblast compartment as a critical event in the progression of human breast cancers.7–9 More specifically, a loss of stromal Cav-1 is associated with early tumor recurrence, lymphnode metastasis and tamoxifen-resistance, resulting in poor clinical outcome.9 Similar results were obtained with DCIS10 and prostate cancer patients,11 indicating that a loss of stromal Cav-1 in cancer-associated fibroblasts is tightly associated with tumor progression and metastasis. These findings have now been replicated in several independent patient cohorts,12,13 and also extended to other more lethal forms of breast cancer, such as the triple-negative and basal-like breast cancer sub-types.14 For example, in triple-negative breast cancers, patients with high stromal Cav-1 have a 75.5% survival rate at 12 years, while patients with an absence of stromal Cav-1 have a survival rate of less than 10% at 5 years post-diagnosis.14 Thus, it is now imperative that we dissect the molecular basis of this phenomenon, to design better therapeutics targeting this high-risk patient population.
To mechanistically understand the lethality of a Cav-1-deficient stromal micro-environment, we next chose to use Cav-1 (−/−) null mice as a model system.15 Using this approach, we isolated bone-marrow stromal cells (thought to be the precursors of cancer-associated fibroblasts6) and subjected them to unbiased proteomics and genome-wide transcriptional profiling.15 As a result, via our proteomics analysis, we observed that Cav-1 (−/−) null stromal cells show the upregulation of eight myo-fibroblast markers (including vimentin, calponin and collagen I), eight glycolytic enzymes [such as pyruvate kinase (PKM2) and lactate dehydrogenase (LDHA)] and two markers of oxidative stress (namely catalase and peroxiredoxin 1).15 These results were also independently supported by our data from transcriptional profiling. An informatics analysis of these findings suggested that a loss of stromal Cav-1 results in oxidative stress, driving aerobic glycolysis (a.k.a., the Warburg effect) in cancer-associated fibroblasts.16,17 This would then provide a feed-forward mechanism by which Cav-1-deficient cancer-associated fibroblasts could literally “feed” adjacent cancer cells by providing lactate and pyruvate in a paracrine fashion.15 We have termed this novel idea the “reverse Warburg effect,” as the “classical” Warburg effect was originally thought to occur only in epithelial cancer cells and not in cancer-associated fibroblasts.15
Here, to better understand the nature and extent of these proposed metabolic changes, we have now performed an unbiased metabolomics analysis on the mammary fad pads derived from Cav-1 (−/−) null mice. With this approach, we expected to simply validate the existence of the “reverse Warburg effect”. However, what we observed was far more complex and extensive, and was characteristic of a profound catabolic phenotype. Our results are consistent with oxidative stress, mitochondrial dysfunction and autophagy/mitophagy—which would also induce aerobic glycolysis in the tumor stroma (the “reverse Warburg effect”).
Interestingly, autophagy, mitophagy and aerobic glycolysis are all induced by oxidative stress and are all controlled by the same key transcription factor, namely hypoxia-inducible factor-1alpha (HIF-1α). In this regard, we directly show that a loss of stromal Cav-1 leads to the upreglulation of miR-31, which is a known activator of HIF1α transcriptional activity.18 Thus, the lethality of a Cav-1-deficient tumor micro-environment could be explained by an autophagic/catabolic tumor stroma, which would then provide both nutrients and energy to epithelial cancer cells in a paracrine fashion. We propose to call this idea the “autophagic tumor stroma model of cancer.” This represents a unique therapeutic opportunity, as blocking autophagy in the tumor stroma should halt cancer growth, while an induction of autophagy in the epithelial cancer cells should have the same effect, thereby halting tumor growth. This new model of compartmentalized autophagy could clarify and explain the controversial role of autophagy in tumor pathogenesis and facilitate the design of novel anti-cancer therapies.
Results
Metabolomic analysis of cav-1 (−/−) null tissues: evidence for oxidative stress, mitochondrial dysfunction and autophagy.
Mammary fat pads were harvested from age-matched female WT and Cav-1 (−/−) null mice (n = 6 for each genotype) and subjected to an unbiased metabolomic analysis. Over 200 known compounds were identified by mass spectrometry analysis and their levels were quantitated. Interestingly, a large number of compounds were significantly changed in Cav-1 (−/−) mammary fat pads (n = 103; 92 UP; 11 DOWN), consistent with a severe metabolic phenotype (Table 1).
Table 1.
Metabolomic analysis of mammary fat pads from Cav-1 (−/−) deficient mice
| Amino Acids: |
| Alanine and aspartate metabolism: alanine (1.7); asparagine (2.3); aspartate (2.7) |
| Cysteine, methionine, SAM, taurine metabolism: cysteine (1.6); hypotaurine (1.8); methionine (2.2); N-acetylmethionine (2.7); S-adenosylhomocysteine (SAH) (0.7) |
| Glutamate metabolism: glutamate (1.9); glutamine (1.6); N-acetyl-aspartyl-glutamate (NAAG) (1.6) |
| Glutathione metabolism: 5-oxoproline (1.5); cysteine-glutathione disulfide (1.4); glutathione, oxidized (GSSG) (1.5); glutathione, reduced (GSH) (1.7) |
| Glycine, serine and threonine metabolism: glycine (2.3); serine (2.5); threonine (2.0) |
| Histidine metabolism:histamine (2.5); histidine (2.4); urocanate (3.0) |
| Lysine metabolism: lysine (1.7); pipecolate (1.9) |
| Phenylalanine & tyrosine metabolism: phenylalanine (2.3); tyrosine (2.5) |
| Tryptophan metabolism:5-hydroxyindoleacetate (2.7); C-glycosyl-tryptophan (1.7); tryptophan (2.3) |
| Urea cycle; arginine-, proline-, metabolism: arginine (1.9); assymetric dimethylarginine (ADMA) (3.3); proline (2.3); trans-4-hydroxyproline (2.0); urea (2.5) |
| Valine, leucine and isoleucine metabolism:isoleucine (2.5); leucine (2.3); valine (2.0) |
| Peptides: |
| Dipeptide:glycylproline (2.8); proline-hydroxy-proline (1.8) |
| Gamma-glutamyl: gamma-glutamylglutamate (1.7); gamma-glutamylisoleucine (2.0); gamma-glutamylleucine (1.9); gamma-glutamylphenylalanine (1.8); gamma-glutamyltryptophan (2.1); gamma-glutamyltyrosine (1.9); gamma-glutamylvaline (1.7) |
| Carbohydrates: |
| Aminosugars metabolism: N-acetylglucosamine 6-phosphate (1.6) |
| Fructose, mannose, galactose, starch and sucrose metabolism: erythrose (2.0); fructose (2.0); mannose-6-phosphate (1.8) |
| Glycolysis, gluconeogenesis, pyruvate metabolism: fructose-6-phosphate (1.9); glucose (1.5); glucose-6-phosphate (G6p) (1.9); pyruvate (1.4)* |
| Nucleotide sugars, pentose metabolism: ribose (1.9); sedoheptulose-7-phosphate (1.7) |
| Sugar alcohol: myo-inositol (1.4) |
| Cofactors and vitamins: |
| Ascorbate and aldarate metabolism:ascorbate (Vitamin C) (11.2); threonate (1.4) |
| Nicotinate and nicotinamide metabolism: nicotinamide (1.3) |
| Pantothenate and CoA metabolism: pantothenate (1.4) |
| Riboflavin metabolism:riboflavin (Vitamin B2) (2.6) |
| Tocopherol metabolism:alpha-tocopherol (2.7) |
| Vitamin B6 metabolism: pyridoxate (1.8) |
| Energy: |
| Krebs cycle: fumarate (1.6); malate (1.4) |
| Oxidative phosphorylation: methylphosphate (1.6); phosphate (1.3) |
| Lipids: |
| Carnitine metabolism: 3-dehydrocarnitine (1.3); carnitine (0.9); malonylcarnitine (0.6) |
| Essential fatty acid: dihomo-linolenate (20:3n3 or n6) (1.5) |
| Fatty acid, ester: n-Butyl oleate (1.5) |
| Glycerolipid metabolism: choline (1.3); ethanolamine (2.1) glycerol (1.2); phosphoethanolamine (2.4) |
| Inositol metabolism: inositol 1-phosphate (I1p) (2.4) |
| Ketone bodies:3-hydroxybutyrate (BHBA) (4.3) |
| Long chain fatty acids: arachidonate (20:4n6) (1.5); margarate (17:0) (1.4); myristoleate (14:1n5) (1.8) |
| Monoacylglycerol: 1-stearoylglycerol (1-monostearin) (1.4) |
| Sterol/Steroid: cholesterol (1.6) |
| Nucleotides: |
| Purine metabolism, (hypo)xanthine/inosine containing: hypoxanthine (1.6); inosine (0.7); xanthine (1.7); xanthosine (1.3) |
| Purine metabolism, adenine containing: adenosine 2′-monophosphate (2′-AMp) (2.4); N1-methyladenosine (2.0) |
| Purine metabolism, guanine containing: guanosine (0.4) |
| Purine metabolism, urate metabolism: urate (0.7) |
| Pyrimidine metabolism, cytidine containing: 2′-deoxycytidine (2.2); cytidine (2.5); cytidine 5′-monophosphate (5′-CMp) (0.8); cytidine-3′-monophosphate (3′-CMp) (1.9) |
| Pyrimidine metabolism, uracil containing: pseudouridine (1.7); uracil (3.8) |
| Xenobiotics: |
| Benzoate metabolism: 4-ethylphenylsulfate (2.1); catechol sulfate (2.5); hippurate (1.8) |
Fold-changes (KO/Wt) are shown in parentheses for all metabolites that showed a significant change (p ≤ 0.05). In one case, an asterisk (*) indicates p ≤ 0.1. Metabolites showing an increase of 2.5 or greater are underlined. All other p values were p≤0.05.
Several observations are consistent with the presence of oxidative stress. These include: (1) an increase in the amounts of several anti-oxidants, such as ascorbic acid (∼11.2-fold), vitamin E (alpha-tocopherol; 2.7-fold), 5-hydroxyindoleacetate (2.7-fold) and hypotaurine (1.8-fold); (2) an increase in the number of amino-acid metabolites associated with the glutathione pathway, more specifically γ-glutamyl amino acids and glutathione species (GSH, GSSH, 5-oxoproline, cys-glutathione-disulfide); (3) a shift towards gluconeogenesis, and the pentose phosphate pathway, which is known to produce increased amounts of NADPH, which can then be used as reducing equivalents to maintain reduced glutathione; (4) the observed increase in ribose and nucleotides, which emanate from the pentose phosphate pathway; and (5) an increase in the amount of ADMA (asymmetric dimethyl arginine; 3.3-fold), which is both a marker of protein catabolism and oxidative stress, and can also produce more oxidative stress. ADMA acts as an eNOS uncoupler, resulting in the production of superoxide, instead of nitric oxide.19 Similarly, ADMA is also a marker of chronic hypoxia20 and mitochondrial dysfunction.21
As oxidative stress also drives mitochondrial dysfunction, autophagy and mitophagy, we also looked for evidence of these catabolic biological processes in our metabolic data set. Consistent with a generalized catabolic phenotype, we see: (1) higher levels of numerous amino acids and their catabolites; (2) elevation of 4 markers of protein or collagen degradation (assymetric dimethylarginine, trans-4-hydroxyproline, glycylproline, proline-hydroxy-proline); (3) elevated levels of a marker of increased RNA turnover, namely pseudouridine (1.7-fold); (4) increased levels (4.3-fold) of 3-hydroxy butyrate (BHB), a ketone body, which is a well-accepted marker of mitochondrial dysfunction;22,23 and (5) higher levels of free cholesterol (1.6-fold), which can also contribute to mitochondrial dysfunction.24 A decrease in mitochondrial function is also consistent with the accumulation of certain metabolites associated with glycolysis (pyruvate; 1.4-fold), and the TCA cycle (fumarate and malate; both >1.4-fold). Interestingly, we also see increases in 5-hydroxyindole (2.7-fold), which is an anti-oxidant metabolite of tryptophan, which protects against oxidative damage and mitochondrial dysfunction, as it suppresses ROS generation, lipid peroxidation, peroxynitrite generation and glutathione depletion—thereby increasing mitochondrial membrane potential.25
Finally, the increased amount of ascorbic acid (Vitamin C; 11.2-fold) may also reflect that glucose is not being efficiently metabolized via glycolysis and the TCA cycle in Cav-1 (−/−) mammary fat pads. Thus, glucose instead may be shunted towards the synthesis of ascorbic acid (an antioxidant), which is generated directly from glucose by a sequence of enzyme-driven steps and employs the essential enzyme L-gulonolactone oxidase (GULO).
We also independently compared our results from the mammary fat pad with lung tissue, as adipose tissue and lung tissue express the highest levels of Cav-1. Only concordant changes were selected and are shown in Table 2. Interestingly, ADMA, pyruvate and 3-hydroxybutyrate were significantly elevated in lung tissue, consistent with the idea that Cav-1 (−/−) null tissues are undergoing (1) oxidative stress and (2) mitochondrial dysfunction. Box plots for ADMA and BHB are shown in Figure 1, and for the antioxidant Vitamins C and E in Figure 2.
Table 2.
Metabolomic analysis of mammary fat pads and lung tissue from Cav-1 (−/−) deficient mice
| Metabolites | Mammary (KO/WT) | Lung (KO/WT) |
| pipecolate | 1.9 | 1.3 |
| assymetric dimethylarginine (ADMA) | 3.3 | 1.4 |
| glycylproline | 2.8 | 1.4 |
| pyruvate | 1.4* | 1.9 |
| carnitine | 0.9 | 0.9 |
| dihomo-linolenate (20:3n3 or n6) | 1.5 | 1.3 |
| 3-hydroxybutyrate (BHBA) | 4.3 | 3.5 |
| inosine | 0.7 | 0.7 |
| cytidine-3′-monophosphate (3′-CMP) | 1.9 | 1.3 |
| 4-ethylphenylsulfate | 2.1 | 2.2 |
Only metabolites and fold-changes (KO/WT)showing concordant changes in both the mammary fat pad and lung tissue are shown. An asterisk (*) indicates p ≤ 0.1. All other p values were p ≤ 0.05.
Figure 1.

Evidence for oxidative stress and mitochondrial dysfunction in Cav-1 (−/−) null mouse tissues: ADMA and Ketones. Note that both 3-hydroxybutyrate (BHBA) and asymmetric dimethyl arginine (ADMA) are increased ∼3–4 fold in Cav-1 (−/−) mammary fat pads. Similar results were obtained with lung tissue harvested from Cav-1 (−/−) mice. Importantly, ADMA is a marker of endothelial dysfunction and oxidative stress; it can also drive oxidative stress, as it functions as an uncoupler of NoS family member, inhibiting the production No and producing superoxide instead. In addition, BHBA is a ketone body known to be a marker of mitochondrial dysfunction. oxidative stress induces mitochrondrial dysfunction and visa versa, driving autophagy and mitophagy.
Figure 2.

Upregulation of antioxidants in Cav-1 (−/−) mammary fat pads. One compensatory response to oxidative stress is the over-production of anti-oxidants. Note that in Cav-1 (−/−) mammary fat pads an 11-fold increase in Vitamin C (ascorbic acid) and a near three-fold increase in Vitamin E (alpha-tocopherol) were observed.
It is also known that oxidative stress is indeed sufficient to induce ketone production in an animal model of Amyotrophic Lateral Sclerosis (ALS). These mice express a mutant form of SOD1 (G86R) and show progressively increased serum levels of ketone bodies.26 Furthermore, ALS patients show increased serum levels of ketone bodies, both 3-hydroxybutyrate and acetone, as documented by NMR spectroscopy.27 Finally, autophagy has also been implicated in the pathogenesis of ALS, both using transgenic SOD1-mutant mouse models and human patient samples.28,29 Thus, oxidative stress, mitochondrial dysfunction and autophagy/mitophagy are all clustered together in various neurodegenerative disorders, such as ALS and Alzheimer disease.
Other noteworthy metabolites that were increased include histamine (2.5-fold) and arachidonic acid (1.5-fold), which may directly or indirectly contribute towards an inflammatory micro-environment. As arachidonic acid is the precursor of both prostaglandins and leukotrienes, increased free arachidonic acid could drive the generation of increased inflammatory mediators. Histamine also increases the differentiation of stromal cells towards a more myo-fibroblastic phenotype,30,31 consistent with the behavior of cancer-associated fibroblasts.
Transcriptional mRNA profiling of Cav-1 (−/−) stromal cells provides validating evidence for a stromal catabolic state.
We have previously traced the lethality of a Cav-1 negative tumor micro-environment to the stromal fibroblast or cancer-associated fibroblast compartment.8,9 Thus, to garner validating evidence for our metabolic profiling studies, we re-interrogated our transcriptional profiling data obtained via the analysis of WT and Cav-1 (−/−) stromal cells.15
We reasoned that many of the metabolic features we have observed could be explained by oxidative stress induced autophagy and mitophagy. In direct support of this notion, Table 3 shows that many of the genes that are involved in mediating autophagy and mitophagy32,33 are indeed upregulated in Cav-1 (−/−) null stromal cells.
Table 3.
Upregulation of autophagy/mitophagy related gene transcripts in Cav-1 (−/−) stromal cells
| Gene | Description | Fold change (KO/WT) | Accession number | p-value |
| Known Genes Associated with Autophagy | ||||
| 1200002N14Rik | RIKEN cDNA 1200002N14 gene | 1.24 | NM_027878 | 0.01 |
| Ambra1 | autophagy/beclin 1 regulator 1 | 1.93 | NM_172669 | 0.04 |
| Atg16l1 | autophagy-related 16-like 1 (yeast) | 1.33 | NM_029846 | 0.01 |
| Atg2a | ATG2 autophagy related 2 homolog A (S. cerevisiae) | 1.41 | NM_194348 | 0.02 |
| Atg2b | ATG2 autophagy related 2 homolog B (S. cerevisiae) | 1.82 | NM_029654 | 0.03 |
| Atg4a | autophagy-related 4A (yeast) | 1.33 | NM_174875 | 0.02 |
| Atg4d | autophagy-related 4D (yeast) | 1.57 | NM_153583 | 0.05 |
| Atg9a | autophagy-related 9A (yeast) | 1.73 | NM_001003917 | 0.005 |
| Becn1 | beclin 1, autophagy related | 1.28 | NM_019584 | 0.009 |
| Fam176a | family with sequence similarity 176, member A | 1.34 | NM_145570 | 0.02 |
| Foxo3 | forkhead box O3 | 2.25 | NM_019740 | 0.005 |
| Frap1 | FK506 binding protein 12-rapamycin associated protein 1 | 1.83 | NM_020009 | 0.04 |
| Il3 | interleukin 3 | 1.42 | NM_010556 | 0.03 |
| Irgm1 | immunity-related GTPase family M member 1 | 2.04 | NM_008326 | 0.05 |
| Irgm2 | immunity-related GTPase family M member 2 | 2.84 | - | 0.01 |
| Map1lc3a | microtubule-associated protein 1 light chain 3alpha | 2.18 | NM_025735 | 0.01 |
| Npc1 | Niemann Pick type C1 | 1.88 | NM_008720 | 0.04 |
| Rab24 | RAB24, member RAS oncogene family | 2.03 | NM_009000 | 0.02 |
| Tsc1 | tuberous sclerosis 1 | 1.44 | NM_022887 | 0.04 |
| Tsc2 | tuberous sclerosis 2 | 1.52 | NM_011647 | 0.02 |
| Wipi1 | WD repeat domain, phosphoinositide interacting 1 | 1.26 | NM_145940 | 0.05 |
| Known Genes Associated with Mitophagy | ||||
| Bnip2 | BCL2/adenovirus E1B interacting protein 2 | 1.51 | NM_016787 | 0.01 |
| Bnip3 | BCL2/adenovirus E1B interacting protein 3 | 1.75 | NM_009760 | 0.02 |
| Bnipl | BCL2/adenovirus E1B 19 kD interacting protein like | 1.40 | NM_134253 | 0.01 |
| Park7 | Parkinson disease (autosomal recessive, early onset) 7 | 1.97 | NM_020569 | 0.02 |
| Pacrgl | PARK2 co-regulated-like | 1.31 | NM_025755 | 0.04 |
| Genes Associated with Mitophagy in a New Yeast Genetic Screen | ||||
| Mon1b | MON1 homolog b (yeast) | 1.96 | NM_173015 | 0.03 |
| Mon2 | MON2 homolog (yeast) | 2.10 | NM_153395 | 0.02 |
| Vps41 | vacuolar protein sorting 41 (yeast) | 1.61 | NM_172120 | 0.003 |
| Dnm1 | dynamin 1 | 1.60 | NM_010065 | 0.007 |
| Mak | male germ cell-associated kinase | 1.49 | NM_001145803 | 0.004 |
| Rpl13a | ribosomal protein L13a | 1.71 | - | 0.03 |
| Abcc2 | ATP-binding cassette, sub-family C (CFTR/MRP), member 2 | 2.05 | NM_013806 | 0.02 |
Since autophagy and mitophagy are dependent on increased lysosomal degradation activity, we also assessed the transcriptional profiles of lysosomal proteases (the cathepsins) and other lysosomal associated proteins (Table 4). Interestingly, numerous cathepsin genes and lysosomal associated proteins were transcriptionally upregulated in Cav-1 (−/−) stromal cells.
Table 4.
Upregulation of gene transcripts encoding lysosomal proteins in Cav-1 (−/−) stromal cells
| Gene | Description | Fold change (KO/WT) | Accession number | p-value |
| Lysosome Associated Proteases | ||||
| Ctsa | cathepsin A | 1.64 | NM_008906 | 0.03 |
| Ctsb | cathepsin B | 1.60 | NM_007798 | 0.03 |
| Ctsf | cathepsin F | 1.62 | NM_019861 | 0.01 |
| Ctsh | cathepsin H | 1.46 | NM_007801 | 0.02 |
| Ctsj | cathepsin J | 1.29 | NM_012007 | 0.05 |
| Ctsl | cathepsin L | 1.46 | NM_009984 | 0.01 |
| Other Lysosomal Associated Proteins | ||||
| Abca2 | ATP-binding cassette, sub-family A (ABC1), member 2 | 1.55 | NM_007379 | 0.02 |
| Als2 | amyotrophic lateral sclerosis 2 (juvenile) homolog (human) | 1.84 | NM_028717 | 0.02 |
| Atp6v0a2 | ATPase, H+ transporting, lysosomal V0 subunit A2 | 1.46 | NM_011596 | 0.03 |
| Atp6v0a4 | ATPase, H+ transporting, lysosomal V0 subunit A4 | 1.78 | NM_080467 | 0.02 |
| Atp6v0d1 | ATPase, H+ transporting, lysosomal V0 subunit D1 | 1.60 | NM_013477 | 0.02 |
| Atp6v1b1 | ATPase, H+ transporting, lysosomal V1 subunit B1 | 1.69 | NM_134157 | 0.04 |
| Atp6v1d | ATPase, H+ transporting, lysosomal V1 subunit D | 1.79 | NM_023721 | 0.003 |
| Atp6v1e1 | ATPase, H+ transporting, lysosomal V1 subunit E1 | 2.08 | NM_007510 | 0.03 |
| Atp6v1g2 | ATPase, H+ transporting, lysosomal V1 subunit G2 | 1.36 | NM_023179 | 0.02 |
| Atp6v1h | ATPase, H+ transporting, lysosomal V1 subunit H | 1.43 | NM_133826 | 0.001 |
| Hps1 | Hermansky-Pudlak syndrome 1 homolog (human) | 1.43 | NM_019424 | 0.02 |
| Lamp3 | lysosomal-associated membrane protein 3 | 1.22 | NM_177356 | 0.01 |
| Laptm5 | lysosomal-associated protein transmembrane 5 | 1.93 | NM_010686 | 0.02 |
| Lyst | lysosomal trafficking regulator | 1.25 | NM_010748 | 0.03 |
| Manba | mannosidase, beta A, lysosomal | 1.35 | NM_027288 | 0.03 |
| Manbal | mannosidase, beta A, lysosomal-like | 1.78 | NM_026968 | 0.03 |
| Npc1 | Niemann Pick type C1 | 1.88 | NM_008720 | 0.04 |
| Rilpl1 | Rab interacting lysosomal protein-like 1 | 1.34 | NM_021430 | 0.05 |
| Tcirg1 | T-cell, immune regulator 1, ATPase, H+ transporting, lysosomal V0 protein A3 | 1.80 | NM_016921 | 0.05 |
| Use1 | unconventional SNARE in the ER 1 homolog (S. cerevisiae) | 1.37 | NM_001145780 | 0.03 |
In further support of increased oxidative stress, we also see the transcriptional overexpression of numerous genes associated with glutathione metabolism, genes responsive to oxidative stress and hypoxia, as well as numerous anti-oxidant proteins (Table 5).
Table 5.
Upregulation of telomerase and selected redox-related gene transcripts in Cav-1 (−/−) stromal cells
| Gene | Description | Fold change (KO/WT) | Accession number | p-value |
| Telomerase | ||||
| 2610028A01Rik | RIKEN cDNA 2610028A01 gene | 1.36 | NM_028228 | 0.03 |
| Tep1 | telomerase associated protein 1 | 1.72 | NM_009351 | 0.02 |
| Glutathione-Related Genes | ||||
| Aldh5a1 | aldhehyde dehydrogenase family 5, subfamily A1 | 1.35 | NM_172532 | 0.02 |
| G6pdx | glucose-6-phosphate dehydrogenase X-linked | 2.72 | NM_008062 | 0.05 |
| Ggt5 | gamma-glutamyltransferase 5 | 1.43 | NM_011820 | 0.01 |
| Ggt7 | gamma-glutamyltransferase 7 | 1.71 | NM_144786 | 0.04 |
| Gpx1 | glutathione peroxidase 1 | 1.82 | NM_008160 | 0.04 |
| Gpx2 | glutathione peroxidase 2 | 2.04 | NM_030677 | 0.03 |
| Gpx3 | glutathione peroxidase 3 | 2.09 | NM_001083929 | 0.03 |
| Gpx4 | glutathione peroxidase 4 | 1.57 | NM_008162 | 0.05 |
| Gpx5 | glutathione peroxidase 5 | 1.51 | NM_NM_010343 | 0.05 |
| Gpx7 | glutathione peroxidase 7 | 1.35 | NM_024198 | 0.007 |
| Gsr | glutathione reductase | 1.59 | NM_010344 | 0.05 |
| Gsta4 | glutathione S-transferase, alpha4 | 1.92 | NM_010357 | 0.01 |
| Gstcd | glutathione S-transferase, C-terminal domain containing | 1.29 | NM_026231 | 0.003 |
| Gstm1 | glutathione S-transferase, mu1 | 2.53 | NM_010358 | 0.01 |
| Gstm2 | glutathione S-transferase, mu2 | 1.32 | NM_008183 | 0.02 |
| Gstm3 | glutathione S-transferase, mu3 | 1.20 | NM_010359 | 0.01 |
| Gstm4 | glutathione S-transferase, mu4 | 1.37 | NM_026764 | 0.004 |
| Gstm7 | glutathione S-transferase, mu7 | 1.59 | NM_026672 | 0.02 |
| Gsto1 | glutathione S-transferase omega1 | 1.65 | NM_01036 | 0.04 |
| Gstp2 | glutathione S-transferase, pi2 | 1.37 | NM_181796 | 0.02 |
| Gstt1 | glutathione S-transferase, theta1 | 1.44 | NM_008185 | 0.03 |
| Gstt3 | glutathione S-transferase, theta3 | 2.15 | NM_133994 | 0.02 |
| Gstt4 | glutathione S-transferase, theta4 | 1.55 | NM_029472 | 0.006 |
| Gstz1 | glutathione transferase zeta1 (maleylacetoacetate isomerase) | 1.24 | NM_010363 | 0.003 |
| Haghl | hydroxyacylglutathione hydrolase-like | 1.79 | NM_026897 | 0.01 |
| Idh1 | isocitrate dehydrogenase 1 (NADP+), soluble | 1.78 | NM_001111320 | 0.04 |
| Oxidative Stress | ||||
| Als2 | amyotrophic lateral sclerosis 2 (juvenile) homolog (human) | 1.84 | NM_028717 | 0.02 |
| Casp3 | caspase 3 | 1.42 | NM_009810 | 0.02 |
| Epas1 | endothelial PAS domain protein 1 | 2.39 | NM_010137 | 0.0004 |
| Ercc2 | excision repair cross-complementing rodent repair deficiency, complementation group 2 | 1.59 | NM_007949 | 0.04 |
| G6pdx | glucose-6-phosphate dehydrogenase X-linked | 2.72 | NM_008062 | 0.05 |
| Gpx1 | glutathione peroxidase 1 | 1.82 | NM_008160 | 0.04 |
| Gpx2 | glutathione peroxidase 2 | 2.04 | NM_030677 | 0.03 |
| Gpx3 | glutathione peroxidase 3 | 2.09 | NM_001083929 | 0.03 |
| Gpx4 | glutathione peroxidase 4 | 1.57 | NM_008162 | 0.05 |
| Gpx5 | glutathione peroxidase 5 | 1.51 | NM_NM_010343 | 0.05 |
| Gpx7 | glutathione peroxidase 7 | 1.35 | NM_024198 | 0.007 |
| Hnf1a | HNF1 homeobox A | 2.58 | NM_009327 | 0.04 |
| Idh1 | isocitrate dehydrogenase 1 (NADP+), soluble | 1.78 | NM_001111320 | 0.04 |
| Mpo | myeloperoxidase | 1.58 | NM_010824 | 0.02 |
| Mtf1 | metal response element binding transcription factor 1 | 1.65 | NM_008636 | 0.03 |
| Oxsr1 | oxidative-stress responsive 1 | 1.46 | NM_133985 | 0.02 |
| Rrm2b | ribonucleotide reductase M2 B (TP53 inducible) | 1.81 | NM_199476 | 0.03 |
| Srxn1 | sulfiredoxin 1 homolog (S. cerevisiae) | 1.51 | NM_029688 | 0.04 |
| Tpo | thyroid peroxidase | 1.99 | NM_009417 | 0.02 |
| Txnip | thioredoxin interacting protein | 1.70 | NM_001009935 | 0.03 |
| Uaca | uveal autoantigen with coiled-coil domains and ankyrin repeats | 1.44 | NM_028283 | 0.04 |
| Xpa | xeroderma pigmentosum, complementation group A | 1.71 | NM_011728 | 0.02 |
| Hypoxia | ||||
| Arnt2 | aryl hydrocarbon receptor nuclear translocator 2 | 1.78 | NM_007488 | 0.02 |
| Casp1 | caspase 1 | 1.79 | NM_009807 | 0.05 |
| Cd24a | CD24a antigen | 1.59 | NM_009846 | 0.06 |
| Epas1 | endothelial PAS domain protein 1 | 2.39 | NM_010137 | 0.0004 |
| Epo | erythropoietin | 1.86 | NM_007942 | 0.0005 |
| Hyou1 | hypoxia upregulated 1 | 1.56 | NM_021395 | 0.02 |
| Itpr1 | inositol 1,4,5-triphosphate receptor 1 | 1.55 | NM_010585 | 0.02 |
| Kcnma1 | potassium large conductance calcium-activated channel, subfamily M, alpha member 1 | 1.68 | NM_010610 | 0.007 |
| Mecp2 | methyl CpG binding protein 2 | 1.63 | NM_010788 | 0.01 |
| Mmp2 | matrix metallopeptidase 2 | 1.86 | NM_008610 | 0.004 |
| P2rx2 | purinergic receptor P2X, ligand-gated ion channel, 2 | 1.57 | NM_153400 | 0.04 |
| Plat | plasminogen activator, tissue | 1.57 | NM_008872 | 0.01 |
| Pml | promyelocytic leukemia | 1.45 | NM_178087 | 0.05 |
| Slc2a8 | solute carrier family 2, (facilitated glucose transporter), member 8 | 1.30 | NM_019488 | 0.02 |
| Sod3 | superoxide dismutase 3, extracellular | 1.28 | NM_011435 | 0.03 |
| Redoxins | ||||
| Fdx1 | ferredoxin 1 | 1.28 | NM_007996 | 0.05 |
| Fdxr | ferredoxin reductase | 1.95 | NM_007997 | 0.02 |
| Glrx3 | glutaredoxin 3 | 1.26 | NM_023140 | 0.01 |
| Nxn | nucleoredoxin | 1.23 | NM_008750 | 0.03 |
| Park7 | Parkinson disease (autosomal recessive, early onset) 7 | 1.97 | NM_020569 | 0.02 |
| Srxn1 | sulfiredoxin 1 homolog (S. cerevisiae) | 1.51 | NM_029688 | 0.04 |
| Tmx3 | thioredoxin-related transmembrane protein 3 | 1.30 | NM_198295 | 0.02 |
| Txndc11 | thioredoxin domain containing 11 | 1.28 | NM_029582 | 0.02 |
| Txndc3 | thioredoxin domain containing 3 (spermatozoa) | 2.21 | NM_181591 | 0.007 |
| Txndc5 | thioredoxin domain containing 5 | 1.47 | NM_145367 | 0.02 |
| Txnip | thioredoxin interacting protein | 1.70 | NM_001009935 | 0.03 |
| Txnl4a | thioredoxin-like 4A | 1.89 | NM_025299 | 0.04 |
| Txnrd2 | thioredoxin reductase 2 | 1.34 | NM_013711 | 0.03 |
Thus, the transcriptional mRNA profile of Cav-1 (−/−) stromal cells is consistent with oxidative stress-induced autophagy and mitophagy. See also Supplemental Tables 1 and 2, including additional lysosome-related and peroxisome-related gene transcripts.
Transcriptional mRNA profiling of human breast cancer stroma provides evidence for stromal autophagy and mitophagy in vivo.
To further test the possible clinical relevance of our observations regarding autophagy and mitophagy, we next analyzed the transcriptional profiles of human tumor stroma that was isolated by laser-capture micro-dissection of breast cancer tumor tissue.34 The methods and origins of these samples have been previously described in detail.17
Using these raw transcriptional profiling data,34 we created three related gene lists: (1) tumor stroma, (2) recurrence stroma and (3) metastasis stroma.17 The tumor stroma list contains genes that were upregulated in the stroma of primary tumors, as compared with normal mammary gland stroma. The recurrence stroma list contains stromal genes, from the primary tumor, that are upregulated in patients that underwent tumor recurrence, as compared with patients that did not recur. The metastasis stromal list contains stromal genes, from the primary tumor, that are upregulated in patients that underwent lymph node metastasis at diagnosis, as compared with patients that did not show lymph node metastasis. Thus, we analyzed these 3 complementary gene lists for evidence of autophagy and mitophagy.
Table 6 shows that many of the genes that are associated with autophagy and mitophagy32,33 are transcriptionally upregulated in the tumor stroma of human breast cancer patients. In further support of this idea, we see the upregulation of lysosomal proteases (the cathepsins and legumain), as well as other lysosomal associated proteins (Table 7). Finally, genes associated with glutathione metabolism, oxidative and hypoxic stress, as well as anti-oxidants are all transcriptionally upregulated in the tumor stroma obtained from human breast cancer patients (Table 8). Most interestingly, many of these gene transcripts are also associated with tumor recurrence and metastasis (See Tables 6–8).
Table 6.
Upregulation of autophagy/mitophagy related gene transcripts in the tumor stroma from human breast cancer patients
| Gene | Description | Tumor stroma | Recurrence-stroma | Metastasis-stroma | |
| Known Genes Associated with Autophagy | |||||
| Atg9b | autophagy related 9 homolog B (yeast) | 1.97E-20 | 1.58E-03 | ||
| Atg16l1 | autophagy-related 16-like 1 (yeast) | 3.75E-15 | 1.64E-04 | ||
| Atg7 | autophagy-related 7 (yeast) | 7.64E-14 | |||
| Atg4b | autophagy-related 4B (yeast) | 3.49E-05 | |||
| Becn1 | beclin 1, autophagy related | 7.50E-05 | |||
| Atg4a | autophagy-related 4A (yeast) | 6.21E-03 | |||
| Atg4b | autophagy-related 4B (yeast) | 2.75E-02 | |||
| Atg3 | autophagy-related 3 (yeast) | 1.01E-02 | 3.08E-03 | ||
| Il3 | interleukin 3 | 2.72E-08 | |||
| Tsc1 | tuberous sclerosis 1 | 2.44E-05 | |||
| Tsc2 | tuberous sclerosis 2 | 9.19E-05 | |||
| Known Genes Associated with Mitophagy | |||||
| Bnip2 | BCL2/adenovirus E1B interacting protein 2 | 1.98E-12 | |||
| Bnipl | BCL2/adenovirus E1B 19 kD interacting protein like | 8.29E-11 | 3.08E-02 | ||
| Bnip3 | BCL2/adenovirus E1B interacting protein 3 | 8.08E-03 | |||
| Bnip3l | BCL2/adenovirus E1B interacting protein 3-like | 2.85E-08 | |||
| Pink1 | PTEN induced putative kinase 1 | 5.28E-09 | 4.60E-02 | ||
| Park7 | Parkinson disease (autosomal recessive, early onset) 7 | 2.93E-17 | |||
| Park2 | Parkinson disease (autosomal recessive, juvenile) 2, parkin | 1.19E-16 | |||
| Pddc1 | Parkinson disease 7 domain containing 1 | 1.36E-08 | 2.65E-02 | ||
| S100a8 | S100 calcium binding protein A8 (calgranulin A) | 5.96E-18 | |||
| S100a9 | S100 calcium binding protein A9 (calgranulin B) | 2.53E-06 | 1.03E-02 | ||
| Genes Associated with Mitophagy in a New Yeast Genetic Screen | |||||
| Mon1a | MON1 homolog A (yeast) | 1.36E-10 | 3.94E-03 | ||
| Stx12 | syntaxin 12 | 5.87E-10 | |||
| Vps41 | vacuolar protein sorting 41 (yeast) | 6.57E-03 | |||
| Atp2c1 | ATPase, Ca++-sequestering | 6.59E-24 | |||
| Dnm1 | dynamin 1 | 1.13E-11 | |||
| Gsg1 | germ cell-specific gene 1 | 2.30E-18 | 7.34E-04 | ||
| Mak10 | MAK10 homolog, amino-acid N-acetyltransferase subunit | 1.70E-07 | |||
| Rpl13a | ribosomal protein L13a | 3.14E-02 | |||
| Abcc2 | ATP-binding cassette, sub-family C (CFTR/MRP), member 2 | 2.47E-02 | |||
Table 7.
Upregulation of gene transcripts encoding lysosomal proteins in the tumor stroma from human breast cancer patients
| Gene | Description | Tumor stroma | Recurrence-stroma | Metastasis-stroma | |
| Stromal Expresssion of Lysosome Associated Proteases | |||||
| Ctsb | cathepsin B | 4.11E-36 | 3.27E-02 | 1.39E-02 | |
| Ctsz | cathepsin Z | 5.62E-24 | |||
| Ctsk | cathepsin K | 3.28E-20 | |||
| Ctso | cathepsin O | 1.49E-19 | |||
| Ctse | cathepsin E | 1.66E-19 | 3.78E-03 | ||
| Ctss | cathepsin S | 3.70E-18 | |||
| Ctsw | cathepsin W | 1.94E-15 | |||
| Ctsf | cathepsin F | 7.03E-14 | |||
| Ctsh | cathepsin H | 7.21E-12 | |||
| Ctsg | cathepsin G | 1.32E-11 | 4.03E-04 | ||
| Lgmn | legumain | 4.24E-02 | |||
| Stromal Association of Other Lysosomal Associated Proteins | |||||
| Atp6ap1 | AtPase, H+ transporting, lysosomal accessory protein 1 | 2.11E-27 | |||
| Lamp2 | lysosomal-associated membrane protein 2 | 3.75E-24 | |||
| Atp6v0a2 | AtPase, H+ transporting, lysosomal V0 subunit A2 | 1.06E-22 | |||
| Lamp3 | lysosomal-associated membrane protein 3 | 3.09E-21 | |||
| Atp6v0e | AtPase, H+ transporting, lysosomal V0 subunit E | 1.39E-20 | 4.85E-02 | ||
| Atp6v0d2 | AtPase, H+ transporting, lysosomal V0 subunit D2 | 2.00E-20 | |||
| Atp6v1b1 | AtPase, H+ transporting, lysosomal V1 subunit B1 | 8.45E-20 | 6.56E-03 | ||
| Atp6v0d1 | AtPase, H+ transporting, lysosomal V0 subunit D1 | 1.32E-19 | |||
| Lipa | lysosomal acid lipase A | 4.83E-19 | |||
| Atp6v1g2 | AtPase, H+ transporting, lysosomal V1 subunit G2 | 7.64E-18 | |||
| Atp6v1a | AtPase, H+ transporting, lysosomal V1 subunit A | 8.45E-17 | 1.51E-08 | ||
| Atp6v1c2 | AtPase, H+ transporting, lysosomal V1 subunit C2 | 7.64E-16 | 5.72E-03 | ||
| Lamp1 | lysosomal-associated membrane protein 1 | 1.22E-15 | 8.38E-04 | ||
| Tcirg1 | T-cell, immune regulator 1, AtPase, H+ transporting, lysosomal V0 protein A3 | 1.26E-14 | 1.96E-02 | ||
| Atp6v1c1 | AtPase, H+ transporting, lysosomal V1 subunit C1 | 1.62E-13 | |||
| Laptm4a | lysosomal-associated protein transmembrane 4A | 2.89E-13 | |||
| Atp6v0a1 | AtPase, H+ transporting, lysosomal V0 subunit A1 | 5.35E-12 | 5.93E-03 | ||
| Lyst l | ysosomal trafficking regulator | 1.20E-11 | |||
| Atp6v1g3 | AtPase, H+ transporting, lysosomal V1 subunit G3 | 2.43E-08 | |||
| Atp6v0a4 | AtPase, H+ transporting, lysosomal V0 subunit A4 | 4.37E-07 | 2.34E-03 | ||
| Laptm4b | lysosomal-associated protein transmembrane 4B | 3.54E-02 | |||
Table 8.
Upregulation of telomerase and selected redox-related gene transcripts in the tumor stroma from human breast cancer patients
| Gene | Description | Tumor stroma | Recurrence-stroma | Metastasis-stroma | |
| Telomerase-Related | |||||
| Rtel1 | regulator of telomere elongation helicase 1 | 6.03E-06 | |||
| Terf1 | telomeric repeat binding factor 1 | 4.49E-02 | |||
| Terf2 | telomeric repeat binding factor 2 | 3.56E-08 | 1.63E-02 | ||
| Tert | telomerase reverse transcriptase | 1.34E-11 | 1.23E-02 | 2.17E-02 | |
| Tep1 | telomerase associated protein 1 | 2.21E-07 | 5.05E-05 | ||
| Tinf2 | Terf1 (TRF1)-interacting nuclear factor 2 | 8.40E-06 | |||
| Glutathione-Related Genes | |||||
| Gpx1 | glutathione peroxidase 1 | 1.77E-31 | |||
| Mgst3 | microsomal glutathione S-transferase 3 | 1.29E-19 | |||
| Gpx6 | glutathione peroxidase 6 | 1.66E-19 | |||
| Gsta3 | glutathione S-transferase, alpha3 | 1.00E-15 | 9.54E-04 | ||
| Gpx7 | glutathione peroxidase 7 | 1.93E-15 | |||
| Gstt2 | glutathione S-transferase, theta2 | 1.07E-14 | |||
| Gpx5 | glutathione peroxidase 5 | 5.30E-14 | 4.33E-03 | ||
| Gstcd | glutathione S-transferase, C-terminal domain containing | 6.17E-11 | |||
| Gstm5 | glutathione S-transferase, mu5 | 8.78E-08 | 4.56E-02 | 7.39E-03 | |
| Gpx2 | glutathione peroxidase2 | 9.98E-08 | 3.10E-02 | ||
| Gstm3 | glutathione S-transferase, mu3 | 2.87E-02 | |||
| Haghl | hydroxyacylglutathione hydrolase-like | 4.02E-02 | |||
| Gstm4 | glutathione S-transferase, mu4 | 1.44E-02 | |||
| Mgst1 | microsomal glutathione S-transferase 1 | 1.44E-02 | |||
| Gpx3 | glutathione peroxidase 3 | 4.32E-02 | |||
| Oxidative Stress and Hypoxia | |||||
| Oxsr1 | oxidative-stress responsive 1 | 5.45E-20 | 1.43E-02 | ||
| Hif3a | hypoxia inducible factor 3alpha subunit | 2.27E-15 | 2.15E-04 | ||
| Hyou1 | hypoxia upregulated 1 | 3.45E-14 | 2.85E-04 | ||
| Hif1an | hypoxia-inducible factor 1alpha subunit inhibitor | 8.86E-12 | 1.95E-03 | 6.98E-03 | |
| Hif1a | hypoxia inducible factor 1alpha subunit | 2.10E-06 | |||
| Redoxin's | |||||
| Txndc3 | thioredoxin domain containing 3 (spermatozoa) | 9.19E-27 | |||
| Txnl4a | thioredoxin-like 4A | 5.81E-22 | |||
| Txndc2 | thioredoxin domain containing 2 (spermatozoa) | 3.65E-16 | |||
| Prdx3 | peroxiredoxin 3 | 9.85E-12 | 2.02E-03 | ||
| Txnrd2 | thioredoxin reductase 2 | 1.21E-11 | |||
| Glrx5 | glutaredoxin 5 homolog (S. cerevisiae) | 2.02E-10 | |||
| Nxn | nucleoredoxin | 3.48E-04 | |||
| Txnip | thioredoxin interacting protein | 1.77E-03 | |||
| Glrx | glutaredoxin | 2.70E-02 | |||
| Txnl1 | thioredoxin-like 1 | 2.99E-02 | |||
| Prdx2 | peroxiredoxin 2 | 2.18E-02 | |||
| Prdx6 | peroxiredoxin 6 | 3.62E-02 | |||
| Fdxr | ferredoxin reductase | 4.29E-02 | |||
| Mterfd2 | MTERF domain containing 2 | 8.13E-23 | |||
| Mterfd1 | MTERF domain containing 1 | 3.81E-02 | 1.32E-02 | ||
It is important to note that telomerase-related genes are also transcriptionally upregulated in both Cav-1 (−/−) stromal cells and the tumor stroma of human breast cancers (See Tables 5 and 8). Thus, overexpression of telomerase activity could provide an escape mechanism to keep stromal cell cells alive for much longer periods of time under conditions of oxidative stress, autophagy and mitophagy.
To independently assess the statistical association of autophagy, lysosomes, peroxisomes and telomere-related gene transcripts with the human tumor stroma of breast cancer patients, we next used more comprehensive gene ontology lists (see Suppl. Tables 3–6) to intersect with the tumor stroma, recurrence stroma and metastasis stroma gene lists. The results of this more detailed lysosomal degradation and telomere-maintenance) may play a analysis are presented in Figures 3–5, and are represented as significant pathogeneic role in generating an activated lethal Venn diagrams. tumor stroma.
Figure 3.

Venn diagrams for the transcriptional overlap between autophagy and tumor stroma from breast cancer patients. Upper panel, overlap with tumor stroma. Note the overlap of 93 genes with a p value of 2.65 × 10⁻⁶. Middle panel, Overlap with “recurrence-prone” stroma. Note the overlap of 47 genes with a p value of 2.22 × 10⁻³. Lower panel, overlap with “metastasis-prone” stroma. Note the overlap of 17 genes with a p value of 5.32 × 10⁻².
Figure 5.

Venn diagrams for the transcriptional overlap between peroxisomes and tumor stroma from breast cancer patients. Upper panel, overlap with tumor stroma. Note the overlap of 204 genes with a p value of 4.25 × 10⁻¹². Lower panel, overlap with “recurrence-prone” stroma. Note the overlap of 101 genes with a p value of 2.76 × 10⁻⁵.
More specifically, Figure 3 shows that autophagy-related genes are significantly associated with tumor stroma, recurrence-stroma and metastasis-stroma. Similarly, lysosome-related genes were significantly associated with tumor stroma and recurrence-stroma, while telomere-related genes were only associated with metastasis-stroma (Fig. 4A and B). Finally, peroxisome-related genes were significantly associated with both tumor stroma and recurrence-stroma (Fig. 5). Thus, all of these inter-related biological processes (oxidative stress, autophagy/lysosomal degradation and telomere-maintenance) may play a significant pathogeneic role in generating an activated lethal tumor stroma.
Figure 4.

Venn diagrams for the transcriptional overlap between lysosomes and telomere-related genes, with tumor stroma from breast cancer patients. Upper panel, overlap with tumor stroma. Note the overlap of 175 genes with a p value of 1.23 × 10⁻¹⁵. Middle panel, overlap with “recurrence-prone” stroma. Note the overlap of 74 genes with a p value of 2.10 × 10⁻³. Lower panel, Overlap with “metastasis-prone” stroma. Note the overlap of 38 genes with a p value of 9.67 × 10⁻⁵.
ADMA and ketone metabolism in Cav-1 (−/−) stromal cells and human tumor stroma.
Here, we have identified ADMA and 3-hydroxybutyrate (BHB) as the two major metabolites, which increased in Cav-1 (−/−) null mammary fat pads and lung tissue, along with pyruvate to a lesser extent. We believe that these two metabolites (ADMA and BHB) are reflective of oxidative stress and mitochondrial dysfunction in Cav-1 (−/−) stromal cells.
To further validate these observations, we analyzed transcriptional profiling data for the expression of the relevant enzymes that are involved in ADMA and ketone metabolism. Both transcriptional profiles from Cav-1 (−/−) null stromal cells and human breast cancer tumor stroma were analyzed in parallel and are presented in Table 9. For this purpose, we analyzed the mRNA expression of the genes involved in ADMA production (PRMT gene family members) and degradation (DDAH1/2), as well as nitric oxide (NO) related genes, as ADMA drives NOS uncoupling and the production of superoxide, instead of NO.19 Interestingly, using this approach, we see that the genes involved in both ADMA production (PRMT2/7/8) and degradation (DDAH1/2), as well as nitric oxide production (NOS1/2/3 or NOS trafficking), are all transcriptionally overexpressed, both in human tumor stroma and in Cav-1 (−/−) stromal cells.
Table 9.
Transcriptional profiling of human breast cancer tumor stroma: ADMA and BHB metabolism
| Gene symbol | Tumor stroma | Recurrence-stroma | Metastasis-stroma | Cav-1 KO MSCs | |
| ADMA Production | Fold-change | p-value | |||
| PRMT2 | 1.35E-02 | 1.68 | 0.1 | ||
| PRMT7 | 1.76E-02 | ||||
| PRMT8 | 2.41E-18 | 3.04E-02 | 1.56 | 0.02 | |
| ADMA Degradation | |||||
| DDAH1 | 2.36E-10 | 1.90 | 0.006 | ||
| DDAH2 | 7.25E-16 | 1.46 | 0.005 | ||
| Ketone Production | |||||
| ACLY | 1.55E-02 | 2.50E-02 | 2.19 | 0.02 | |
| HMGCS1 | 1.34 | 0.04 | |||
| HMGCS2 | 3.91E-19 | 3.30E-02 | 1.52 | 0.04 | |
| HMGCL | 2.24 | 0.03 | |||
| HMGCLL1 | 3.19E-13 | 5.95E-04 | |||
| BDH1 | 1.04E-06 | 6.46E-03 | 1.38 | 0.04 | |
| BDH2 | 3.54E-02 | ||||
| Ketone Re-Utilization | |||||
| ACAT1 | |||||
| ACAT2 | 1.57 | 0.1 | |||
| OXCT1 | 1.25 | 0.04 | |||
| OXCT2 | 1.38 | 0.05 | |||
| Nitric Oxide Production | |||||
| NOS1 | 2.02E-13 | 1.82E-04 | |||
| NOS2 | 1.36 | 0.05 | |||
| NOS3 | 1.36E-06 | 1.21E-02 | 1.65 | 0.05 | |
| NOSIP | 3.04E-02 | 1.59 | 0.03 | ||
| NOSTRIN | 2.09E-04 | 1.21 | 0.02 | ||
Note that for ADMA production, only PRMT genes that were upregulated in the tumor stromal gene sets or Cav-1 KO MSCs are listed. MSCs, mesenchymal stem cells.
Next, we turned our attention to ketone metabolism (Table 9). For this purpose, we analyzed the transcriptional profiles of the genes associated with both ketone production (ACYL, HMGCS1/2, HMGCL, HMGCLL1 and BDH1/2) and ketone re-utilization (ACAT1/2 and OXCT1/2). Interestingly, only the genes associated with ketone production, but not ketone re-utilization were associated with human tumor stroma. This is exactly as would be predicted, as the epithelial cancer cells should express the genes associated with ketone re-utilization, so that they can re-use 3-hydroxybutyrate as an energy source for mitochondrial oxidative metabolism. Also, many of the stromal genes involved in ketone production are specifically associated with tumor recurrence (ACLY, HMGCS2, HMGCLL1 and BDH1) and/or metastasis (BDH2). Many of these ketone production genes are also transcriptionally overexpressed in Cav-1 (−/−) stromal cells, consistent with our current metabolic analysis.
Micro-RNA (miR) profiling provides new mechanistic insight into how loss of stromal Cav-1 drives oxidative stress, autophagy and mitochondrial dysfunction.
Since miRs have recently taken center stage in the molecular analysis of tumor progression and metastasis, we subjected Cav-1 (−/−) stromal cells to miR transcriptional profiling. Using this approach, we hoped to identify a subset of miRs that could explain the oxidative and catabolic phenotypes we observe metabolically in Cav-1 (−/−) mammary fat pads.
Table 10 shows that only a select number of miRs were transcriptionally upregulated in Cav-1 (−/−) stromal cells. For this analysis, we chose a cut-off of 1.5-fold increased (KO/WT). P-values are as shown. Note that top two miRs showed the most significant p-values. Notably, miR-31 and miR-34c were increased 4.2-fold and nearly three-fold, respectively.
Table 10.
Upregulation of miR's in Cav-1 (−/−) null stromal cells
| Symbol | Fold change (KO/WT) | p-value |
| miR-31 | 4.24 | 0.002 |
| miR-34c | 2.95 | 0.01 |
| miR-423-3p | 2.18 | 0.02 |
| miR-193b | 2.08 | 0.09/ns |
| miR-423-5p | 1.99 | 0.03 |
| miR-342-5p | 1.96 | 0.05 |
| miR-210 | 1.74 | 0.07/ns |
| miR-574-3p | 1.72 | 0.02 |
| miR-182 | 1.71 | 0.04 |
| miR-298 | 1.71 | 0.04 |
| miR-28 | 1.70 | 0.1/ns |
| miR-744 | 1.68 | 0.1/ns |
| miR-20b | 1.62 | 0.1/ns |
| miR-467h | 1.59 | 0.07/ns |
| miR-185 | 1.58 | 0.04 |
| miR-222 | 1.55 | 0.04 |
| miR-125a-5p | 1.53 | 0.06/ns |
ns, not significant. Noteworthy miRs are highlighted in bold.
A large body of evidence suggests that both miR-31 and miR-34c play prominent roles in both tumorigenesis and metastasis. miR-34c is normally induced under conditions of oxidative stress, DNA damage and cellular senescence,35–37 consistent with our metabolic and mRNA transcriptional profiling data related to oxidative stress.
miR-31, on the other hand, targets FIH (factor inhibiting HIF).18 This, in turn, leads to the loss of FIH protein expression, driving HIF1α transcriptional activity.18 Both hypoxia and HIF1α activation itself are known to be sufficient to induce autophagy and mitophagy.38,39 Thus, loss of Cav-1 expression, driving miR-31 overexpression and HIF1α activation, may be sufficient to explain our current findings related to oxidative stress, autophagy and mitophagy. In accordance with a role for Cav-1 in hypoxia regulation and HIF1α activation, we also observed an increase in miR-210, which is known to mediate many of the effects attributed to the hypoxia genetic transcriptional program.40 However, although miR-210 was increased nearly two-fold, it did not reach statistical significance (p = 0.07).
miR-31 has recently been shown to be increased in the serum of patients with oral squamous cell cancers, and is dramatically reduced upon tumor resection, indicating that it can function as a marker for monitoring the course of cancer therapy.41 miR-31 is also upregulated in human colon cancers.42 Similarly, miR-210 is increased in the serum of pancreatic cancer patients.43
Overexpression of autophagy and mitophagy markers in Cav-1 (−/−) null mammary fat pads: Cathepsin B and BNIP3.
To further validate the idea that a loss of Cav-1 drives the onset of oxidative-stress induced autophagy, we next assessed the expression of established autophagy markers, namely cathepsin B44 and BNIP3,38 in Cav-1 (−/−) mammary fat pads. Cathepsin B is a well-known lysosomal cysteine protease that is upregulated in the tumor stroma of human breast cancers, and its expression is also associated with tumor recurrence and metastasis (Table 7). BNIP3 is a marker of autophagy, which mediates the autophagic destruction of mitochondria by a process called mitophagy.38 BNIP3 is also upregulated by oxidative stress and/or hypoxia, and is under the direct transcriptional control of HIF1α.38 The stromal expression of BNIP3 is also associated with breast cancer tumor recurrence (Table 6). Importantly, Figure 6 directly shows that both cathepsin B (the pro-enzyme and activated form) and BNIP3 are significantly overexpressed in Cav-1 (−/−) null mammary fat pads, relative to wild-type controls processed in parallel. Immunoblotting with Cav-1 and beta-actin are shown for comparison. These results are consistent with the idea that a loss of Cav-1 expression promotes the onset of autophagy in the tumor stromal compartment.
Figure 6.
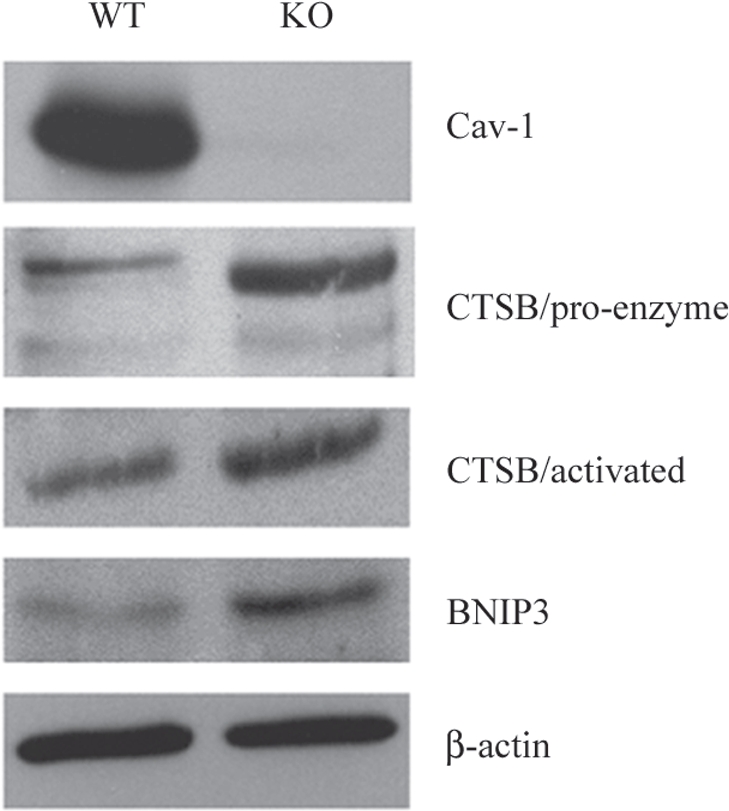
Over-expression of autophagy and mitophagy markers in Cav-1 (−/−) null mammary fat pads: Cathepsin B and BNIP3. To validate the idea that a loss of Cav-1 drives the onset of autophagy, we assessed the expression of established autophagy markers, namely cathepsin B and BNIP3, in Cav-1 (−/−) mammary fat pads. Cathepsin B is a well-known lysosomal protease. BNIP3 is a marker of autophagy that mediates the autophagic destruction of mitochondria. Note that both cathepsin B (the pro-enzyme and activated form) and BNIP3 are significantly overexpressed in Cav-1 (−/−) null mammary fat pads (KO), relative wild-type controls (WT). Immuno-blotting with Cav-1 and ²-actin are shown for comparison. CTSB, cathepsin B.
Discussion
Here, we have used the mammary fat pad of Cav-1 (−/−) null mice as a pre-clinical model for a “lethal tumor-microenvironment”, i.e., the tumor stroma without the tumor. We have previously documented that a loss of stromal Cav-1 in the fibroblast compartment of human breast cancer, DCIS and prostate cancer is associated with poor clinical outcome.9–12,14 In breast cancer, a loss of stromal Cav-1 is a single independent predictor of early tumor recurrence, lymph node metastasis and tamoxifen-resistance.9,14 In DCIS, a loss of stromal Cav-1 predicts both early recurrence and progression to invasive breast cancer.10 Finally, in prostate cancer patients, a loss of stromal Cav-1 is associated with advanced prostate cancer and tumor progression/metastasis and high Gleason score, indicative of a poor prognosis.11
Oxidative stress and autophagy/mitophagy in the tumor micro-environment.
To mechanistically understand the lethality of a loss of Cav-1 in the tumor stromal compartment, we have now taken an unbiased screening approach, by performing a metabolomics analysis on fresh tissue harvested from the mammary fat pads of Cav-1 (−/−) null mice. Based on this analysis, we provide evidence for a series of severe metabolic defects in Cav-1 deficient tissues. More specifically, we show that nearly 100 metabolites are elevated in Cav-1 (−/−) null mammary fat pads. An analysis of these data is consistent with the onset of oxidative stress phenotype, combined with mitochondrial dysfunction and autophagy. The two most significant metabolites that are elevated are ADMA and 3-hydroxybutyrate. Also, several energy-rich metabolites, such as pyruvate and metabolic components of the TCA cycle are increased. These phenotypic changes could provide a logical and intriguing explanation for the lethality of a Cav-1 deficient tumor micro-environment, as oxidative stress is known to drive both mitochondrial dysfunction and autophagy/mitophagy, and this would set-up a situation in which catabolism of the tumor stroma could be used to directly “feed” the anabolic growth of tumor epithelial cancer cells. This is an exceptionally ingenious parasitic strategy that could promote tumor progression and metastasis (summarized in Fig. 7).
Figure 7.
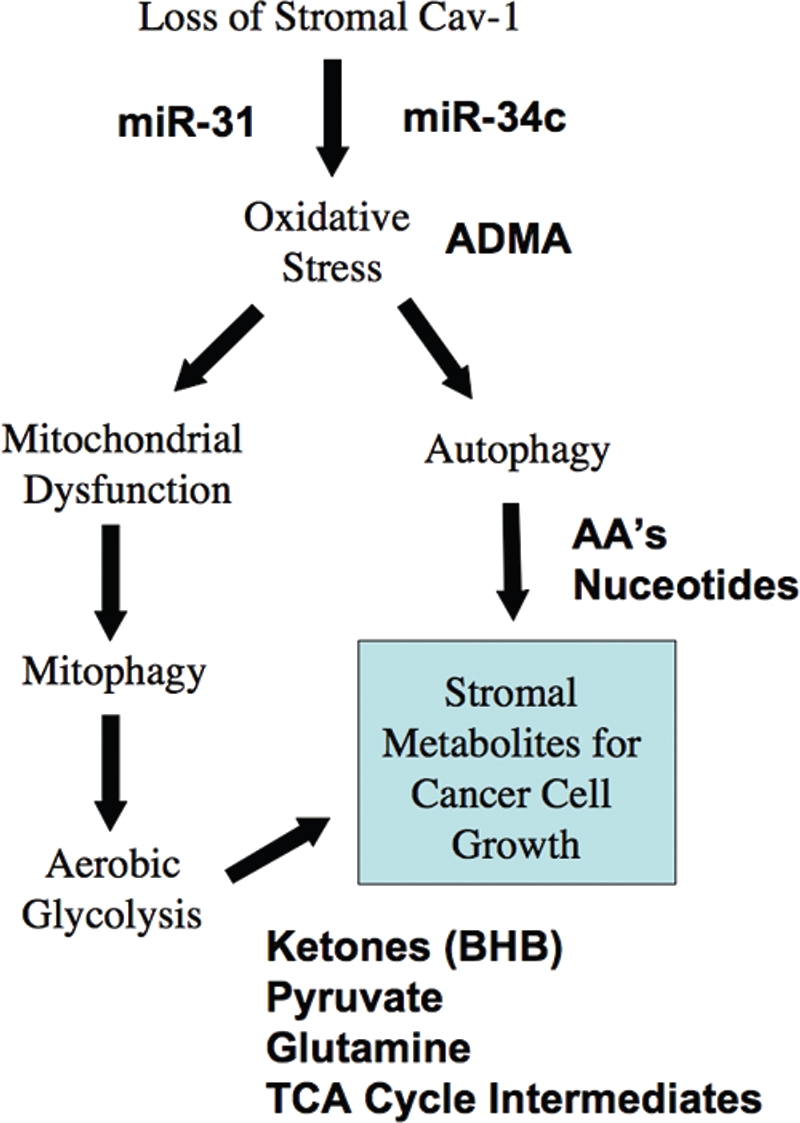
Understanding a lethal tumor micro-environment: Oxidative stress drives stromal autophagy/mitophagy, providing stromal-derived nutrients for epithelial cancer cells. Here, using metabolic, transcriptional mRNA and miR profiling, we have identified that loss of stromal Cav-1 induces oxidative stress, mitochondrial dysfunction and autophagy/mitophagy in the tumor micro-environment. This model would then provide recycled chemical building blocks (nutrients, amino acids, energy-rich metabolites, nucleotides) derived from stromal cells (fibroblasts) that then could be harnessed by epithelial cancer cells to promote tumor growth. Mitochondrial dysfunction and mitophagy would result in aerobic glycolysis in stromal cells, explaining our previous observations on the “reverse Warburg effect”. Many of the key components we have identified here through metabolic and micro-RNA profiling are shown in BOLD: miR-31, miR-34c, ADMA, essential amino acids (AA's), nucleotides, pyruvate, ketones (BHB) and TCA cycle intermediates.
To independently validate these assertions, we next used an informatics approach to re-interrogate our transcriptional profiling data obtained from the analysis of Cav-1 (−/−) deficient stromal cells, isolated from the bone marrow of Cav-1 knockout mice. Importantly, bone marrow mesenchymal stem cells are thought to be the precursors of cancer associated fibroblasts that are recruited by epithelial tumor cells to cancerous lesions.6 Based on our re-analysis of this data set, we provide evidence for the upregulation of numerous gene transcripts specifically associated with authophagy/mitophagy, lysosomal biogenesis, oxidative stress, the glutathione pathway, and the compensatory upregulation of anti-oxidant enzymes. These results provide direct independent validation of our metabolic profiling studies.
To assess the relevance of our findings for human breast cancers, we next looked for evidence of the same transcriptional profiles in the tumor stroma that was laser-capture micro-dissected from the primary human tumors of patients with breast cancer. Importantly, our re-interrogation of these data sets indicated that the following biological processes are well-represented in the tumor stroma: authophagy/mitophagy, lysosomal biogenesis, oxidative stress, the glutathione pathway, and the upregulation of anti-oxidant enzymes. Many of the transcripts associated with these processes were also related to tumor recurrence and lymph-node metastasis.
Identification of ADMA and ketones as key metabolites: implications for diagnosis and drug discovery.
Since ADMA and 3-hydroxybutyrate emerged as the two most important metabolites that were increased in our metabolomic analysis, we validated that the enzymes responsible for their production were transcriptionally increased both in Cav-1 (−/−) stromal cells and the tumor stroma isolated from human breast cancers. Thus, these new observations now provide an opportunity for both diagnostic stratification of patients and the design of new drug therapies, to both identify and combat an aggressive tumor micro-environment.
ADMA is a catabolic breakdown product released from methylated proteins after their proteolytic degradation.19–21 It is known to be strongly associated with endothelial cell dysfunction and oxidative stress.19–21 In addition, it also has biological activity and can enhance and propagate the effects of oxidative stress. For example, it is known to function as a natural endogenous inhibitor of nitric oxide synthase (NOS) enzymes, halting the production of nitric oxide (NO). However, it also changes the specificity of the NOS enzymes, allowing them to consitutively produce superoxide instead.19–21 Thus, ADMA is both a marker of oxidative stress and actively generates more oxidative stress. Furthermore, ADMA changes the location of eNOS and directly targets the enzyme to mitochodria, where it produces superoxide.21 Thus, ADMA is a mitochondrial “time-bomb” that leads to irreversible oxidative damage within mitochondria, necessitating their destruction by mitophagy.21 This, in turn, provides a mechanism for turning on aerobic glycolysis, so that the stromal cells will produce energy to ensure their own survival. However, aerobic glycolysis in the stroma releases both lactate and pyruvate, which can be used by epithelial cancer cells undergoing TCA-based oxidative metabolism, thereby providing paracrine energy for tumor growth.
Stromal ketone production also likely plays a strong pathogenic role. Ketone production is a well-established marker of mitochondrial dysfunction,22,23 consistent with our assertions regarding ADMA, oxidative stress and autophagy/mitophagy. Ketones are normally produced by the liver and virtually every other organ system in the body during periods of fasting and starvation, and they are then transferred to the brain to maintain survival of the organism. Just as pyruvate and lactate can be secreted and taken up by monocarboxylic acid transporters (MCTs), the ketones 3-hydroxybutyrate and acetoacetate both follow the same principles.45–47 So, ketone bodies can be transferred directly from stromal cancer-associated fibroblasts to epithelial cancer cells via MCTs, without any energy expenditure. Moreover, ketones are a “super-fuel” for mitochondria, producing more energy than lactate/pyruvate, and simultaneously decreasing oxygen consumption.45–47 In fact, because of these properties, ketones have been used to prevent ischemic tissue damage, in animal models undergoing either myocardial infarctions or stroke, leading to dramatically smaller ischemic/necrotic lesion area.48,49 So, just as ketones are a “super-fuel” under conditions of ischemia in the heart and in the brain, they could fulfill a similar function during tumorigenesis, as the hypoxic tumor exceeds its blood supply. So, stromal ketone production could obviate the need for tumor angiogenesis. Once ketones are produced and released from stromal cells, they could then be re-utilized by epithelial cancer cells, where they could directly enter the TCA cycle, just like lactate and pyruvate. In this sense, ketones are a more powerful mitochondrial fuel, as compared with lactate and pyruvate. As a consequence, we have now expanded the “reverse Warburg effect” to include ketones as a paracrine energy source (summarized in Fig. 8). In this scheme, we propose that the production of ketone bodies results from Acetyl-CoA derived from pyruvate, via pyruvate dehydrogenase (PDH) and not from the beta-oxidation of fatty acids, because Cav-1 (−/−) null mice have a defect in the beta-oxidation of fatty acids (reviewed in ref. 16). This would mechanistically explain why lactate does not accumulate. Interestingly, ACLY (a cytosolic enzyme) may also contribute to ketone production by converting citrate (a TCA metabolite) to Acetyl-CoA.
Figure 8.

Can ketones fuel tumor growth? Here, we propose that ketones produced in the tumor micro-enviroment (in cancer associated fibroblasts) could fuel the growth of adjacent epithelial cancer cells. Ketone-producing enzymes (in the fibroblasts) and ketone re-utilizing enzymes (in the epithelial cancer cells) are shown in bold. Transfer of ketones would be accomplished by monocarboxylate transporters (MCTs). Normally the same scheme is used by the liver (for ketone production) and the brain (for ketone re-utilization) during extreme fasting or starvation, to maintain neuronal function. Thus, the liver cells are the cancer fibroblasts and the epithelial cells are the neurons. Interestingly, Cav-1 (−/−) stromal cells and the tumor stroma both show a shift towards liver-specific gene and protein expression. For example, Cav-1 (−/−) stromal cells produce alpha-fetoprotein and albumin, as seen by proteomics.15 Alpha-fetoprotein expression has been been previously localized to cancer-associated fibroblasts in human breast cancers.80 The enzymes involved in ketone metabolism are as follows: ACYL, ATP citrate lyase (cytosolic); HMGCS1/2, 3-hydroxy-3-methylglutaryl-Coenzyme A synthase 1 (cytosolic)/2 (mitochondrial); HMGCL, 3-hydroxymethyl-3-methylglutaryl-Coenzyme A lyase; HMGCLL1, 3-hydroxymethyl-3-methylglutaryl-Coenzyme A lyase-like 1; BDH1/2, 3-hydroxybutyrate dehydrogenase, type 1 (mitochondrial)/type 2 (cytosolic); ACAT1/2, acetyl-Co-enzyme A acetyltransferase 1 (mitochondrial)/2 (cytosolic); OXCT1/2, 3-oxoacid CoA transferase 1 (mitochondrial)/2 (testis-specific). We propose that the production of ketone bodies results from Acetyl-CoA derived from pyruvate, via pyruvate dehydrogenase (PDH), and not from the beta-oxidation of fatty acids, because Cav-1 (−/−) null mice have a defect in the beta-oxidation of fatty acids (reviewed in ref. 16). this would also mechanistically explain why lactate does not accumulate. Interestingly, ACLY (a cytosolic enzyme) may also contribute to ketone production by converting citrate (a TCA metabolite) to Acetyl-CoA. This also results in the production of oxaloacetate, another TCA metabolite.
Thus, ADMA and ketone bodies (3-hydroxybutyrate/acetoacetate) levels could be used as diagnostic tools to assess patient outcome. ADMA and ketone levels could either be measured in patient serum/plasma, or directly determined from homogenates of fresh tumor tissue. We predict that high ADMA and ketone levels in cancer patient serum or human tumor samples will strictly correlate with poor clinical outcome. These simple diagnostic tests could be performed rapidly and quantitatively, allowing us to identify and monitor high-risk cancer patients, both at diagnosis and during therapy. They could also be used for treatment stratification.
There is also a new opportunity here for new drug development via targeted therapies. We envision that inhibition of ADMA production or ketone production/re-utilization should halt tumor growth, leading to tumor regression. As such, the enzymes associated with (1) ADMA production (all PRMT family members), (2) ketone production (ACLY, HMGCS1/2, HMGCL, HMGCLL1 and BDH1/2) and (3) ketone re-utilization (ACAT1/2 and OXCT1/2) should now all be considered as “druggable targets” for cancer chemotherapy and prevention. In fact, a number of known anti-oxidants have already been shown to have anti-tumor activity,50 such as N-acetyl cysteine (NAC), vitamin C, quercetin and curcumin. In this regard, NAC acts both as a free radical scavenger, and directly feeds into the glutathione pathway, increasing the amounts of cellular glutathione; NAC is the most promising anti-oxidant for inhibiting mitophagy.51 Furthermore, also anti-lysosomal drugs that inhibit autophagy, such as chloroquine, are known to have very significant anti-tumor activity.52 This may be due to their ability to inhibit autophagy in the fibroblastic stromal tumor compartment.53–56
Cancer connections with systemic sclerosis, diabetes and fasting.
Interestingly, a variety of human diseases are also associated with high levels of ADMA. One such disease is systemic sclerosis (Scc; scleroderma),57,58 and Scc patients have a higher incidence of cancer.59 Similarly, diabetic patients show both high serum levels of ADMA and ketones.60,61 Thus, our current observations may also explain the close and emerging association between diabetes and cancer susceptibility.62 A number of elegant studies have been carried out in mouse animal models to assess this association and chemical induction of diabetes in rats (with streptozocin) is sufficient to enhance tumor growth.63 Similarly, acute fasting in rodent animal models is also sufficient to dramatically increase tumor growth.64 Both of these experimental conditions (diabetes and fasting/starvation) are known to be highly autophagic and ketogenic and thus, are consistent with our current hypothesis that autophagy/ketone production fuels tumor growth and metastasis. Thus, the combination of ADMA and ketones may also play a crucial and causal role in promoting tumorigenesis, by providing oxidative stress and the simultaneous release of high-energy nutrients from the tumor micro-environment. Of course, this would be complemented by oxidative stress-induced autophagy/mitophagy in the tumor micro-environment, thus providing the necessary recycled chemical building blocks (amino acids, nucleotides, TCA cycle intermediates, etc.) in a paracrine fashion to cancer epithelial cells, to promote tumor growth.
In support of these ideas linking fasting/autophagy, with cancer susceptibility and diabetes, adipocytes from obese patients with type 2 diabetes show decreased mTOR signaling and substantially enhanced autophagy.65 Similarly, hypoxia, inflammation and michondrial dysfunction all inactivate mTOR signaling, leading to autophagy.
Can autophagy in the tumor micro-environment substitute for angiogenesis in promoting tumor growth?
The combination of oxidative stress, mitochondrial dysfunction and autophagy/mitophagy in cancer-associated fibroblasts could reduce the dependence of tumor growth and survival on neo-angiogenesis and vascularization. This may explain why many of the new angiogenesis inhibitors have not been as promising as expected in ongoing clinical trials, as our current observations suggest that a Cav-1 negative fibroblastic tumor micro-environment could actually subsume the role of tumor angiogenesis, without the need for increased tumor vascularization. This may be particularly relevant in the case of pancreatic cancers, which are a highly fibrotic class of relatively avascular tumors, and are exceptionally lethal.
In support of these assertions, we have now used genetically modified glycolytic fibroblasts that lack Cav-1 expression to assess their affects on human xenograft tumor growth using co-injections with a breast cancer cell line, namely MDA-MB-231 cells.66 In these xenograft models, the genetically modified fibroblasts, lacking Cav-1 expression, increased tumor weight by ∼4-fold and tumor volume by nearly 8-fold, without a measurable increase in tumor angiogenesis.66
Micro-RNA profiling: associations with oxidative stress and autophagy/mitophagy.
Here, we also performed micro-RNA (miR) profiling on Cav-1 (−/−) deficient stromal cells to gain mechanistic insight into how a loss of Cav-1 may drive oxidative stress, mitochondrial dysfunction and autophagy/mitophagy. Using this approach, we identified two miR species that were highly overexpressed in Cav-1 null stromal cells, namely miR-31 and miR-34c.
The upregulation of miR-34c is consistent with our results from both metabolomics and transcriptional profiling, as it is normally upregulated by oxidative stress, and is also associated with DNA damage and senescence, which are known down-stream effects of oxidative stress.35–37 Similarly, the upregulation of miR-31 provides a means for the transcriptional activation of HIF1α,18 which is known to induce both autophagy and mitophagy, and to inhibit mitochondrial biogenesis.38,39 The transcriptional activation of HIF1α by miR-31 is indirectly mediated by FIH-1 (factor inhibiting HIF), which is the direct target of miR-31.18 Thus, overexpression of miR-31 blocks the transcriptional expression of a HIF inhibitory factor, FIH-1, leading to HIF activation.18
The autophagic tumor stroma model of cancer metabolism: compartment-specific autophagy resolves the “autophagy paradox” in cancer chemotherapy.
Based on our current observations, we would like to propose a new model for cancer pathogenesis. In this model, tumor cells would activate autophagy in the tumor stromal compartment via paracrine mechanisms. Autophagy in the tumor stroma, especially in cancer-associated fibroblasts, would then provide epithelial cancer cells with a steady stream of recycled nutrients and energy-rich metabolites, which could then be re-used by cancer cells to drive increases in tumor growth and metastasis. Additional mesenchymal stem cells from the bone marrow could be recruited to the tumor and induced to undergo autophagy, to satisfy the tumor's appetite. The extension of this scheme from a local to a systemic phenomenon, could explain the onset of anorexia, cachexia, insulin-resistance and metabolic syndrome, all features that are known to be associated with chronic malignancy and this would provide the tumor with autophagic/catabolic-based nutrients (including ketone bodies)—from distant systemic sources. Tumor cells might even metastasize to the major sites of ketone production (the liver or adipose-tissue-rich bone marrow) or ketone re-utilization (the brain) in search of energy-rich metabolites.
In direct support of this model, we have recently shown that epithelial tumor cells induce autophagy in cancer-associated fibroblasts via oxidative stress, driving the autophagic/lysosomal degradation of Cav-1.67,68 Under these conditions, Cav-1 degradation in cancer-associated fibroblasts was inhibited by anti-oxidants (such as N-acetyl-cysteine) or autophagy/lysosomal inhibitors (such as chloroquine).67,68 Similarly, acute knock-down of Cav-1 in fibroblasts using an siRNA approach was sufficient to induce ROS production, oxidative stress and mitochondrial dysfunction.68 Thus, a loss of Cav-1 is both up-stream and downstream of oxidative stress and autophagy in cancer-associated fibroblasts.
This model also provides a rationale basis for designing new therapeutic intervention(s), as autophagy in the tumor stroma may be sustaining tumor growth. Thus, inhibition of autophagy in the tumor stroma would be expected to halt or reverse tumor growth. This could explain the effectiveness of known autophagy inhibitors as anti-tumor agents,52 such as chloroquine and 3-methyladenine. Conversel , induction of autophagy in epithelial cancer cells would also be expected to block or inhibit tumor growth. This idea would explain the anti-tumor activity of agents that activate autophagy, such as mTOR inhibitors.65 Thus, using this model, compounds that either systemically block or activate autophagy would both have the same net effect, which is to disrupt the metabolic coupling between the epithelial cancer cells and the tumor stromal fibroblasts (Fig. 9). This model directly resolves the long-lived “autophagy paradox,”69 that both systemic inhibition of autophagy and systemic stimulation of autophagy have the same net effect, which is to inhibit tumor growth. Of course this new model will require further experimental validation, but it does provide a new paradigm and rationale basis for drug development, driving new metabolic therapeutic interventions.
Figure 9.

The autophagic tumor stroma model of cancer: Resolving the autophagy paradox in cancer therapy. Here, we propose that autophagy/mitophagy (AM) in the tumor stroma may be sustaining tumor growth. The large black arrow signifies energy transfer (E.T.) from the stromal cancer associated fibroblasts (CAFs) to the epithelial cancer cells, via stromal autophagy/mitophagy. Thus, inhibition of autophagy in the tumor stroma would be expected to halt or reverse tumor growth. This could explain the effectiveness of known autophagy inhibitors as anti-tumor agents,52 such as chloroquine and 3-methyladenine (Upper part). Conversely, induction of autophagy in epithelial cancer cells would also be expected to block or inhibit tumor growth (Lower part). This idea would also explain the anti-tumor activity of agents that activate autophagy, such as mTOR inhibitors.65 Thus, using this model, compounds that either systemically block or activate autophagy would both have the same net effect, which is to disrupt the metabolic coupling between the epithelial cancer cells and the tumor stromal fibroblasts. This model directly resolves the long-lived “autophagy paradox”, that both systemic inhibition of autophagy and systemic stimulation of autophagy have the same net effect, which is to inhibit tumor growth. E.T., energy transfer; AM+, increased autophagy/mitophagy; AM−, decreased autophagy/mitophagy; Rx, therapy with autophagy promoters or inhibitors.
Clinical connections with malignancy: ADMA, ATG16L and SPARC.
Unfortunately, little is known about the association of ADMA and ketone production with malignancy. An extensive search of the literature revealed only one paper on ADMA and cancer. In this paper, the authors show that the serum levels of ADMA are indeed elevated in patients with hematological malignancies, as compared with normal healthy volunteers.70 Although the authors did not link their findings to clinical outcome, their results with ADMA are indeed consistent with our current findings based on our metabolomics analysis of a mouse model of a “lethal tumor micro-environment”.
Similarly, little is known about the role of autophagy in the tumor micro-environment. We identified only one paper looking at the possible role of an autophagic marker, namely ATG16L, as a candidate cancer biomarker in oral squamous cell cancers.71 Interestingly, these authors showed that the epithelial tumor cell levels of ATG16L did not correlate with any clinico-pathological variables. However, high levels of stromal ATG16L were associated with (1) the lympho-vascular invasion of tumor cells and (2) positive lymph node status—consistent with our proposed model. Unfortunately, no data on clinical outcome were presented. We also observed that ATG16L was transcriptionally overexpressed in Cav-1 (−/−) stromal cells and the tumor stroma of human breast cancer patients, and its expression was associated with tumor recurrence (see Tables 3 and 6). Thus, future studies are warranted to determine if high expression of autophagy-associated biomarkers in the tumor stroma are a general feature of human epithelial cancers and are associated with poor clinical outcome.
SPARC is a multi-functional extracellular matrix protein that is associated with the tumor stroma. Recently, SPARC overexpression has been shown to be sufficient to induce autophagy in cells in culture via the upregulation of cathepsin B.44 Similarly, we have previously demonstrated that Cav-1 (−/−) deficient stromal cells overexpress SPARC, as evidenced by both unbiased proteomic and genome-wide transcriptional profiling.15 Also, we have shown that the stromal expression of SPARC accurately predicts DCIS recurrence and/or progression.72 Taken together, these finding are consistent with the idea that a loss of stromal Cav-1 induces SPARC and autophagy in the tumor micro-environment, thereby promoting tumor progression in DCIS patients. In accordance with this idea, a loss of stromal Cav-1 is strongly associated with progression to invasive breast cancer in DCIS patients.9
Materials and Methods
Animals.
All animals were housed and maintained in a pathogen-free environment/barrier facility at the Kimmel Cancer Center at Thomas Jefferson University according to the guidelines of the National Institutes of Health. Mice were kept on a 12-hour light/dark cycle with ad libitum access to chow and water. Cav-1 (−/−) deficient mice were generated, as we previously described.73 All mice used for metabolomics analysis were in the FVB/N genetic background. Animal protocols used for this study were pre-approved by the institutional animal care and use committee.
Metabolomics analysis and metabolite identification.
Metabolomic profiling analysis was achieved through a contractual service agreement with Metabolon, Inc., (www.metabolon.com/) using the following protocol, as described in Lawton et al. (2008).74,75 Unbiased metabolic profiling technology based on sample extraction and mass spectrometry was applied to the (1) mammary fat pads and (2) lung tissue samples, from virgin female 5-month-old WT and Cav-1 (−/−) null mice (n = 6 tissues samples, for each organ type and for each genotype, for a total of 24 samples). To efficiently recover various metabolites, the sample preparation consisted of sequential organic and aqueous extractions. Four solvent extraction steps were used: 400 µl tridecanoic acid (2.5 mg/mL) in ethyl acetate:ethyl alcohol (1:1), 200 µl methanol, 200 µl methanol:H2O (3:1) and 200 µl dichloromethane:methanol (1:1). The resulting pooled extract was equally divided into a liquid chromatography (LC) fraction and a gas chromatography (GC) fraction. After chromatographic separation, a full-scan mass spectra was carried out to record all detectable ions present in the samples. In both the GC and LC methods, we used internal standards to calibrate retention times of metabolites across all of the samples in the study and for quality control on each instrument run. Known chemical structure metabolites were identified by matching the ions' chromatographic retention index and mass spectra fragmentation signatures, with Metabolon's reference library entries created using Metabolon's software. Each entry identified by this software is visually inspected with VPhil Software to confirm the acceptance of that metabolite in the study. Peptides were identified using standard tandem MS sequencing techniques.76 Missing values for a specific metabolite were assumed to have fallen below the limits of detection and were imputed with the observed minimum. Quantitative values were derived from integrated raw detector counts of the mass spectrometers. For the convenience of data visualization, the raw area counts for each biochemical were rescaled by dividing each sample's value by the median value for the specific biochemical. Statistical analysis of the data was performed using JMP (SAS, www.jmp.com), a commercial software package and “R” (cran.r-project.org/), which is a freely available, open-source software package. A log transform was applied to the observed relative concentrations for each biochemical because, in general, the variance increased as a function of a biochemical's average response. To account for multiple hypothesis testing, we estimated the false discovery rate77 with the q-value method.78 Data analyses were carried out by JMP (SAS Institute, Inc., Cary, NC) and R (R Foundation for Statistical Computing, Vienna, Austria). Significance was defined at p ≤ 0.05 and q ≤ 0.1.
Gene set overlap and p-value computation for venn diagrams.
We created four gene sets comprising genes related to autophagy, lysosomes, peroxisomes and telomeres. Each set was created by integrating information from two sources: (a) gene descriptions obtained from the ENSEMBL database, release 56 (www.ensembl.org) and (b) the Molecular Signatures Database (MsigDB79). For each gene set we searched the related keyword (i.e., autophagy, lysosome, peroxisome or telomere) in both the genes' descriptions in ENSEMBL and the gene sets' descriptions in MSigDB, thus including all relevant genes according to these databases. Then, we computed all the pair-wise overlaps along with their p-values between these four gene sets and:
genes overexpressed in tumor versus normal stroma (p value ≤ 0.05).17
genes overexpressed in Recurrence + versus Recurrence-stroma (p value ≤ 0.05).17
genes overexpressed in LN+ versus LN− stroma (p value ≤ 0.05).17
For each pair of gene sets X and Y, we computed the probability (p-value) that the observed overlap between sets X and Y is less than or equal to the overlap between set X and a randomly-chosen set of size equal to the size of set Y. This probability was calculated by applying the cumulative density function of the hypergeometric distribution on the size of set X, the size of set Y, the observed overlap between X and Y and the total number of available genes.
Micro RNA (miR) gene chip profiling.
The FlashTag™ Biotin RNA Labeling Kit (Genisphere, LLC, Hatfield, PA) was used, according to the manufacturer's protocol, to generate labeled miRNA molecules from 500 ng of total RNA by poly (A) tailing followed by ligation of the biotinylated signal molecule to the target RNA sample. Biotin labeled sample was hybridized to Affymetrix® GeneChip® miRNA Arrays (Affymetrix, Santa Clara, CA), Sanger miRBase V11. Hybridized chips were washed and stained using GeneChip® Fluidic Station 450 and scanned on an Affymetrix GeneChip® Scanner 3000, using Command Console Software 3.1. Affymetrix miRNA QCtool (V1.0.33.0) was used for data summarization and quality control. Background correction and normalization were done using Robust Multichip Average (RMA), baseline to median of all samples, analysis were performed with GeneSpring GX V 10.0 software (Agilent, Palo Alto, CA).
Western blot analysis.
Primary antibodies were obtained from the following commercial sources: caveolin-1 (N-20; sc-894; Santa Cruz Biotech); cathepsin B (FL-339; sc-13985; Santa Cruz Biotech); BNIP3 (ab10433; Abcam); beta-actin (clone AC15; A5441; Sigma). Mammary fat pads were surgically harvested from virgin female wild-type and Cav-1 (−/−) deficient mice. Then, the excised tissues were minced and placed in lysis buffer (10 mM Tris-HCl, pH 7.5, 150 mM NaCl, 1% Triton X-100, 60 mM octylglucoside), containing protease inhibitors (Roche Applied Science) and phosphatase inhibitors (Roche Applied Science). Samples were homogenized for 30 seconds and centrifuged at 13,000x g for 15 min at 4°C to remove insoluble debris. Protein concentrations were analyzed using the BCA reagent (Pierce). 30 µg of proteins were loaded and separated by SDS-PAGE and transferred onto a 0.2 µm nitrocellulose membrane. After blocking for 30 min in TBST (10 mM Tris-HCl pH 8.0, 150 mM NaCl, 0.05% Tween-20) with 3% BSA, the membranes were incubated with the primary antibody for 1 hour, washed and incubated for 30 min with horseradish peroxidase-conjugated secondary antibodies. The membranes were washed and incubated with an enhanced chemi-luminescence substrate (ECL; Thermo-Fisher Scientific).
Acknowledgements
M.P.L. and his laboratory were supported by grants from the NIH/NCI (R01-CA-080250; R01-CA-098779; R01-CA-120876; R01-AR-055660) and the Susan G. Komen Breast Cancer Foundation. F.S. was supported by grants from the Breast Cancer Alliance (BCA) and a Research Scholar Grant from the American Cancer Society (ACS). P.G.F. was supported by a grant from the W.W. Smith Charitable Trust and a Career Catalyst Award from the Susan G. Komen Breast Cancer Foundation. R.G.P. was supported by grants from the NIH/NCI (R01-CA-70896, R01-CA-75503, R01-CA-86072 and R01-CA-107382) and the Dr. Ralph and Marian C. Falk Medical Research Trust. The Kimmel Cancer Center was supported by the NIH/NCI Cancer Center Core grant P30-CA-56036 (to R.G.P.). Funds were also contributed by the Margaret Q. Landenberger Research Foundation (to M.P.L.). This project is funded, in part, under a grant with the Pennsylvania Department of Health (to M.P.L.). The Department specifically disclaims responsibility for any analyses, interpretations or conclusions. This work was also supported, in part, by a Centre grant in Manchester from Breakthrough Breast Cancer in the UK (to A.H.) and an Advanced ERC Grant from the European Research Council. Finally, we would also like to thank Danny Alexander and Jeff Pfohl (both from Metabolon, Inc., Durham, NC) for their expert technical advice and helpful suggestions.
Footnotes
Previously published online: www.landesbioscience.com/journals/cc/article/12721
Supplementary Material
References
- 1.Bissell MJ, Radisky D. Putting tumours in context. Nat Rev Cancer. 2001;1:46–54. doi: 10.1038/35094059. [DOI] [PMC free article] [PubMed] [Google Scholar]
- 2.Bissell MJ, Radisky DC, Rizki A, Weaver VM, Petersen OW. The organizing principle: microenvironmental influences in the normal and malignant breast. Differentiation. 2002;70:537–546. doi: 10.1046/j.1432-0436.2002.700907.x. [DOI] [PMC free article] [PubMed] [Google Scholar]
- 3.Ghajar CM, Meier R, Bissell MJ. Quis custodiet ipsos custodies: who watches the watchmen? Am J Pathol. 2009;174:1996–1999. doi: 10.2353/ajpath.2009.090363. [DOI] [PMC free article] [PubMed] [Google Scholar]
- 4.Ronnov-Jessen L, Bissell MJ. Breast cancer by proxy: can the microenvironment be both the cause and consequence? Trends Mol Med. 2009;15:5–13. doi: 10.1016/j.molmed.2008.11.001. [DOI] [PMC free article] [PubMed] [Google Scholar]
- 5.Dvorak HF. Tumors: wounds that do not heal. Similarities between tumor stroma generation and wound healing. N Engl J Med. 1986;315:1650–1659. doi: 10.1056/NEJM198612253152606. [DOI] [PubMed] [Google Scholar]
- 6.Mishra PJ, Humeniuk R, Medina DJ, Alexe G, Mesirov JP, Ganesan S, et al. Carcinoma-associated fibroblast-like differentiation of human mesenchymal stem cells. Cancer Res. 2008;68:4331–4339. doi: 10.1158/0008-5472.CAN-08-0943. [DOI] [PMC free article] [PubMed] [Google Scholar]
- 7.Mercier I, Casimiro MC, Wang C, Rosenberg AL, Quong J, Allen KG, et al. Human breast cancer-associated fibroblasts (CAFs) show Caveolin-1 downregulation and RB tumor suppressor functional inactivation: Implications for the response to hormonal therapy. Cancer Biol Ther. 2008;7:1212–1225. doi: 10.4161/cbt.7.8.6220. [DOI] [PMC free article] [PubMed] [Google Scholar]
- 8.Sotgia F, Del Galdo F, Casimiro MC, Bonuccelli G, Mercier I, Whitaker-Menezes D, et al. Caveolin-1-/- null mammary stromal fibroblasts share characteristics with human breast cancer-associated fibroblasts. Am J Pathol. 2009;174:746–761. doi: 10.2353/ajpath.2009.080658. [DOI] [PMC free article] [PubMed] [Google Scholar]
- 9.Witkiewicz AK, Dasgupta A, Sotgia F, Mercier I, Pestell RG, Sabel M, et al. An absence of stromal Caveolin-1 expression predicts early tumor recurrence and poor clinical outcome in human breast cancers. Am J Pathol. 2009;174:2023–2034. doi: 10.2353/ajpath.2009.080873. [DOI] [PMC free article] [PubMed] [Google Scholar]
- 10.Witkiewicz AK, Dasgupta A, Nguyen KH, Liu C, Kovatich AJ, Schwartz GF, et al. Stromal caveolin-1 levels predict early DCIS progression to invasive breast cancer. Cancer Biol Ther. 2009;8:1167–1175. doi: 10.4161/cbt.8.11.8874. [DOI] [PubMed] [Google Scholar]
- 11.Di Vizio D, Morello M, Sotgia F, Pestell RG, Freeman MR, Lisanti MP. An absence of stromal Caveolin-1 is associated with advanced prostate cancer, metastatic disease and epithelial Akt activation. Cell Cycle. 2009;8:2420–2424. doi: 10.4161/cc.8.15.9116. [DOI] [PMC free article] [PubMed] [Google Scholar]
- 12.Witkiewicz AK, Casimiro MC, Dasgupta A, Mercier I, Wang C, Bonuccelli G, et al. Towards a new “stromal-based” classification system for human breast cancer prognosis and therapy. Cell Cycle. 2009;8:1654–1658. doi: 10.4161/cc.8.11.8544. [DOI] [PubMed] [Google Scholar]
- 13.Sloan EK, Ciocca D, Pouliot N, Natoli A, Restall C, Henderson M, et al. Stromal cell expression of Caveolin-1 predicts outcome in breast cancer. Am J Pathol. 2009;174:2035–2043. doi: 10.2353/ajpath.2009.080924. [DOI] [PMC free article] [PubMed] [Google Scholar]
- 14.Witkiewicz AK, Dasgupta A, Sammons S, Er O, Potoczek MB, Guiles F, et al. Loss of stromal caveolin-1 expression predicts poor clinical outcome in triple negative and basal-like breast cancers. Cancer Biol Ther. 2010;10:133–143. doi: 10.4161/cbt.10.2.11983. [DOI] [PMC free article] [PubMed] [Google Scholar]
- 15.Pavlides S, Whitaker-Menezes D, Castello-Cros R, Flomenberg N, Witkiewicz AK, Frank PG, et al. The reverse Warburg effect: aerobic glycolysis in cancer associated fibroblasts and the tumor stroma. Cell Cycle. 2009;8:3984–4001. doi: 10.4161/cc.8.23.10238. [DOI] [PubMed] [Google Scholar]
- 16.Pavlides S, Tsirigos A, Vera I, Flomenberg N, Frank PG, Casimiro MC, et al. Loss of stromal Caveolin-1 leads to oxidative stress, mimics hypoxia and drives inflammation in the tumor microenvironment, conferring the “Reverse Warburg Effect”: A transcriptional informatics analysis with validation. Cell Cycle. 2010;9:2201–2219. doi: 10.4161/cc.9.11.11848. [DOI] [PubMed] [Google Scholar]
- 17.Pavlides S, Tsirigos A, Vera I, Flomenberg N, Frank PG, Casimiro MC, et al. Aging. Vol. 2. Albany NY: 2010. Transcriptional evidence for the “Reverse Warburg Effect” in human breast cancer tumor stroma and metastasis: similarities with oxidative stress, inflammation, Alzheimer's disease and “Neuron-Glia Metabolic Coupling”; pp. 185–199. [DOI] [PMC free article] [PubMed] [Google Scholar]
- 18.Liu CJ, Tsai MM, Hung PS, Kao SY, Liu TY, Wu KJ, et al. miR-31 ablates expression of the HIF regulatory factor FIH to activate the HIF pathway in head and neck carcinoma. Cancer Res. 2010;70:1635–1644. doi: 10.1158/0008-5472.CAN-09-2291. [DOI] [PubMed] [Google Scholar]
- 19.Teerlink T, Luo Z, Palm F, Wilcox CS. Cellular ADMA: Regulation and action. Pharmacol Res. 2009;60:448–460. doi: 10.1016/j.phrs.2009.08.002. [DOI] [PMC free article] [PubMed] [Google Scholar]
- 20.Yildirim AO, Bulau P, Zakrzewicz D, Kitowska KE, Weissmann N, Grimminger F, et al. Increased protein arginine methylation in chronic hypoxia: role of protein arginine methyltransferases. Am J Respir Cell Mol Biol. 2006;35:436–443. doi: 10.1165/rcmb.2006-0097OC. [DOI] [PubMed] [Google Scholar]
- 21.Sud N, Wells SM, Sharma S, Wiseman DA, Wilham J, Black SM. Asymmetric dimethylarginine inhibits HSP90 activity in pulmonary arterial endothelial cells: role of mitochondrial dysfunction. Am J Physiol Cell Physiol. 2008;294:1407–1418. doi: 10.1152/ajpcell.00384.2007. [DOI] [PMC free article] [PubMed] [Google Scholar]
- 22.Kennaway NG, Buist NR, Darley-Usmar VM, Papadimitriou A, Dimauro S, Kelley RI, et al. Lactic acidosis and mitochondrial myopathy associated with deficiency of several components of complex III of the respiratory chain. Pediatr Res. 1984;18:991–999. doi: 10.1203/00006450-198410000-00017. [DOI] [PubMed] [Google Scholar]
- 23.Robinson BH, McKay N, Goodyer P, Lancaster G. Defective intramitochondrial NADH oxidation in skin fibroblasts from an infant with fatal neonatal lacticacidemia. Am J Hum Genet. 1985;37:938–946. [PMC free article] [PubMed] [Google Scholar]
- 24.Campbell AM, Chan SH. Mitochondrial membrane cholesterol, the voltage dependent anion channel (VDAC) and the Warburg effect. J Bioenerg Biomembr. 2008;40:193–197. doi: 10.1007/s10863-008-9138-x. [DOI] [PubMed] [Google Scholar]
- 25.Bae SJ, Lee JS, Lee EK, Kim JM, Choi J, Heo HS, et al. The anti-apoptotic action of 5-hydroxyindole: protection of mitochondrial integrity. Biol Pharm Bull. 2010;33:550–555. doi: 10.1248/bpb.33.550. [DOI] [PubMed] [Google Scholar]
- 26.Dupuis L, Oudart H, Rene F, Gonzalez de Aguilar JL, Loeffler JP. Evidence for defective energy homeostasis in amyotrophic lateral sclerosis: benefit of a high-energy diet in a transgenic mouse model. Proc Natl Acad Sci USA. 2004;101:11159–11164. doi: 10.1073/pnas.0402026101. [DOI] [PMC free article] [PubMed] [Google Scholar]
- 27.Kumar A, Bala L, Kalita J, Misra UK, Singh RL, Khetrapal CL, Babu GN. Metabolomic analysis of serum by (1) H NMR spectroscopy in amyotrophic lateral sclerosis. Clin Chim Acta. 2010;411:563–567. doi: 10.1016/j.cca.2010.01.016. [DOI] [PubMed] [Google Scholar]
- 28.Morimoto N, Nagai M, Ohta Y, Miyazaki K, Kurata T, Morimoto M, et al. Increased autophagy in transgenic mice with a G93A mutant SOD1 gene. Brain Res. 2007;1167:112–117. doi: 10.1016/j.brainres.2007.06.045. [DOI] [PubMed] [Google Scholar]
- 29.Fornai F, Longone P, Ferrucci M, Lenzi P, Isidoro C, Ruggieri S, Paparelli A. Autophagy and amyotrophic lateral sclerosis: The multiple roles of lithium. Autophagy. 2008;4:527–530. doi: 10.4161/auto.5923. [DOI] [PubMed] [Google Scholar]
- 30.Gailit J, Marchese MJ, Kew RR, Gruber BL. The differentiation and function of myofibroblasts is regulated by mast cell mediators. J Invest Dermatol. 2001;117:1113–1119. doi: 10.1046/j.1523-1747.2001.15211.x. [DOI] [PubMed] [Google Scholar]
- 31.Gruber BL, Kew RR, Jelaska A, Marchese MJ, Garlick J, Ren S, et al. Human mast cells activate fibroblasts: tryptase is a fibrogenic factor stimulating collagen messenger ribonucleic acid synthesis and fibroblast chemotaxis. J Immunol. 1997;158:2310–2317. [PubMed] [Google Scholar]
- 32.Kanki T, Wang K, Baba M, Bartholomew CR, Lynch-Day MA, Du Z, et al. A genomic screen for yeast mutants defective in selective mitochondria autophagy. Mol Biol Cell. 2009;20:4730–4738. doi: 10.1091/mbc.E09-03-0225. [DOI] [PMC free article] [PubMed] [Google Scholar]
- 33.Kanki T, Wang K, Klionsky DJ. A genomic screen for yeast mutants defective in mitophagy. Autophagy. 2010;6:278–280. doi: 10.4161/auto.6.2.10901. [DOI] [PMC free article] [PubMed] [Google Scholar]
- 34.Finak G, Bertos N, Pepin F, Sadekova S, Souleimanova M, Zhao H, et al. Stromal gene expression predicts clinical outcome in breast cancer. Nat Med. 2008;14:518–527. doi: 10.1038/nm1764. [DOI] [PubMed] [Google Scholar]
- 35.Cannell IG, Kong YW, Johnston SJ, Chen ML, Collins HM, Dobbyn HC, et al. p38 MAPK/MK2-mediated induction of miR-34c following DNA damage prevents Myc-dependent DNA replication. Proc Natl Acad Sci USA. 2010;107:5375–5380. doi: 10.1073/pnas.0910015107. [DOI] [PMC free article] [PubMed] [Google Scholar]
- 36.He X, He L, Hannon GJ. The guardian's little helper: microRNAs in the p53 tumor suppressor network. Cancer Res. 2007;67:11099–11101. doi: 10.1158/0008-5472.CAN-07-2672. [DOI] [PubMed] [Google Scholar]
- 37.Lafferty-Whyte K, Cairney CJ, Jamieson NB, Oien KA, Keith WN. Pathway analysis of senescence-associated miRNA targets reveals common processes to different senescence induction mechanisms. Biochim Biophys Acta. 2009;1792:341–352. doi: 10.1016/j.bbadis.2009.02.003. [DOI] [PubMed] [Google Scholar]
- 38.Mazure NM, Pouyssegur J. Hypoxia-induced autophagy: cell death or cell survival? Curr Opin Cell Biol. 2010;22:177–180. doi: 10.1016/j.ceb.2009.11.015. [DOI] [PubMed] [Google Scholar]
- 39.Bellot G, Garcia-Medina R, Gounon P, Chiche J, Roux D, Pouyssegur J, Mazure NM. Hypoxia-induced autophagy is mediated through hypoxia-inducible factor induction of BNIP3 and BNIP3L via their BH3 domains. Mol Cell Biol. 2009;29:2570–2581. doi: 10.1128/MCB.00166-09. [DOI] [PMC free article] [PubMed] [Google Scholar]
- 40.Chan SY, Loscalzo J. MicroRNA-210: A unique and pleiotropic hypoxamir. Cell Cycle. 2010;9:1072–1083. doi: 10.4161/cc.9.6.11006. [DOI] [PMC free article] [PubMed] [Google Scholar]
- 41.Liu CJ, Kao SY, Tu HF, Tsai MM, Chang KW, Lin SC. Increase of microRNA miR-31 level in plasma could be a potential marker of oral cancer. Oral Dis. 2010;16:360–364. doi: 10.1111/j.1601-0825.2009.01646.x. [DOI] [PubMed] [Google Scholar]
- 42.Wang CJ, Zhou ZG, Wang L, Yang L, Zhou B, Gu J, et al. Clinicopathological significance of microRNA-31, -143 and -145 expression in colorectal cancer. Dis Markers. 2009;26:27–34. doi: 10.3233/DMA-2009-0601. [DOI] [PMC free article] [PubMed] [Google Scholar]
- 43.Ho AS, Huang X, Cao H, Christman-Skieller C, Bennewith K, Le QT, Koong AC. Circulating miR-210 as a novel hypoxia marker in pancreatic cancer. Transl Oncol. 2010;3:109–113. doi: 10.1593/tlo.09256. [DOI] [PMC free article] [PubMed] [Google Scholar]
- 44.Bhoopathi P, Chetty C, Gujrati M, Dinh DH, Rao JS, Lakka S. Cathepsin B facilitates autophagy-mediated apoptosis in SPARC overexpressed primitive neuroectodermal tumor cells. Cell Death Differ. 2010 doi: 10.1038/cdd.2010.28. In press. [DOI] [PMC free article] [PubMed] [Google Scholar]
- 45.Cahill GF, Jr, Veech RL. Ketoacids? Good medicine? Trans Am Clin Climatol Assoc. 2003;114:149–161. [PMC free article] [PubMed] [Google Scholar]
- 46.Veech RL. The therapeutic implications of ketone bodies: the effects of ketone bodies in pathological conditions: ketosis, ketogenic diet, redox states, insulin resistance and mitochondrial metabolism. Prostaglandins Leukot Essent Fatty Acids. 2004;70:309–319. doi: 10.1016/j.plefa.2003.09.007. [DOI] [PubMed] [Google Scholar]
- 47.Veech RL, Chance B, Kashiwaya Y, Lardy HA, Cahill GF., Jr Ketone bodies, potential therapeutic uses. IUBMB Life. 2001;51:241–247. doi: 10.1080/152165401753311780. [DOI] [PubMed] [Google Scholar]
- 48.Zou Z, Sasaguri S, Rajesh KG, Suzuki R. dl-3-Hydroxybutyrate administration prevents myocardial damage after coronary occlusion in rat hearts. Am J Physiol Heart Circ Physiol. 2002;283:1968–1974. doi: 10.1152/ajpheart.00250.2002. [DOI] [PubMed] [Google Scholar]
- 49.Puchowicz MA, Zechel JL, Valerio J, Emancipator DS, Xu K, Pundik S, et al. Neuroprotection in diet-induced ketotic rat brain after focal ischemia. J Cereb Blood Flow Metab. 2008;28:1907–1916. doi: 10.1038/jcbfm.2008.79. [DOI] [PMC free article] [PubMed] [Google Scholar]
- 50.Gao P, Zhang H, Dinavahi R, Li F, Xiang Y, Raman V, et al. HIF-dependent antitumorigenic effect of antioxidants in vivo. Cancer Cell. 2007;12:230–238. doi: 10.1016/j.ccr.2007.08.004. [DOI] [PMC free article] [PubMed] [Google Scholar]
- 51.Deffieu M, Bhatia-Kissova I, Salin B, Galinier A, Manon S, Camougrand N. Glutathione participates in the regulation of mitophagy in yeast. J Biol Chem. 2009;284:14828–14837. doi: 10.1074/jbc.M109.005181. [DOI] [PMC free article] [PubMed] [Google Scholar]
- 52.Hu C, Solomon VR, Ulibarri G, Lee H. The efficacy and selectivity of tumor cell killing by Akt inhibitors are substantially increased by chloroquine. Bioorg Med Chem. 2008;16:7888–7893. doi: 10.1016/j.bmc.2008.07.076. [DOI] [PubMed] [Google Scholar]
- 53.Hiraki K, Kimura I. Studies on the treatment of malignant tumors with fibroblast-inhibiting agent. I. Fibroblast-inhibiting action of chloroquine. Acta Med Okayama. 1963;17:231–238. [PubMed] [Google Scholar]
- 54.Hiraki K, Kimura I. Studies on the treatment of malignant tumors with fibroblast-inhibiting agent. II. Effects of chloroquine on animal tumors. Acta Med Okayama. 1963;17:239–252. [PubMed] [Google Scholar]
- 55.Hiraki K, Kimura I. Studies on the treatment of malignant tumors with fibroblast-inhibiting agent. IV. Effects of chloroquine on malignant lymphomas. Acta Med Okayama. 1964;18:87–92. [PubMed] [Google Scholar]
- 56.Hiraki K, Kimura I. Studies on the treatment of malignant tumors with fibroblast-inhibiting agent. 3. Effects of chloroquine on human cancers. Acta Med Okayama. 1964;18:71–85. [PubMed] [Google Scholar]
- 57.Dooley A, Gao B, Bradley N, Abraham DJ, Black CM, Jacobs M, Bruckdorfer KR. Abnormal nitric oxide metabolism in systemic sclerosis: increased levels of nitrated proteins and asymmetric dimethylarginine. Rheumatology (Oxford) 2006;45:676–684. doi: 10.1093/rheumatology/kei276. [DOI] [PubMed] [Google Scholar]
- 58.Dimitroulas T, Giannakoulas G, Sfetsios T, Karvounis H, Dimitroula H, Koliakos G, Settas L. Asymmetrical dimethylarginine in systemic sclerosis-related pulmonary arterial hypertension. Rheumatology (Oxford) 2008;47:1682–1685. doi: 10.1093/rheumatology/ken346. [DOI] [PubMed] [Google Scholar]
- 59.Marasini B, Conciato L, Belloli L, Massarotti M. Systemic sclerosis and cancer. Int J Immunopathol Pharmacol. 2009;22:573–578. doi: 10.1177/039463200902200303. [DOI] [PubMed] [Google Scholar]
- 60.Anderssohn M, Schwedhelm E, Luneburg N, Vasan RS, Boger RH. Asymmetric dimethylarginine as a mediator of vascular dysfunction and a marker of cardiovascular disease and mortality: an intriguing interaction with diabetes mellitus. Diab Vasc Dis Res. 2010;7:105–118. doi: 10.1177/1479164110366053. [DOI] [PubMed] [Google Scholar]
- 61.Pitocco D, Zaccardi F, Di Stasio E, Romitelli F, Martini F, Scaglione GL, et al. Role of asymmetric-dimethyl-L-arginine (ADMA) and nitrite/nitrate (NOx) in the pathogenesis of oxidative stress in female subjects with uncomplicated type 1 diabetes mellitus. Diabetes Res Clin Pract. 2009;86:173–176. doi: 10.1016/j.diabres.2009.09.019. [DOI] [PubMed] [Google Scholar]
- 62.Nicolucci A. Epidemiological aspects of neoplasms in diabetes. Acta Diabetol. 2010;47:87–95. doi: 10.1007/s00592-010-0187-3. [DOI] [PubMed] [Google Scholar]
- 63.Sauer LA, Dauchy RT. Stimulation of tumor growth in adult rats in vivo during acute streptozotocin-induced diabetes. Cancer Res. 1987;47:1756–1761. [PubMed] [Google Scholar]
- 64.Goodstein ML, Richtsmeier WJ, Sauer LA. The effect of an acute fast on human head and neck carcinoma xenograft. Growth effects on an ‘isolated tumor vascular pedicle’ in the nude rat. Arch Otolaryngol Head Neck Surg. 1993;119:897–902. doi: 10.1001/archotol.1993.01880200103015. [DOI] [PubMed] [Google Scholar]
- 65.Ost A, Svensson K, Ruishalme I, Brannmark C, Franck N, Krook H, et al. Attenuated mTOR signaling and enhanced autophagy in adipocytes from obese patients with type 2 diabetes. Mol Med. 2010;16:235–246. doi: 10.2119/molmed.2010.00023. [DOI] [PMC free article] [PubMed] [Google Scholar]
- 66.Migneco G, Whitaker-Menezes D, Chiavarina B, Castello-Cros R, Pavlides S, Pestell RG, et al. Glycolytic cancer associated fibroblasts promote breast cancer tumor growth, without a measurable increase in angiogenesis: Evidence for stromal-epithelial metabolic coupling. Cell Cycle. 2010;9:2412–2422. doi: 10.4161/cc.9.12.11989. [DOI] [PubMed] [Google Scholar]
- 67.Martinez-Outschoorn UE, Pavlides S, Whitaker-Menezes D, Daumer KM, Milliman JN, Chiavarina B, et al. Tumor cells induce the cancer associated fibroblast phenotype via caveolin-1 degradation: Implications for breast cancer and DCIS therapy with autophagy inhibitors. Cell Cycle. 2010;9:2423–2433. doi: 10.4161/cc.9.12.12048. [DOI] [PubMed] [Google Scholar]
- 68.Martinez-Outschoorn UE, Balliet R, Rivadeneira D, Chiavarina B, Pavlides S, Wang C, et al. Oxidative stress in cancer fibroblasts drives tumor-stroma coevolution: A new paradigm for understanding tumor metabolism, the field effect and genomic instability in cancer cells. Cell Cycle. 2010;9:3256–3276. doi: 10.4161/cc.9.16.12553. [DOI] [PMC free article] [PubMed] [Google Scholar]
- 69.Eisenberg-Lerner A, Kimchi A. The paradox of autophagy and its implication in cancer etiology and therapy. Apoptosis. 2009;14:376–391. doi: 10.1007/s10495-008-0307-5. [DOI] [PubMed] [Google Scholar]
- 70.Szuba A, Chachaj A, Wrobel T, Dzietczenia J, Mazur G, Antonowicz-Juchniewicz J, et al. Asymmetric dimethylarginine in hematological malignancies: a preliminary study. Leuk Lymphoma. 2008;49:2316–2320. doi: 10.1080/10428190802510323. [DOI] [PubMed] [Google Scholar]
- 71.Nomura H, Uzawa K, Yamano Y, Fushimi K, Ishigami T, Kouzu Y, et al. Overexpression and altered subcellular localization of autophagy-related 16-like 1 in human oral squamous-cell carcinoma: correlation with lymphovascular invasion and lymph-node metastasis. Hum Pathol. 2009;40:83–91. doi: 10.1016/j.humpath.2008.06.018. [DOI] [PubMed] [Google Scholar]
- 72.Witkiewicz AK, Freydin B, Chervoneva I, Potoczek MB, Rizzo W, Rui R, et al. Stromal CD10 and SPARC expression in ductal carcinoma in situ (DCIS) patients predicts disease recurrence. Cancer Biol Ther. 2010;10:391–396. doi: 10.4161/cbt.10.4.12449. [DOI] [PMC free article] [PubMed] [Google Scholar]
- 73.Razani B, Engelman JA, Wang XB, Schubert W, Zhang XL, Marks CB, et al. Caveolin-1 null mice are viable but show evidence of hyperproliferative and vascular abnormalities. J Biol Chem. 2001;276:38121–38138. doi: 10.1074/jbc.M105408200. [DOI] [PubMed] [Google Scholar]
- 74.Lawton KA, Berger A, Mitchell M, Milgram KE, Evans AM, Guo L, et al. Analysis of the adult human plasma metabolome. Pharmacogenomics. 2008;9:383–397. doi: 10.2217/14622416.9.4.383. [DOI] [PubMed] [Google Scholar]
- 75.Ryals J, Lawton K, Stevens D, Milburn M. Metabolon, Inc. Pharmacogenomics. 2007;8:863–866. doi: 10.2217/14622416.8.7.863. [DOI] [PubMed] [Google Scholar]
- 76.Kinter M, Shermann N, editors. Protein sequencing and identification using tandem mass spectrometry. New York: John Wiley & Sons Inc; 2000. [Google Scholar]
- 77.Benjamini Y, Hochberg Y. Controlling the false discovery rate: a practical and powerful approach to multiple testing. J R Soc Series B. 1995;57:289–300. [Google Scholar]
- 78.Storey JD, Tibshirani R. Statistical significance for genomewide studies. Proc Natl Acad Sci USA. 2003;100:9440–9445. doi: 10.1073/pnas.1530509100. [DOI] [PMC free article] [PubMed] [Google Scholar]
- 79.Subramanian A, Tamayo P, Mootha VK, Mukherjee S, Ebert BL, Gillette MA, et al. Gene set enrichment analysis: a knowledge-based approach for interpreting genome-wide expression profiles. Proc Natl Acad Sci USA. 2005;102:15545–15550. doi: 10.1073/pnas.0506580102. [DOI] [PMC free article] [PubMed] [Google Scholar]
- 80.Esteban C, Terrier P, Frayssinet C, Uriel J. Expression of the alpha-fetoprotein gene in human breast cancer. Tumour Biol. 1996;17:299–305. doi: 10.1159/000217992. [DOI] [PubMed] [Google Scholar]
Associated Data
This section collects any data citations, data availability statements, or supplementary materials included in this article.