Abstract
Our recent studies have mechanistically implicated a loss of stromal Cav-1 expression and HIF1α-activation in driving the cancer-associated fibroblast phenotype, through the paracrine production of nutrients via autophagy and aerobic glycolysis. However, it remains unknown if HIF1α-activation is sufficient to confer the cancer-associated fibroblast phenotype. To test this hypothesis directly, we stably-expressed activated HIF1α in fibroblasts and then examined their ability to promote tumor growth using a xenograft model employing human breast cancer cells (MDA-MB-231). Fibroblasts harboring activated HIF1α showed a dramatic reduction in Cav-1 levels and a shift towards aerobic glycolysis, as evidenced by a loss of mitochondrial activity, and an increase in lactate production. Activated HIF1α also induced BNIP3 and BNIP3L expression, markers for the autophagic destruction of mitochondria. Most importantly, fibroblasts expressing activated HIF1α increased tumor mass by ∼2-fold and tumor volume by ∼3-fold, without a significant increase in tumor angiogenesis. In this context, HIF1α also induced an increase in the lymph node metastasis of cancer cells. Similar results were obtained by driving NFκB activation in fibroblasts, another inducer of autophagy. Thus, activated HIF1α is sufficient to functionally confer the cancer-associated fibroblast phenotype. It is also known that HIF1α expression is required for the induction of autophagy in cancer cells. As such, we next directly expressed activated HIF1α in MDA-MB-231 cells and assessed its effect on tumor growth via xenograft analysis. Surprisingly, activated HIF1α in cancer cells dramatically suppressed tumor growth, resulting in a 2-fold reduction in tumor mass and a three-fold reduction in tumor volume. We conclude that HIF1α activation in different cell types can either promote or repress tumorigenesis. Based on these studies, we suggest that autophagy in cancer-associated fibroblasts promotes tumor growth via the paracrine production of recycled nutrients, which can directly “feed” cancer cells. Conversely, autophagy in cancer cells represses tumor growth via their “self-digestion.” Thus, we should consider that the activities of various known oncogenes and tumor-suppressors may be compartment and cell-type specific, and are not necessarily an intrinsic property of the molecule itself. As such, other “classic” oncogenes and tumor suppressors will have to be re-evaluated to determine their compartment specific effects on tumor growth and metastasis. Lastly, our results provide direct experimental support for the recently proposed “autophagic tumor stroma model of cancer.”
Key words: caveolin-1, autophagy, mitophagy, the Warburg effect, tumor stroma, hypoxia, HIF1A, NFκB, compartment-specific oncogenesis, cancer-associated fibroblasts
Introduction
The tumor micro-environment is becoming increasingly recognized as a determinant of tumor recurrence, metastasis and clinical outcome in cancer patients.1–5 In this regard, it appears that stromal fibroblasts (a.k.a., cancer-associated fibroblasts) play a major role due to their paracrine interactions with adjacent epithelial cancer cells.6 For example, cancer-associated fibroblasts can induce an EMT in normal epithelial cells,6 and via this mechanism, they can also promote cancer cell metastasis to distant organ sites.7,8
Recently, we have identified a loss of stromal Cav-1 as a new biomarker for predicting clinical outcome in human breast cancer patients.9 More specifically, we showed that a loss of stromal Cav-1 in cancer-associated fibroblasts is associated with a dramatic increase in early tumor recurrence, lymph node metastasis and tamoxifen-resistance, resulting in poor clinical outcome.9 Importantly, the predictive value of a loss of stromal Cav-1 was independent of epithelial markers status and was effective in all the known sub-types of invasive ductal carcinoma, including ER+, PR+, HER2+ and triple-negative patients.9 Similar results were also obtained with DCIS patients, where a loss of stromal Cav-1 was predictive of progression to invasive breast cancer.10 Finally, in human prostate cancer, a loss of stromal Cav-1 was strictly associated with advanced prostate cancer, and progression to metastatic disease (both lymph node and bone metastasis).11 Thus, a loss of stromal Cav-1 may be useful for identifying high-risk patients, suffering from a variety of different epithelial tumor types.5
Mechanistically, we have shown that the prognostic value of a loss of stromal Cav-1 may be related to tumor metabolism.12 Using Cav-1 (-/-) null mice as a model system, we isolated stromal cells and subjected them to proteomics analysis and genome-wide transcriptional profiling.12 In this proteomics analysis, Cav-1 (-/-) stromal cell showed the upregulation of: (1) eight myofibroblast markers (such as vimentin and calponin); (2) eight glycolytic enzymes (including PKM2 and LDHA); and (3) two markers of oxidative stress (namely catalase and peroxiredoxin-1).12 Based on these data, we proposed that a loss of stromal Cav-1 induces aerobic glycolysis (a.k.a., the Warburg effect) in cancer-associated fibroblasts, resulting in the stromal production of energy-rich metabolites (such as lactate and pyruvate). These energy-rich metabolites could then be transferred to adjacent epithelial cancer cells in a paracrine fashion and enter their TCA cycle, resulting in increased ATP production and thereby “fueling” tumor growth.12 We have termed this new concept the “reverse Warburg effect,”12 as Cav-1-deficient stromal cells would be fueling oxidative mitochondrial respiration in adjacent epithelial cancer cells. By performing an informatics analysis of the genome-wide profiling data generated via the analysis of Cav-1 (-/-) stromal cells, we have now proposed a model in which a loss of Cav-1 leads to oxidative stress, driving HIF-activation and NFκB-activation in these cells.13 Cav-1 is a natural endogenous inhibitor of all three NOS isoforms; thus, a loss of Cav-1 increases nitric oxide (NO) production in fibroblasts and mesenchymal stem cells.13 Increased NO production, in turn, leads to mitochondrial dysfunction and increased ROS production, thereby enhancing oxidative stress.13 Thus, a loss of Cav-1 in cancer-associated fibroblasts may drive tumor growth via oxidative stress and the stromal activation of HIF and NFκB.13 However, this hypothesis remains to be tested experimentally.
Using a novel co-culture system, employing stromal fibroblasts (hTERT-BJ1 cells) and a breast cancer cell line (MCF7 cells),14 we next reconstituted the paracrine interactions that may occur in the tumor micro-environment. In this system, MCF7 cancer cells induced ROS production and oxidative stress in adjacent fibroblasts,15 driving Cav-1 lysosomal degradation via autophagy,14 as well as the activation of HIF1α- and NFκB-driven gene transcription, as determined via luciferase-reporters expressed selectively in stromal fibroblasts.16 Using this system, we also presented novel evidence that an acute loss of Cav-1 is sufficient to induce oxidative stress, resulting in mitochondrial dysfunction and the removal of defective mitochondria by an autophagic process—leading to the onset of aerobic glycolysis.15 In addition, acute knock-down of Cav-1 in fibroblasts is sufficient to promote the induction and/or stabilization of HIF1α, as well as the upregulation of PKM2, a rate-limiting glycolytic enzyme which is sufficient to drive aerobic glycolysis.15 In this sense, a loss of stromal Cav-1 is both upstream and downstream of oxidative stress,15 which is a key initiator of the autophagic process. In support of this notion, prolonged exposure of fibroblasts to hypoxic conditions was sufficient to induce the downregulation of Cav-1 via autophagy, further implicating HIF-activation in this process.16 In this regard, hypoxia, HIF-activation and NFκB-activation are all sufficient to drive the onset of autophagy, providing a “feed-forward” mechanism for the autophagy-driven degradation of Cav-1. Thus, the induction of autophagy in cancer-associated fibroblasts would provide both energy-rich metabolites via aerobic glycolysis, as well as other recycled chemical building blocks (such as amino acids and nucleotides) via cellular catabolism.
However, it remains unknown if HIF1α- or NFκB-activation in cancer-associated fibroblasts is sufficient to drive Cav-1 downregulation and promote tumor growth. To address this issue, here we generated a panel of immortalized fibroblast cell lines expressing HIF1α (wild-type or mutationally-activated) or IKBKE, a known kinase activator of NFκB. Interestingly, the fibroblasts expressing activated HIF1α had the greatest capacity for promoting tumor growth. Similar results were obtained with fibroblasts expressing IKBKE. However, the ability of these fibroblast cell lines to promote tumor growth was not due to increased angiogenesis, as no significant increases in micro-vessel density were observed. Importantly, both of these fibroblast cell lines showed (1) a dramatic loss of Cav-1 expression and (2) overexpressed BNIP3L, a known hypoxia-induced marker of autophagy/mitophagy. Conversely, when we expressed activated HIF1α in breast cancer cells (MDA-MB-231), this significantly impeded tumor growth, resulting in a two-fold reduction in tumor mass and a three-fold reduction in tumor volume. Thus, we propose that the tumor promoter and tumor suppressor activity of HIF1α is cell-type- and compartment-specific, and may be due to its ability to functionally induce autophagy. In accordance with this idea, both fibroblasts and breast cancer cells expressing activated HIF1α showed the characteristic induction of autophagosomes, as visualized by immuno-staining with LC3 antibodies.
Results
Activated HIF1α is sufficient to downregulate Cav-1 expression in fibroblasts, via autophagic/lysosomal degradation.
Recently, we showed that hypoxia is sufficient to induce the loss of Cav-1 in cultured fibroblasts, via autophagy.16 However, it remains unknown whether HIF1-activation is indeed sufficient to induce a loss of Cav-1 expression. To address this issue, here we stably expressed wild-type and mutationally activated HIF1-alpha (HIF1α wt and mut) in immortalized fibroblasts, namely hTERT-BJ1 cells and then assessed the status of Cav-1 expression.
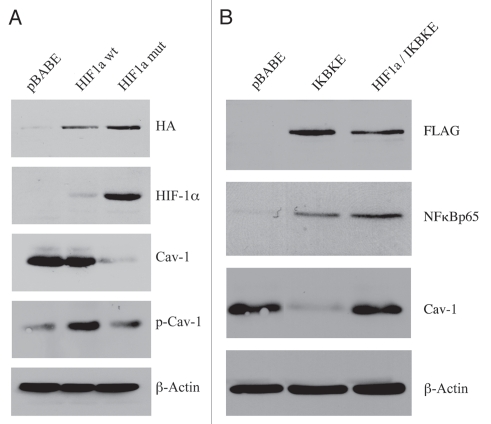
Figure 1A directly shows that the expression of wild-type HIF1α was not sufficient to downregulate Cav-1. However, we observed a near 2-fold increase in tyrosine-phosphorylated Cav-1 (pY14). Conversely, expression of activated HIF1α induced a dramatic reduction in total Cav-1 levels. In addition, fibroblasts harboring activated HIF1α also showed an increase in tyrosine-phosphorylated Cav-1, as compared with the total levels of Cav-1. As the tyrosine phosphorylation of Cav-1 has been previously associated with (1) oxidative-stress and (2) endocytic internalization of caveolae,17–19 we speculated that HIF1 activation may be sufficient to induce the tyrosine-phosphorylation of Cav-1, leading to its internalization and degradation by the lysosome. This is consistent with the idea that caveolae and Cav-1 are degraded by HIF-induced autophagy.
Figure 1.
Expression of activated HIF1a or IKBKE in fibroblasts downregulates Cav-1 protein expression. (A) Generating stable fibroblast cell lines expressing HIF1a. hTERT-BJ1 fibroblasts were transduced with retroviral vectors harboring HIF1a (wt, wild-type; or mut, mutationally activated) or the pBABE vector alone as a negative control. After selection for puromycin resistance, the “pool” was subjected to immuno-blot analysis with a battery of antibody probes. HIF1a expression was confirmed using antibodies directed against HIF1a, as well as the HA-epitope tag. Cav-1 expression was monitored with antibodies directed against total Cav-1 and tyrosine-phosphorylated Cav-1 (pY14). Note that activated HIF1a downregulates total Cav-1 levels, but increases the relative levels of phospho-Cav-1. In contrast, wild-type HIF1a only increases the levels of phospho-Cav-1. Immunoblotting with beta-actin is shown as a control for equal loading. (B) Generating stable fibroblast cell lines expressing IKBKE. hTERT-BJ1 fibroblasts were transduced with IKBKE, alone or in combination with activated HIF1a. See the Materials and Methods section for more details on how the double-transfectant was generated. IKBKE expression was confirmed using antibodies directed against NFκB (p65), as well as the FLAG-epitope tag. Cav-1 expression was monitored with antibodies directed against total Cav-1. Note that IKBKE downregulates total Cav-1 levels, but that co-expression of IKBKE and activated HIF1a reverts this phenotype. Immunoblotting with beta-actin is shown as a control for equal loading.
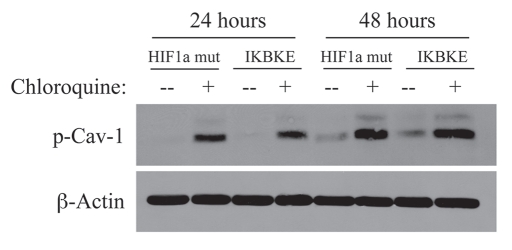
To test this hypothesis, we next incubated fibroblasts harboring activated HIF1α with chloroquine, a known inhibitor of lysosomal degradation and autophagy. As shown in Figure 2, treatment with chloroquine resulted in the accumulation of the tyrosine-phosphorylated form of Cav-1 as expected.
Figure 2.
Chloroquine rescues the expression of phospho-Cav-1 (pY14) in activated HIF1a and IKBKE transfected fibroblasts. hTERT-BJ1 fibroblasts recombinantly expressing activated HIF1a or IKBKE were incubated with chloroquine for 24 or 48 hours and then subjected to immunoblot analysis with antibodies directed against phospho-Cav-1 (pY14). Note that treatment with chloroquine rescues the expression of phospho-Cav-1 (pY14) in both fibroblast cell lines. Immunoblotting with beta-actin is shown as a control for equal loading.
NFκB activation also functions as an activator of autophagy.20 Thus, we stably overexpressed IKBKE (a kinase activator of NFκB signaling) in fibroblasts. NFκB was activated, as expected and Cav-1 protein levels were dramatically reduced, as predicted (Fig. 1B). In accordance with the NFκB-induced autophagic digestion of Cav-1, chloroquine treatment similarly resulted in the accumulation of tyrosine-phosphorylated Cav-1. Taken together, our results are consistent with a model in which the activation of autophagy (by hypoxia, HIF1α or NFκB) is sufficient to drive the lysosomal degradation of tyrosine-phosphorylated Cav-1.
Interestingly, the co-expression of both activated HIF1α and IKBKE was sufficient to revert this phenotype, restoring Cav-1 to normal levels (Fig. 1B). Thus, we have created a new model system in which we can drive the autophagic degradation of Cav-1 by activation of HIF1α or NFκB, and we can revert this phenotype by co-activation of both HIFa and NFκB in the same cell.
Activation of HIF1α in fibroblasts induces mitophagy.
Autophagy results in the degradation of many cell organelles, including mitochondria.21 Thus, we also assessed the status of mitochondria in fibroblasts stably expressing activated HIF1α. For this purpose, we determined the levels of mitochondrial enzymes associated with the respiratory chain.
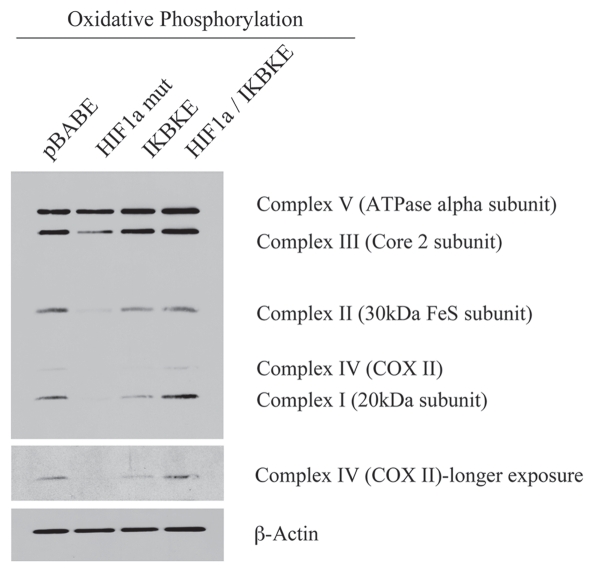
Figure 3 shows that the expression of activated HIF1α in fibroblasts significantly reduces the expression of mitochondrial complex I, II, III and IV. Similarly, the expression of IKBKE leads to reductions in mitochondrial complex I and IV. Remarkably, the co-expression of activated HIF1α and IKBKE reverts this phenotype, just as it restored the expression of Cav-1 (Fig. 1B). These results are consistent with the idea that activation of HIF1α in fibroblasts also results in mitophagy.
Figure 3.
Reductions in mitochondrial respiratory chain complexes in activated HIF1a and IKBKE transfected fibroblasts. To assess the status of the mitochondrial respiratory chain, fibroblast lysates were prepared and subjected to immunoblot analysis with a battery of antibodies directed against mitochondrial complex components (I–V). Note that expression of activated HIF1a reduces components of mitochondrial complex I, II, III and IV, while expression of IKBKE reduces components of complex I and IV. However, co-expression of activated HIF1a and IKBKE reverts this phenotype. Immunoblotting with beta-actin is shown as a control for equal loading.
BNIP3 and BNIP3L are close relatives, but they are separate genes with a similar function in targeting dysfunctional mitochondria for destruction by autophagy, a.k.a, mitophagy.22–24 To further assess the association between HIF1α activation and mitophagy, we next examined the expression of BNIP3 and BNIP3L, which are established markers of mitophagy.22,23 BNIP3 and BNIP3L specifically target mitochondria for degradation and their transcriptional expression is induced by HIF1α activation.22–24
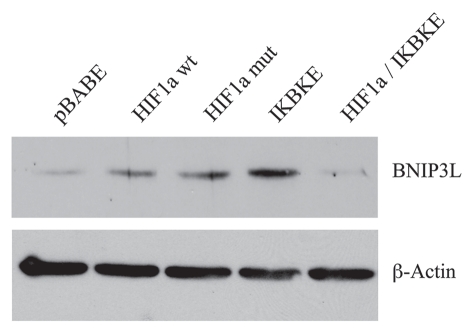
Figure 4 directly shows that the BNIP3L protein was strongly induced by the stable expression of HIF1α (wt or mutationally-activated) or IKBKE, as visualized by Western blot analysis. Conversely, co-expression of activated HIF1α and IKBKE reverted this phenotype, consistent with our results using Cav-1 and mitochondrial respiratory enzymes as markers.
Figure 4.
BNIP3L protein expression is strongly induced in HIF1a and IKBKE transfected fibroblasts. BNIP3L is a marker of mitochondrial autophagy, i.e., mitophagy, which is transcriptionally-induced by HIF1a activation. Note that expression of HIF1a (wild-type or mutationally-activated) or IKBKE induces BNIP3L expression. However, co-expression of activated HIF1a and IKBKE reverts this phenotype. Immunoblotting with beta-actin is shown as a control for equal loading.
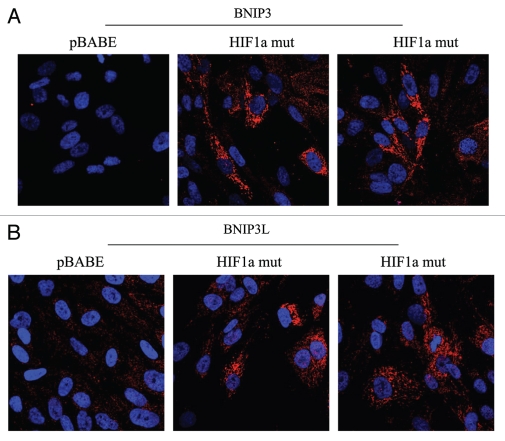
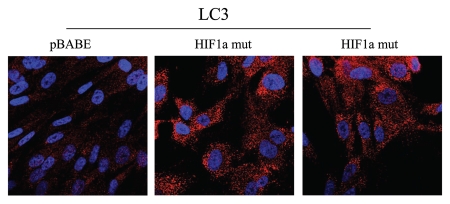
Figure 5 directly demonstrates that both BNIP3 and BNIP3L are highly expressed in fibroblasts harboring activated HIF1α, and that they assume a distinct morphological pattern, consistent with mitochondrial and/or autophagosomal localization. LC3 is another independent marker that is used for the visualization of autophagosomes.25 Similarly, LC3 immuno-staining yields a characteristic fluorescence pattern that is consistent with the autophagic phenotype (Fig. 6), in fibroblasts expressing activated HIF1α.
Figure 5.
Localization of mitophagy markers (BNIP3 and BNIP3L) in activated HIF1a transfected fibroblasts. BNIP3 and BNIP3L are two distinct genes which are markers of mitophagy, and are thought to be under the transcriptional control of HIF1a activation. Note that both BNIP3 (A) and BNIP3L (B) are upregulated in fibroblasts harboring activated HIF1a, as compared with the vector alone control (pBABE). Both show a morphological pattern that is consistent with mitochondrial and/or autophagosomal localization, as expected.
Figure 6.
Localization of LC3, an autophagy marker, in activated HIF1a transfected fibroblasts. LC3 is a well-established marker of autophagosomes. Note that LC3 immunostaining yields a characteristic fluorescence pattern that is consistent with the autophagic phenotype, in fibroblasts expressing activated HIF1a.
Activation of HIF1α induces aerobic glycolysis in fibroblasts.
To examine the phenotypic effects of a loss of functional mitochondria via autophagy, we next turned to proteomics and metabolism for validation studies. Tables 1 and 2 list the protein spots identified by mass spec from the proteomic analysis of fibroblasts harboring activated HIF1α and IKBKE. Interestingly, we see that numerous enzymes associated with glycolysis (PGK1, LDHA, TPI1, ENO1, ALDOA, GAPDH, PGAM1, PGM1 and PKM2) are elevated in fibroblasts expressing activated HIF1α, as well as myofibroblast markers and extracellular matrix proteins associated with activated fibroblasts. Similarly, IKBKE fibroblasts show a proteomic shift towards glycolysis and proteins associated with the stress response. Importantly, many of the proteins that were induced by activated HIF1α or IKBKE in fibroblasts are highly expressed in the tumor stroma of human breast cancer patients and are associated with tumor recurrence or metastasis (Suppl. Tables 1 and 2). Remarkably, hTERT is also overexpressed in the tumor stroma of human breast cancer patients and its expression is associated with tumor recurrence and metastasis (Suppl. Tables 1 and 2), supporting our choice of hTERT-immortalized fibroblasts for these studies.
Table 1.
Proteomic analysis of fibroblasts harboring activated HIF1α
| Fold change (HIF1α mut/pBABE) | Accession number | Protein spot number | |
| Glycolytic Enzymes and Metabolism Related Proteins | |||
| Phosphoglycerate kinase 1 (PGK1) | 2.01 | gi|48145549 | 29 |
| Phosphoglycerate kinase 1 (PGK1) | 1.72 | gi|48145549 | 28 |
| Lactate dehydrogenase A (LDHA) | 1.69 | gi|13786849 | 34 |
| Triosephosphate isomerase 1 (TPI1) | 1.67 | gi|999892 | 38 |
| Triosephosphate isomerase 1 (TPI1) | 1.31 | gi|4507645 | 37 |
| Enolase 1, (alpha) (ENO1) | 1.58 | gi|203282367 | 20 |
| Enolase 1, (alpha) (ENO1) | 1.55 | gi|4503571 | 21 |
| Enolase 1, (alpha) (ENO1) | 1.37 | gi|4503571 | 19 |
| Aldolase A, fructose-bisphosphate (ALDOA) | 1.49 | gi|4557305 | 30 |
| Glyceraldehyde-3-phosphate dehydrogenase (GAPDH) | 1.45 | gi|31645 | 33 |
| Glyceraldehyde-3-phosphate dehydrogenase (GAPDH) | 1.38 | gi|31645 | 43 |
| Glyceraldehyde-3-phosphate dehydrogenase (GAPDH) | 1.37 | gi|7669492 | 44 |
| Ubiquinol-cytochrome c reductase, (UQCRFS1) Rieske iron-sulfur polypeptide 1 | 1.43 | gi|54036562 | 39 |
| Phosphoglycerate mutase 1 (brain) (PGAM1) | 1.42 | gi|38566176 | 35 |
| Phosphoglycerate mutase 1 (brain) (PGAM1) | 1.39 | gi|38566176 | 36 |
| Pyruvate kinase, muscle isoform (PKM2) | 1.30 | gi|67464392 | 17 |
| Phosphoglucomutase 1 (PGM1) | 1.29 | gi|21361621 | 15 |
| Myofibroblast and Extracellular Matrix Associated Proteins | |||
| Fibronectin 1 (FN1) | 1.61 | gi|47132555 | 1 |
| Fibronectin 1 (FN1) | 1.57 | gi|47132555 | 2 |
| Procollagen-lysine, 2-oxoglutarate 5-dioxygenase 2 (PLOD2) | 1.49 | gi|33636742 | 5 |
| Procollagen-lysine, 2-oxoglutarate 5-dioxygenase 2 (PLOD2) | 1.44 | gi|33636742 | 6 |
| Collagen, type VI, alpha2 (COL6A2) | 1.30 | gi|115527062 | 3 |
| Caldesmon 1 (CALD1) | 1.48 | gi|15149465 | 9 |
| Caldesmon 1 (CALD1) | 1.38 | gi|119604234 | 10 |
| Leprecan-like 2 (LEP REL2)** | 1.45 | gi|28466983 | 4 |
| Prolyl 4-hydroxylase, alpha polypeptide I (P4HA1) | 1.35 | gi|190788 | 14 |
| Heterogeneous Nuclear Ribonucleoproteins and RNA Splicing | |||
| Heterogeneous nuclear ribonucleoprotein R (HNRNPR) | 1.41 | gi|5031755 | 8 |
| Heterogeneous nuclear ribonucleoprotein L (HNRNPL) | 1.36 | gi|211828181 | 16 |
| DEAH (Asp-Glu-Ala-His) box polypeptide 15 (DHX15) | 1.35 | gi|119613226 | 45 |
| Heterogeneous nuclear ribonucleoprotein K (HNRNPK) | 1.34 | gi|119583084 | 11 |
| Other | |||
| ERO1-like (S. cerevisiae) (ERO1L) oxidoreductase | 1.48 | gi|7657069 | 13 |
| Microtubule-associated protein, RP/EB family, member (MAPRE1) | 1.42 | gi|6912494 | 32 |
| S100 calcium binding protein A13 (S100A13) | 1.40 | gi|82407535 | 42 |
| Eukaryotic translation elongation factor 2 (EEF2) | 1.36 | gi|4503483 | 7 |
LEPREL2 belongs to a family of collagen prolyl hydroxylases required for proper collagen biosynthesis, folding and assembly.
Table 2.
Proteomic analysis of IKBKE-transfected fibroblasts
| Fold change (IKBKE/pBABE) | Accession number | Protein spot # | |
| Glycolytic Enzymes and Metabolism Related Proteins | |||
| Iron-sulfur cluster scaffold homolog (E. coli) (ISCU2) | 1.56 | gi|56699456 | 3 |
| Phosphorylase, glycogen; brain (PYGB) | 1.46 | gi|1172226 | 8 |
| Enolase 1, (alpha) (ENO1) | 1.41 | gi|4503571 | 30 |
| Enolase 1, (alpha) (ENO1) | 1.38 | gi|4503571 | 31 |
| Enolase 1, (alpha) (ENO1) | 1.33 | gi|4503571 | 29 |
| Uracil DNA-glycosylase/Glyceraldehyde-3-phosphate dehydrogenase; Aging-associated gene 9 protein (UDG/GAPDH) | 1.40 | gi|35053; gi|31645; gi|54303910 | 35 |
| Uracil DNA-glycosylase/Glyceraldehyde-3-phosphate dehydrogenase; Aging-associated gene 9 protein (UDG/GAPDH) | 1.38 | gi|35053; gi|31645; gi|54303910 | 33 |
| ATP citrate lyase (ACLY) | 1.37 | gi|38569421 | 4 |
| ATP citrate lyase (ACLY) | 1.37 | gi|38569421 | 5 |
| Pyruvate kinase, muscle isoform (PKM2) | 1.35 | gi|114657944 | 26 |
| Lactate dehydrogenase B (LDHB) | 1.33 | gi|49259209 | 32 |
| Proteins Associated with the Stress Response | |||
| Chaperonin containing TCP1, subunit 7 (eta) (CCT7) | 1.43 | gi|5453607 | 25 |
| Chaperonin containing TCP1, subunit 4 (delta) (CCT4) | 1.41 | gi|119620391 | 27 |
| Heat shock 60 kDa protein 1 (Chaperonin) (HSPD1) | 1.35 | gi|77702086 | 20 |
| Chaperonin containing TCP1, subunit 3 (gamma) (CCT3) | 1.34 | gi|14124984 | 23 |
| Chaperonin containing TCP1, subunit 5 (epsilon) (CCT5) | 1.33 | gi|24307939 | 21 |
| Chaperonin containing TCP1, subunit 6A (zeta1) (CCT6A) | 1.33 | gi|121490543 | 24 |
| T-complex protein 1 (TCP1) | 1.33 | gi|57863257 | 22 |
| Peroxiredoxin 4 (PRDX4) | 1.33 | gi|119587270 | 1 |
| Heterogeneous Nuclear Ribonucleoproteins, RNA Splicing and DNA Repair | |||
| XP (xeroderma pigmentosum) associated binding protein 2 (XAB2) | 1.47 | gi|14250630 | 37 |
| CCHC-type zinc finger, nucleic acid binding protein (CNBP) | 1.38 | gi|119599682 | 38 |
| Far upstream element (FUSE) binding protein 1 (FUBP1) | 1.35 | gi|119626762 | 17 |
| KH-type splicing regulatory protein (KHSRP); FUSE-binding protein 2 (FUBP2) | 1.35 | gi|2055427 | 9 |
| Heterogeneous nuclear ribonucleoprotein K (HNRNPK) | 1.37 | gi|55958547 | 19 |
| Tamoxifen-Resistance and Multi-Drug Resistance | |||
| Major vault protein (MVP) | 1.69 | gi|119600392 | 12 |
| Nucleolin (NCL) | 1.58 | gi|119591368 | 10 |
| Other | |||
| Integrin beta1 binding protein 1 (ITGB1BP1) | 1.80 | gi|119621396 | 11 |
| Actin related protein 2/3 complex subunit 2 (ARPC2) | 1.41 | gi|5031599 | 36 |
| Valosin-containing protein (VCP) | 1.40 | gi|6005942 | 14 |
| Staphylococcal nuclease and tudor domain containing 1 (SND1) | 1.39 | gi|77404397 | 6 |
| Eukaryotic translation elongation factor 2 (EEF2) | 1.37 | gi|4503483 | 7 |
| Vimentin (VIM) | 1.34 | gi|62414289 | 28 |
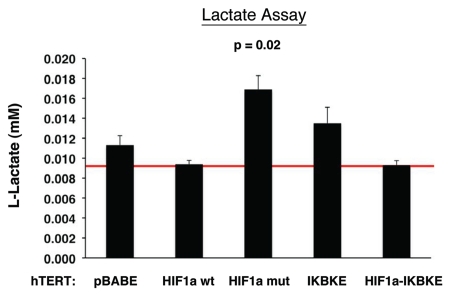
Next, we examined lactate accumulation in the tissue culture media derived from these cultured fibroblasts (Fig. 7). Note that fibroblasts expressing activated HIF1α showed the most lactate production (p ≤ 0.02). Similarly, fibroblasts harboring IKBKE also showed a trend toward increased lactate production, but did not reach statistical significance. Thus, these results provide functional support for our data from proteomics analysis and are consistent with mitophagy, as well as a shift towards aerobic glycolysis, in fibroblasts harboring activated HIF1α.
Figure 7.
Lactate accumulation in activated HIF1a transfected fibroblasts. hTE RT fibroblasts expressing HIF1a (wild-type or mutationally activated) or IKBKE were grown in tissue culture media. Then, the media was harvested and subjected to a biochemical analysis to determine its lactate content. Note that fibroblasts expressing activated HIF1a secrete the most lactate (p ≤ 0.02), as expected. Similarly, fibroblasts expressing IKBKE also secrete more lactate, although it did not reach statistical significance. A red line indicates baseline levels of lactate relative to HIF1a wild-type.
Fibroblasts harboring activated HIF1α promote the mitochondrial activity of adjacent cancer cells in a paracrine fashion.
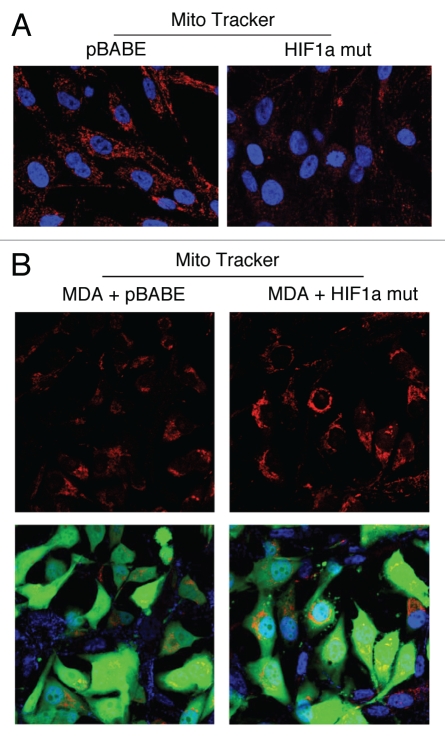
We next used MitoTracker as a probe to functionally validate the loss of respiratory chain components (complex I, II, III and IV) in fibroblasts harboring activated HIF1α. Figure 8A shows that mitochondrial activity is substantially decreased, as predicted. This is also consistent with the induction of mitophagy by activated HIF1α,24 and may simply represent a decrease in mitochondrial mass and/or function, driving a shift towards lactate production.26
Figure 8.
Fibroblasts harboring activated HIF1a promote mitochondrial activity in adjacent cancer cells. MitoTracker is used to visualize functional mitochondria with an active membrane potential. (A) Fibroblasts alone. Note that fibroblasts harboring activated HIF1a show reduced MitoTracker staining, consistent with a decrease in mitochondrial mass and/or membrane potential. (B) Co-culture. Note that fibroblasts harboring activated HIF1a increase the MitoTracker staining profile of adjacent MDA-MB-231 cancer cells, when they are co-cultured. MDA-MB-231 breast cancer cells are marked by GFP expression.
How does autophagy and aerobic glycolysis affect metabolism in adjacent cells? To address this issue, we co-cultured fibroblasts expressing activated HIF1α with a human breast cancer cell line, namely MDA-MB-231 cells. Mitochondrial metabolic activity, as visualized by MitoTracker staining, was increased in MDA-MB-231 cells co-cultured with fibroblasts expressing activated HIF1α (Fig. 8B). Thus, autophagy and aerobic glycolysis in fibroblasts may be providing nutrients (such as lactate) to the adjacent cancer cells.
Fibroblasts harboring activated HIF1α drive substantial increases in tumorigenesis and metastasis, without a significant increase in angiogenesis.
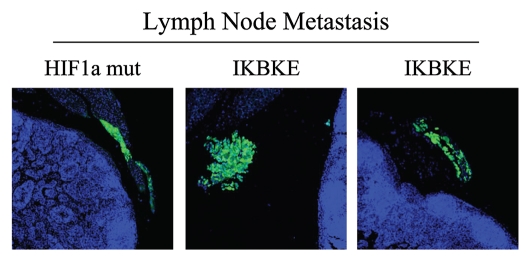
Having now phenotypically characterized the behavior of fibroblasts with activated HIF1α in cell culture, we next studied their effects on mammary tumorigenesis in vivo. For this purpose, these fibroblasts were co-injected with MDA-MB-231 cells in the flanks of nude mice. Importantly, none of the fibroblast cell lines we studied, including those expressing activated HIF1α, were tumorigenic in nude mice (Table 3). In contrast, nearly all the mice injected with MDA-MB-231 cells (with or without fibroblasts) developed tumors. However, the identification of lymph node involvement was strictly associated the expression of either HIF1α or IKBKE in fibroblasts (Table 3). As these MDA-MB-231 cells are GFP-tagged, we confirmed that these breast cancer cells had indeed metastasized to the peri-nodal fat by fluorescence microscopy (Fig. 9).
Table 3.
Tumor incidence: hTERT fibroblasts alone do not form tumors
| Cell line(s) injected | Tumor incidence (10 injections) |
| pBABE Fibroblasts Alone | 0/10; 0% |
| HIF1a wt Fibroblasts Alone | 0/10; 0% |
| HIF1a mut Fibroblasts Alone | 0/10; 0% |
| IKBKE Fibroblasts Alone | 0/10; 0% |
| HIF1a mut/IKBKE Fibroblasts Alone | 0/10; 0% |
| MDA-MB-231 Alone | 9/10; 90% |
| MDA-MB-231 + pBABE Fibroblasts | 10/10; 100% |
| MDA-MB-231 + HIF1a wt Fibroblasts* | 10/10; 100% |
| MDA-MB-231 + HIF1a mut Fibroblasts** | 10/10; 100% |
| MDA-MB-231 + IKBKE Fibroblasts*** | 10/10; 100% |
| MDA-MB-231 + HIF1a mut/IKBKE Fibroblasts** | 10/10; 100% |
An asterisk (*) indicates that 20% of the mice injected also showed local lymph node involvement. Asterisks (**) indicate that 60% of the mice injected also showed local lymph node involvement. Asterisks (***) indicate that 80% of the mice injected also showed local lymph node involvement.
Figure 9.
Visualization of peri-nodal metastatic breast cancer cells using GFP. Many of the mice co-injected with fibroblasts (GFP-negative) and cancer cells (GFP-positive) showed lymph node involvement, characterized by enlarged lymph nodes. To validate that this phenomenon was indeed related to lymph node metastasis, tissue sections were cut and used to detect the presence of GFP-positive cancer cells by GFP auto-fluorescence. Note the presence of GFP-positive cancer cells in the peri-nodal fat. Several examples are shown. Nuclei were stained with DAPI (blue color).
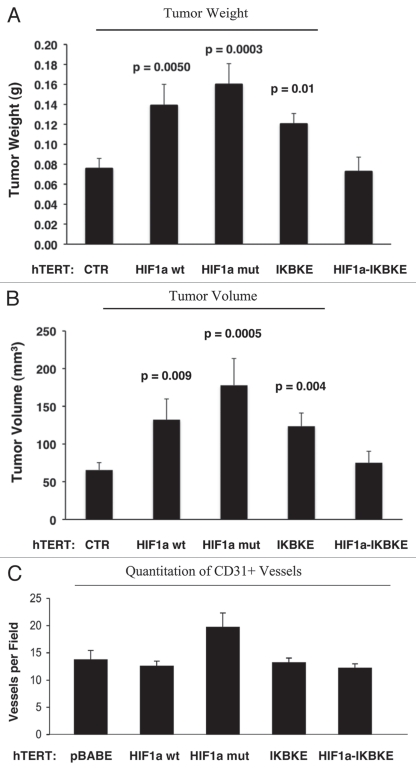
Figure 10A and B show that the expression of activated HIF1α in fibroblasts substantially promoted tumor growth, resulting in an ∼2-fold increase in tumor mass and a near three-fold increase in tumor volume. Similarly, fibroblasts expressing wild-type HIF1α or IKBKE also promoted tumor growth, but activated HIF1α showed the largest tumor promoting activity. Conversely, co-expression of activated HIF1α and IKBKE in fibroblasts abrogated this tumor promoting activity, as expected based on our in vitro phenotypic analysis, showing a reversion of their autophagic/mitophagic phenotype.
One possibility is that the observed increases in tumor growth were due to increased tumor angiogenesis. To test this hypothesis, frozen sections from the tumors were immunostained with anti-CD31 antibodies and vessel density was quantitated. Interestingly, no significant increases in vessel density were observed (Fig. 10C), suggesting that the tumor promoting effects of the transfected fibroblasts we observed were independent of angiogenesis.
Figure 10.
Fibroblasts harboring activated HIF1a increase breast cancer tumor growth, without a significant increase in angiogenesis: 4 weeks post-injection. (A and B) Quantitation of tumor mass and volume. Note that the expression of activated HIF1a in fibroblasts substantially promoted tumor growth, resulting in an ∼2-fold increase in tumor mass and a near 3-fold increase in tumor volume. Similarly, fibroblasts expressing wild-type HIF1a or IKBKE also promoted tumor growth, but activated HIF1a showed the largest tumor promoting activity. Conversely, co-expression of activated HIF1a and IKBKE in fibroblasts abrogated this tumor promoting activity, as expected based on our in vitro phenotypic analysis. p values are as shown. CTR, represents control. As a control, we injected MDA-MB-231 cells alone or in combination with hTERT-BJ1 fibroblasts transfected with the vector alone (pBABE). Since no significant differences between these 2 control groups were observed, they were combined (N = 19 tumors for this control group). For all the other experimental groups, N = 10 tumors per group. (C) Quantitation of tumor angiogenesis. Frozen sections from the tumors were cut and immuno-stained with anti-CD31 antibodies and vessel density was quantitated. Note that no significant increases in vessel density were observed, suggesting that the tumor promoting effects of the transfected fibroblasts we observe are independent of angiogenesis.
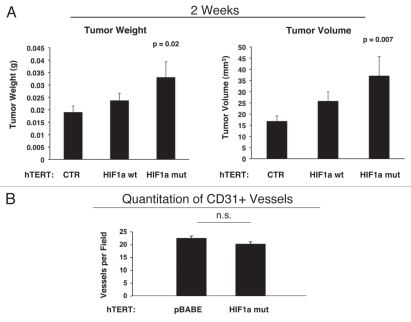
As these experiments were performed at 4 weeks post-tumor cell injection, one possibility is that there was a “spurt” in angiogenesis earlier in the time course, which subsided by 4 weeks. To address this issue, the tumor promoting effects of fibroblasts harboring activated HIF1α were also assessed at 2 weeks post tumor cell injection. Figure 11 shows that the tumor promoting effects of fibroblasts expressing activated HIF1α were still evident earlier on in tumorigenesis, but no significant increases in angiogenesis were observed.
Figure 11.
Fibroblasts harboring activated HIF1a increase breast cancer tumor growth: 2 weeks post-injection. The tumor promoting effects of fibroblasts harboring activated HIF1a were also assessed at 2 weeks post tumor cell injection. CTR, represents control. As a control, we injected MDA-MB-231 cells alone or in combination with hTERT-BJ1 fibroblasts transfected with the vector alone (pBABE). Since no significant differences between these 2 control groups were observed, they were combined (N = 20 tumors for this control group). For all the other experimental groups, N = 10 tumors per group. Note that the tumor promoting effects of fibroblasts expressing activated HIF1a are still evident earlier on in tumorigenesis, with significant increases in tumor mass and volume (A), but no significant increases in angiogenesis were observed (B). p values are as shown. n.s., not significant.
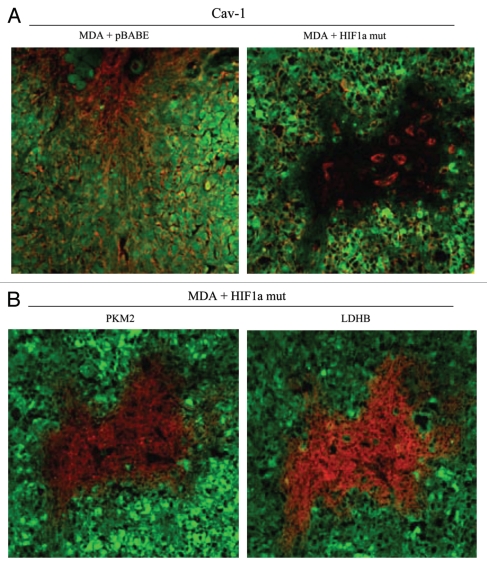
We also assessed whether expression of activated HIF1α in fibroblasts results in mammary tumors with a Cav-1 negative fibroblastic stromal compartment. For this purpose, consecutive frozen sections were cut from mammary tumors that were grown with fibroblasts expressing activated HIF1α. Figure 12 shows that Cav-1 expression is substantially reduced in the stromal compartment of these tumors, but is selectively retained in the micro-vasculature (endothelial cells), exactly as is observed in human breast cancers in vivo. The presence of these Cav-1 negative fibroblasts was confirmed in consecutive sections by employing antibodies directed against glycolytic enzymes, such as PKM2 and LDHB. Note that PKM2 and LDHB immunostaining (lower parts) nicely coincides with the Cav-1 negative stromal area in these MDA-MB-231 tumor tissue sections and does not significantly overlap with the tumor cells which are marked by GFP (green fluorescence).
Figure 12.
Activated HIF1a downregulates Cav-1 in the tumor stromal compartment: Stromal co-localization with PKM2 and LDHB. (A) Cav-1 immunostaining. To assess whether expression of activated HIF1a in fibroblasts results in mammary tumors with a Cav-1 negative fibroblastic stromal compartment, consecutive frozen sections were cut from mammary tumors that were grown with fibroblasts expressing activated HIF1a. Note that Cav-1 expression is substantially reduced in the stromal compartment of these tumors, but is selectively retained in the micro-vasculature (endothelial cells), exactly as is observed in human breast cancers in vivo. Tumor cells are marked by GFP (green fluorescence). (B) PKM2 and LDHB immunostaining. The presence of these Cav-1 negative fibroblasts was confirmed in consecutive sections (compare with part A, shown at right) by employing antibodies directed against glycolytic enzymes, such as PKM2 and LDHB. Note that PKM2 and LDHB immuno-staining nicely coincides with the Cav-1 negative stromal area in these MDA-MB-231 tumor tissue sections, and does not significantly overlap with the tumor cells which are marked by GFP (green fluorescence).
Expression of activated HIF1α in human breast cancer cells induces autophagy and dramatically retards tumor growth.
To study the possible compartment-specific effects of HIF1α activation on breast cancer tumor growth, we also directly expressed HIF1α (wt or mutationally activated) in MDA-MB-231 cells. We hypothesized that HIF1α expression in cancer cells would induce autophagy and retard tumor growth, due to the “self-digestion” of the tumor cells.
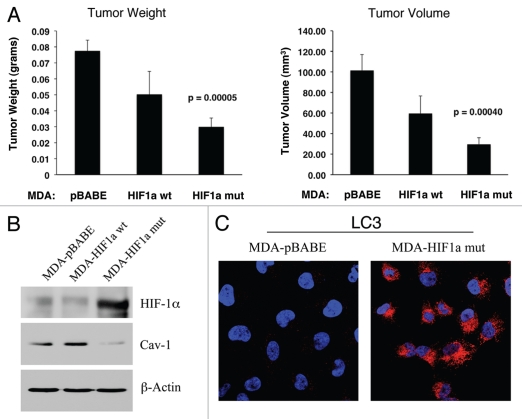
To test this hypothesis directly, MDA-MB-231 cells were injected into the flanks of nude mice. Two-weeks post-injection, tumors were harvested. Figure 13A shows that the expression of activated HIF1α in MDA-MB-231 tumor cells significantly retards tumor growth, resulting in >2-fold reduction in tumor mass and a >3-fold reduction in tumor volume.
Figure 13.
Expression of activated HIF1α in human breast cancer cells suppresses tumor growth and induces autophagy. (A) Quantitation of tumor mass and volume. We hypothesized that HIF1a expression in cancer cells would retard tumor growth, due to the “self-digestion” of the tumor cells. To test this hypothesis, MDA-MB-231 cells were injected into the flanks of nude mice. Two-weeks post-injection, tumors were harvested. Note that the expression of activated HIF1a in MDA-MB-231 tumor cells significantly retards tumor growth, resulting in >2-fold reduction in tumor mass and a >3-fold reduction in tumor volume. p values are as shown. For all the experimental groups, N = 10 tumors per group. (B) Activated HIF1α in human breast cancer cells downregulates Cav-1 protein expression. To study the possible compartment-specific effects of HIF1a activation on breast cancer tumor growth, we also directly expressed HIF1a (wt or mutationally activated) in MDA-MB-231 cells. Cav-1 expression was monitored with antibodies directed against total Cav-1. Note that activated HIF1a downregulates total Cav-1 levels. Immunoblotting with beta-actin is shown as a control for equal loading. (C) Localization of LC3, an autophagy marker, in activated HIF1α transfected breast cancer cells. LC3 is a well-established marker of autophagy. Note that LC3 immuno-staining yields a characteristic fluorescence pattern that is consistent with the autophagic phenotype, in human breast cancer cells expressing activated HIF1a.
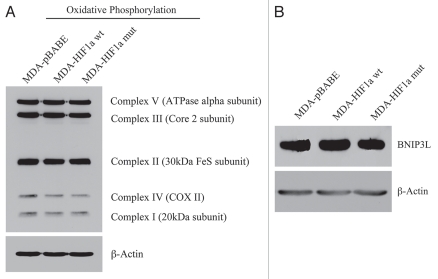
Mechanistically, we believe that this is due to the HIF1α-mediated induction of autophagy in the tumor cells. In support of this hypothesis, we observe that expression of activated HIF1α dramatically downregulates Cav-1 expression (Fig. 13B), which we have shown is a marker for autophagy in fibroblasts (see Figs. 1 and 2). In addition, we also see the characteristic upregulation of LC3-positive immuno-staining of autophagosomes in MDA-MB-231 cells expressing activated HIF1α (Fig. 13C). However, no HIF1α-induced changes in the levels of BNIP3L or mitochondrial respiratory chain complexes were observed (Fig. 14A and B), suggesting that mitophagy is not constitutively activated in these cancer cells.
Figure 14.
Activated HIF1a in Human Breast Cancer Cells Does Not Appear to Induce Mitophagy. (A) Mitochondrial respiratory complexes. To assess the status of the mitochondrial respiratory chain, breast cancer cell lysates were prepared and subjected to immunoblot analysis with a battery of antibodies directed against mitochondrial complex components (I–V). Note that expression of activated HIF1a does not affect components of mitochondrial complexes I–V. Immunoblotting with beta-actin is shown as a control for equal loading. (B) BNIP3L expression. Note that expression of HIF1a (wild-type or mutationally-activated) does not affect BNIP3L expression. Immunoblotting with beta-actin is shown as a control for equal loading.
Thus, we conclude that the tumor-promoting and tumor-suppressing effects of activated HIF1α are both compartment- and cell-type specific and are not an intrinsic property of the molecule itself. Thus, other “classic” oncogenes and tumor suppressors will have to be re-evaluated to determine their compartment specific effects on tumor growth and metastasis.
Discussion
Role of HIF1α, NFκB and autophagy in compartment-specific oncogenesis.
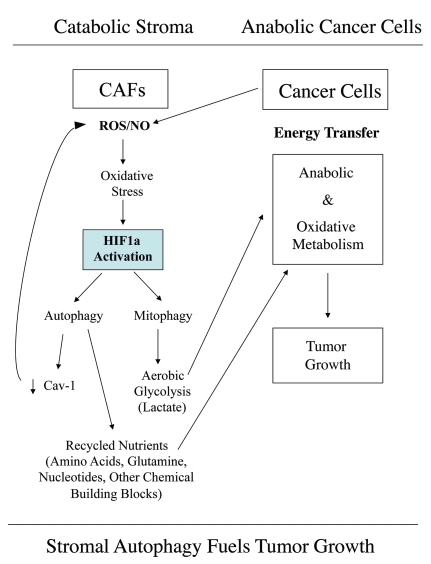
Here, we have used a compartment-specific approach to dissect the role of HIF1α activation in the pathogenesis of breast cancer. More specifically, we show that activated HIF1α functions as a tumor promoter in cancer-associated fibroblasts. In striking contrast, we demonstrate that activated HIF1α functions as a tumor suppressor in breast cancer cells. We present evidence that the compartment-specificity of HIF1α may be related to the induction of autophagy in a given cell type. This provides a new model for understanding the complex role of autophagy in tumorigenesis and metastasis (See Fig. 15).
Figure 15.
Autophagic cancer associated fibroblasts promote tumor growth, via the paracrine production of recycled nutrients. Previously, we demonstrated that cancer cells induce oxidative stress in adjacent fibroblasts, thereby conferring an autophagic cancer associated fibroblast (CAF) phenotype. This results in the autophagic destruction of of caveolae (Cav-1) and mitochondria, which produces recycled nutrients via aerobic glycolycis (such as lactate) that can then be transferred to cancer cells, to stimulate tumorigenesis, via oxidative phosphorylation (“the reverse Warburg effect”). Similarly, loss of stromal Cav-1 is sufficient to promote more oxidative stress, via increased NO production and the resulting mitochondrial dysfunction.13,15 Here, we show that we can mimic this process simply by overexpressing activated HIF1a (highlighted in blue) in the stromal fibroblast compartment. Similar results were obtained with NFκB-activation, which also is sufficient to drive the induction of autophagy/mitophagy. Thus, we suggest that catabolism in the fibroblasts “fuels” the anabolic growth of adjacent epithelial cancer cells, via “recycled” nutrients. ROS, reactive oxygen species; NO, nitric oxide.
Previously, we demonstrated that a loss of stromal Cav-1 is a powerful, single independent, biomarker for predicting clinical outcome in human breast cancer patients.9 A loss of stromal Cav-1 is associated with tumor recurrence, metastasis and drug-resistance, conferring poor clinical outcome in human breast cancer patients.9 For example, in triple-negative breast cancer patients with high stromal Cav-1, their 5-year survival is >75%.27 However, the same patient population with low stromal Cav-1 has a 5-year survival rate of <10%.27 Thus, a loss of stromal Cav-1 can now be used to identify high-risk patients at diagnosis and for treatment stratification employing more aggressive therapies.5
To mechanistically understand the powerful prognostic value of a loss of stromal Cav-1, we turned to Cav-1 (-/-) null mice as a model for a Cav-1-deficient tumor stroma.12 Proteomic and transcriptional profiling of Cav-1 (-/-) stromal cells revealed that a loss of Cav-1 in this cellular context results in HIF1α- and NFκB-target gene activation and a functional shift towards the expression of enzymes associated with aerobic glycolysis.12,13 Moreover, co-culture studies employing fibroblasts and MCF7 cells revealed that epithelial cancer cells transcriptionally activate HIF1α- and NFκB-luciferase reporters in adjacent stromal fibroblasts, co-incident with a loss of stromal Cav-1 expression.16 Under hypoxic conditions or conditions that mimic hypoxic stress, via the pharmacological induction of HIF1α, Cav-1 is dramatically downregulated in fibroblasts.16 Since both anti-oxidants and lysosomal inhibitors effectively block the cancer cell-induced downregulation of Cav-1,15 we have proposed that oxidative stress, which drives the activation of both HIF1α and NFκB, leads to the autophagic degradation of caveolae and Cav-1 via a lysosomal-based mechanism.15 In addition, acute knockdown of Cav-1 in fibroblasts using an siRNA approach is sufficient to induce ROS production and oxidative stress.15 Thus, it appears that Cav-1 downregulation is both upstream and down-stream of the activation of HIF1α and NFκB,13 as the loss of Cav-1 provides a feed-forward mechanism for generating more oxidative stress.15
Here, we set out to test the hypothesis that we could phenocopy the tumor promoting effects of a loss of stromal Cav-1, by using its down-stream targets, namely HIF1α and NFκB. Previously, using a mouse xenograft model, we have shown that stromal fibroblasts lacking Cav-1 have the ability to promote an ∼2.5-fold increase in MDA-MB-231 tumor growth.28 We have attributed this growth promoting activity to the induction of the “Warburg effect” in Cav-1-deficient cells, resulting in a glycolytic fibroblast phenotype.28 We proposed that energy-rich metabolites (such as lactate and pyruvate) would be secreted by these glycolytic cancer-associated fibroblasts, so that they may enter the TCA cycle and undergo oxidative metabolism in adjacent cancer cells.28 Here, we present clear evidence to support this hypothesis, as fibroblasts harboring activated HIF1α undergo aerobic glycolysis and produce more lactate. Co-culture of these HIF1α-expressing fibroblasts increases mitochondrial activity in adjacent cancer cells, as visualized by MitoTracker staining. We believe that this stromal-epithelial metabolic coupling could provide the energy necessary to fuel increased tumor growth. In accordance with this hypothesis, fibroblasts expressing activated HIF1α dramatically increased tumor growth, resulting in a 2-fold increase in tumor mass and a 3-fold increase in tumor volume. Similar results were obtained with fibroblasts expressing IKBKE, which is known to activate NFκB. Hypoxic/glycolytic cancer epithelial cells29 may also perform a similar function as autophagic/glycolytic fibroblasts, by providing energy-rich metabolites in a paracrine fashion to cancer cells which are using oxidative mitochondrial metabolism.30 In this regard, we have recently shown that the systemic administration of energy-rich metabolites, such as ketones (3-hydroxy-butyrate) and L-lactate, dramatically promotes both breast cancer tumor growth and metastasis, using MDA-MB-231 cells.30
Activation of HIF1α and/or the IKK complex are sufficient to induce autophagy.20,22,23 Interestingly, fibroblasts expressing either activated HIF1α or IKBKE showed a dramatic loss of Cav-1 protein expression, consistent with its known degradation by autophagy. Using established markers of autophagy/mitophagy, such as BNIP3, BNIP3L and LC3, we further validated the idea that fibroblasts expressing HIF1α or IKBKE undergo mitophagy. Similarly, these fibroblasts also showed the downregulation of mitochondrial respiratory chain components, consistent with either mitophagy or a reduction in mitochondrial biogenesis. Thus, the induction of autophagy/mitophagy in fibroblasts provides a common mechanism for acutely eliminating both Cav-1 expression and functional mitochondria, explaining the association of a loss of stromal Cav-1 with a shift towards aerobic glycolysis in stromal cells. Importantly, the induction of autophagy in cancer-associated fibroblasts would provide both energy-rich metabolites via aerobic glycolysis, as well as other recycled chemical building blocks (such as amino acids and nucleotides) via cellular catabolism. As we do not see any significant increases in angiogenesis in our model system, it appears that autophagic glycolytic fibroblasts can promote tumor growth independently of angiogenesis. This may provide tumors with an escape mechanism during anti-angiogenic therapy, explaining why many angiogenesis inhibitors have failed to provide significant clinical benefit in recent therapeutic trials.
Although autophagy in cancer-associated fibroblasts would be expected to provide nutrients for adjacent cancer cells, thereby fueling tumor growth, we hypothesized that autophagy in cancer cells should inhibit tumor growth. We speculated that autophagy in cancer cells should result in their “self-digestion,” effectively reducing tumor growth.
To test this hypothesis, we next expressed activated HIF1α directly in MDA-MB-231 cells, an established breast cancer cell line that we used for our xenograft analyses in combination with fibroblasts. As predicted, expression of activated HIF1α in these breast cancer cells resulted in the induction of autophagy, as evidenced by strong LC3 staining of autophagosomes. Similarly, in accordance with the idea that Cav-1 is degraded by autophagy, breast cancer cells expressing activated HIF1α showed a substantial reduction in Cav-1 expression. However, no changes in mitochondrial status were observed. This is consistent with the previously published notion that the induction of autophagy does not necessarily induce mitophagy; thus, under our experimental conditions autophagy and mitophagy were uncoupled in MDA-MB-231 cancer cells. Most importantly, expression of activated HIF1α in MDA-MB-231 cells resulted in a 2-fold reduction in tumor mass and a 3-fold reduction in tumor volume. This is consistent with the idea that the induction of autophagy in the tumor compartment may inhibit or block tumor growth.
Although many additional experiments will be required to precisely understand the role of autophagy in the tumor stromal compartment, our current results provide a new “framework” or “working model” for understanding how autophagic glycolytic fibroblasts could fuel tumor growth. Conversely, activation of autophagy in cancer cells could be used to therapeutically target this cell population.
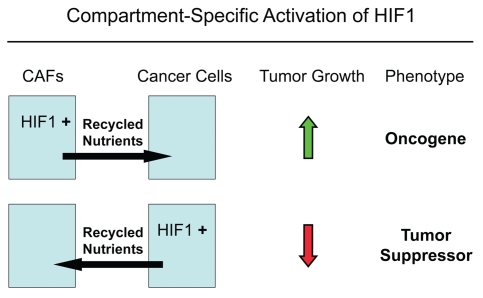
In addition, another conclusion of our studies is that the functional activity of “classic” tumor suppressors and oncogenes may be compartment and cell-type specific. For example, here we have shown that activated HIF1α behaves as a tumor promoter in cancer-associated fibroblasts and as a tumor suppressor in epithelial cancer cells (summarized in Fig. 16). Thus, tumor suppressor or oncogenic activity may not be an intrinsic property of a given molecule per se, but the cell type where it is expressed may more precisely determine the functional consequences and clinical outcome: as the realtors say, “its location, location, location!”
Figure 16.
The functional activity of tumor suppressors and oncogenes may be cell-type and compartment specific: HIF1a as a key example. Here, we have shown that activated HIF1a behaves as a tumor promoter in cancer-associated fibroblasts (CAFs) and as a tumor suppressor in epithelial cancer cells. Thus, tumor suppressor or oncogenic activity may not be an intrinsic property of a given molecule per se, but where it is expressed may determine the functional consequences and clinical outcome. As such, the functional activity of “classic” tumor suppressors and oncogenes is compartment and cell-type specific. Horizontal arrows indicate the presumed direction of energy transfer (via Recycled Nutrients) based on autophagy induced by the expression of activated HIF1a. HIF1+, denotes HIF1-alpha activation/stabilization.
The autophagic tumor stroma model of cancer.
We have recently performed a comprehensive metabolomics analysis of the mammary fad pads derived from Cav-1 (-/-) deficient mice, a pre-clinical model for a “lethal” tumor micro-environment.31 Interestingly, over 90 metabolites were increased, consistent with a major catabolic phenotype. Based on this unbiased metabolomics analysis, we concluded that Cav-1 (-/-) null mammary fat pads show a metabolic profile consistent with oxidative stress, mitochondrial dysfunction, driving the onset of autophagy/mitophagy.31 In direct support of this assertion, Cav-1 (-/-) null mammary fat pads also overexpressed markers of autophagy and mitophagy, such as cathepsin B and BNIP3.31 Finally, an informatics analysis of the genome-wide profiles of (1) Cav-1 (-/-) null stromal cells and (2) human tumor stroma derived from breast cancer patients, provided transcriptional evidence for a shift towards oxidative stress and autophagy/mitophagy.31 Thus, we proposed the new concept that autophagic cancer-associated fibroblasts are fueling the growth of adjacent tumor cells by providing recycled nutrients and chemical building blocks derived from autophagic degradation in the tumor micro-environment. We have termed this idea “the autophagic tumor stroma model of cancer.”31 Based on this new model, we proposed that autophagy in the tumor stroma would promote tumor growth, while autophagy in cancer cells would inhibit tumor growth.31
Importantly, our current results with the expression of activated HIF1α in cancer associated fibroblasts versus epithelial cancer cells provide direct experimental support for this model, i.e., that compartment-specific activation of autophagy can dramatically affect tumor growth.
Materials and Methods
Cell cultures.
Human immortalized fibroblasts (hTERT-BJ1) and human GFP-positive breast cancer cells (MDA-MB-231-GFP) were grown in Dulbecco's modified Eagle's medium (DMEM) containing 10% fetal bovine serum in a 37°C, 5% CO2 incubator. MDA-MB-231 (GFP+) cells were the generous gift of Dr. A. Fatatis (Drexel University, Philadelphia, PA).
Retroviruses.
Retroviral plasmids [pBabe-puro (vector alone), HA-HIF1α-wt-pBabe-puro, HA-HIF1α-P402A/P564A-pBabe-puro, pBabe-Flag-IKBKE-neo (obtained from Addgene, Cambridge, MA)] were transfected into the Phoenix Amphotropic packaging cell line using FuGene 6 reagent (Roche Molecular Biochemicals), according to the manufacturer's instructions. After 48 h, virus-containing medium was passed through a 0.45 µm filter and added to hTERT-BJ1 or MDA-MB-231-GFP cells in the presence of 5 µg/ml Polybrene. Infection was repeated the next day. Infected cells were selected in the presence of 1.5 µg/ml (for hTERT-BJ1) and 2.0 µg/ml (for MDA-MB-231) puromycin or 500 µg/ml G418 (for hTERT-BJ1).
Immunoblot analysis.
Cells were lysed in lysis buffer (10 mM Tris, pH 7.5, 150 mM NaCl, 1% Triton X-100 and 60 mM n-octyl-glucoside), containing protease (Roche Applied Science, Indianapolis, IN) and phosphatase inhibitors (Sigma). After rotation at 4°C for 40 minutes, cell lysates were then centrifuged at 10,000x g for 15 minutes at 4°C to remove insoluble debris. For the anti-hemagglutinin (anti-HA) antibody and anti-HIF1α antibody, cells were lysed in EBC lysis buffer 5 mM Tris, pH 8.0, 120 mM NaCl, 0.5% NP-40, containing protease (Roche Applied Science, Indianapolis, IN) and phosphatase inhibitors (Sigma). Protein concentrations were analyzed using the BCA reagent (Pierce, Rockford, IL). Cell lysates were then separated by SDS-PAGE (10 to 15% acrylamide) and transferred to nitrocellulose. Subsequent wash buffers contained 10 mM Tris, pH 8.0, 150 mM NaCl, 0.05% Tween 20, which was supplemented with 5% nonfat dry milk (Carnation) for the blocking solution and 1% bovine serum albumin for the antibody diluent. For phospho-antibody analysis, the blocking solution contained only 5% BSA in TBS-Tween (without non-fat dry milk). Horseradish peroxidase-conjugated secondary antibodies [anti-mouse, 1:6,000 dilution (Pierce) or anti-rabbit 1:5,000 (BD Biosciences/Pharmingen)] were used to visualize bound primary antibodies, with the Supersignal chemiluminescence substrate (Pierce, Rockford, IL). The membranes were probed with anti-hemagglutinin (anti-HA) mouse monoclonal antibody (HA.11, Covance); and anti-HIF1α mouse monoclonal antibody (NB100-123, Novus Biologicals); monoclonal ANTI-FLAG M2 (cat#F3165, Sigma); anti-NFκBp65 polyclonal antibody (cat#3034, Cell Signaling); anti-caveolin-1 (N20) (cat#sc-894, Santa Cruz); purified mouse anti-caveolin-1 (cat#610407, BD Biosciences); purified mouse anti-caveolin-1 (pY14) (cat#611339, BD Biosciences); anti-vimentin (R28) antibody (cat#3932, Cell Signaling); purified mouse anti-vimentin (cat#550513, BD Biosciences); anti-calponin 1/2/3 (FL-297) (cat#sc-28545, Santa Cruz); anti-BNIP3L antibody (cat#ab8399, abcam); monoclonal anti-β-actin antibody (cat#A5441, Sigma).
Proteomic analysis.
2-D DIGE (two-dimensional difference gel electrophoresis) and mass spectrometry protein identification were run by Applied Biomics (Hayward, CA). Image scans were carried out immediately following the SDS-PAGE using Typhoon TRIO (Amersham BioSciences) following the protocols provided. The scanned images were then analyzed by Image QuantTL software (GE-Healthcare) and then subjected to in-gel analysis and crossgel analysis using DeCyder software version 6.5 (GE-Healthcare). The ratio of protein differential expression was obtained from in-gel DeCyder software analysis. The selected spots were picked by an Ettan Spot Picker (GE-Healthcare) following the DeCyder software analysis and spot picking design. The selected protein spots were subjected to in-gel trypsin digestion, peptides extraction, desalting and followed by MALDI-TOF/TOF (Applied Biosystems) analysis to determine the protein identity.
Fibroblast-cancer cell co-cultures.
hTERT-BJ1 fibroblasts and MDA-MB-231-GFP cells were plated onto glass coverslips in 12-well plates in 1 ml of DMEM containing 10% NuSerum (BD Biosciences). Cells were seeded at a 5:1 fibroblast to MDA-MB-231-GFP cell ratio and the total number of cells per well was 1 × 10⁵. As controls, cultures of fibroblasts alone and MDA-MB-231-GFP alone were plated in parallel.
Mitochondrial staining.
To label mitochondria, the rosamine-based MitoTracker Orange CMTMRos (cat#M7510, Invitrogen) was used. Lyophilized MitoTracker product was dissolved in DMSO to prepare a 1 mM stock solution. Then, the stock solution was diluted in serum-free DMEM to a final concentration of 25 nM. Cells were incubated with the pre-warmed MitoTracker staining solution for 12 minutes at 37°C. Then, cells were washed in PBS with calcium and magnesium three times and fixed with 2% PFA.
Western blot analysis was also performed using an OXPHOS human antibody cocktail (cat#MS601, MitoSciences) and a membrane integrity WB antibody cocktail (cat#MS620, MitoSciences).
L-lactate assay.
hTERT-BJ1 fibroblasts were seeded (1.2 × 10⁵ per well) in 12-well plates in 250 µl of complete media. The day after, the media was changed to DMEM containing 2% FBS. After 48 h, the media of each well was collected for measuring lactate concentration using the EnzyChrom™ L-Lactate Assay Kit (cat#ECLC-100, BioAssay Systems). After removing the media, the remaining attached cells were harvested to determine their protein content. Finally, the amount of L-lactate in the media was normalized for total cell protein content.
Immunofluorescence microscopy.
Cells were plated onto glass coverslips in 12-well plates in 1 ml of complete media. The day after cells were washed in PBS with calcium and magnesium three times and fixed with 2% PFA. After fixation, cells were permeabilized in 0.1% Triton X-100/0.2% BSA/PBS for 10 minutes. Cells were then treated with 25 mmol/L NH4Cl in PBS for 10 minutes to quench free aldehyde groups. After rinsing with PBS, cells were incubated with anti-BNIP3L BH3 Domain antibody (cat#AP1320A, Abgent); anti-BNIP3L antibody (cat#ab8399, Abcam); anti-LC3A/B antibody (cat#ab58610, Abcam); anti-LC3 antibody (APG8B) (N-term) (cat#AP1802a, Abgent); or the anti-BNIP3 antibody (cat#ab10433, Abcam).
Animal studies.
All animals were housed and maintained in a barrier facility at the Kimmel Cancer Center at Thomas Jefferson University under National Institutes of Health (NIH) guidelines. Mice were kept on a 12 hour light/dark cycle with ad libitum access to chow and water. Animal protocols used for this study were pre-approved by the the Institutional Animal Care and Use Committee. Briefly, MDA-MB-231-GFP cancer cells (1 × 10⁶ cells) alone or admixed with hTERT-BJ1 fibroblasts (3 × 10⁵ cells) in 100 µl of sterile PBS, were injected into the flanks of athymic NCr nude mice (NCRNU; Taconic Farms; 6–8 weeks of age). Mice were then sacrificed at 2 or 4 weeks post-injection; tumors were dissected to determine their weight and size using calipers. Tumor volume was calculated using the formula (X2Y)/2, where X and Y are the short and long dimensions, respectively, of the tumor. MDA-pBABE, MDA-HIF1α-wt or MDA-HIF1α-mut (1 × 10⁶ cells) were injected into the flanks of athymic NCr nude mice. Mice were sacrificed at 2 weeks post-injection.
Quantitation of tumor angiogenesis.
Immunohistochemical staining for CD31 was performed on frozen tumor sections using a 3-step biotin-streptavidin-horseradish peroxidase method. Frozen tissue sections (6 µm) were fixed in 2% paraformaldehyde in PBS for 10 min and washed with PBS. After blocking with 10% rabbit serum the sections were incubated overnight at 4°C with rat anti-mouse CD31 antibody (BS Biosciences) at a dilution of 1:200, followed by biotinylated rabbit anti-rat IgG (1:200) antibody and streptavidin-HRP. Immunoreactivity was revealed with 3, 3′ diaminobenzidine. For quantitation of vessels, CD31-positive vessels were enumerated in 4–6 fields within the central area of each tumor using a 20x objective lens and an ocular grid (0.25 mm2 per field). The total numbers of vessel per unit area was calculated using Image J and the data was represented graphically.
Immunohistochemistry.
Frozen tumor tissue sections (6 µm) were fixed with 1% paraformaldehyde in PBS and labeled with either Cav-1 (1:1,000, Santa Cruz Biotechnology, Santa Cruz, CA), rabbit antiserum to PKM2 (1:1,000; kindly provided by Dr. Matthew Vander Heiden, Boston, MA) or a rabbit antibody to LDHB (1:500; Sigma AV48210, St. Louis, MO). Antibody binding (red fluorescence) was detected with goat anti-rabbit Alexa Fluor 546 (1:1,000; Invitrogen Molecular Probes, Eugene, OR). The green fluorescence is the “endogenous” signal from MDA-MB-231-GFP cells.
Acknowledgements
M.P.L. and his laboratory were supported by grants from the NIH/NCI (R01-CA-080250; R01-CA-098779; R01-CA-120876; R01-AR-055660) and the Susan G. Komen Breast Cancer Foundation. F.S. was supported by grants from the Breast Cancer Alliance (BCA) and a Research Scholar Grant from the American Cancer Society (ACS). R.G.P. was supported by grants from the NIH/NCI (R01-CA-70896, R01-CA-75503, R01-CA-86072 and R01-CA-107382) and the Dr. Ralph and Marian C. Falk Medical Research Trust. The Kimmel Cancer Center was supported by the NIH/NCI Cancer Center Core grant P30-CA-56036 (to R.G.P.). Funds were also contributed by the Margaret Q. Landenberger Research Foundation (to M.P.L.). This project is funded, in part, under a grant with the Pennsylvania Department of Health (to M.P.L.). The Department specifically disclaims responsibility for any analyses, interpretations or conclusions. This work was also supported, in part, by a Centre grant in Manchester from Breakthrough Breast Cancer in the UK (to A.H.) and an Advanced ERC Grant from the European Research Council.
We also thank Drs. William C. Hahn (Harvard/Dana Farber) and William G. Kaelin (Harvard/Dana Farber) for generously providing the necessary plasmid vectors encoding IKBKE, HIF1α (wild-type) and HIF1α (mutationally-activated).
Footnotes
Previously published online: www.landesbioscience.com/journals/cc/article/12908
Supplementary Material
References
- 1.Bissell MJ, Radisky D. Putting tumours in context. Nat Rev Cancer. 2001;1:46–54. doi: 10.1038/35094059. [DOI] [PMC free article] [PubMed] [Google Scholar]
- 2.Bissell MJ, Radisky DC, Rizki A, Weaver VM, Petersen OW. The organizing principle: microenvironmental influences in the normal and malignant breast. Differentiation. 2002;70:537–546. doi: 10.1046/j.1432-0436.2002.700907.x. [DOI] [PMC free article] [PubMed] [Google Scholar]
- 3.Ghajar CM, Meier R, Bissell MJ. Quis custodiet ipsos custodies: who watches the watchmen? Am J Pathol. 2009;174:1996–1999. doi: 10.2353/ajpath.2009.090363. [DOI] [PMC free article] [PubMed] [Google Scholar]
- 4.Ronnov-Jessen L, Bissell MJ. Breast cancer by proxy: can the microenvironment be both the cause and consequence? Trends Mol Med. 2009;15:5–13. doi: 10.1016/j.molmed.2008.11.001. [DOI] [PMC free article] [PubMed] [Google Scholar]
- 5.Witkiewicz AK, Casimiro MC, Dasgupta A, Mercier I, Wang C, Bonuccelli G, et al. Towards a new “stromal-based” classification system for human breast cancer prognosis and therapy. Cell Cycle. 2009;8:1654–1658. doi: 10.4161/cc.8.11.8544. [DOI] [PubMed] [Google Scholar]
- 6.Sotgia F, Del Galdo F, Casimiro MC, Bonuccelli G, Mercier I, Whitaker-Menezes D, et al. Caveolin-1-/- null mammary stromal fibroblasts share characteristics with human breast cancer-associated fibroblasts. Am J Pathol. 2009;174:746–761. doi: 10.2353/ajpath.2009.080658. [DOI] [PMC free article] [PubMed] [Google Scholar]
- 7.Orimo A, Gupta PB, Sgroi DC, Arenzana-Seisdedos F, Delaunay T, Naeem R, et al. Stromal fibroblasts present in invasive human breast carcinomas promote tumor growth and angiogenesis through elevated SDF-1/CXCL12 secretion. Cell. 2005;121:335–348. doi: 10.1016/j.cell.2005.02.034. [DOI] [PubMed] [Google Scholar]
- 8.Karnoub AE, Dash AB, Vo AP, Sullivan A, Brooks MW, Bell GW, et al. Mesenchymal stem cells within tumour stroma promote breast cancer metastasis. Nature. 2007;449:557–563. doi: 10.1038/nature06188. [DOI] [PubMed] [Google Scholar]
- 9.Witkiewicz AK, Dasgupta A, Sotgia F, Mercier I, Pestell RG, Sabel M, et al. An absence of stromal Caveolin-1 expression predicts early tumor recurrence and poor clinical outcome in human breast cancers. Am J Pathol. 2009;174:2023–2034. doi: 10.2353/ajpath.2009.080873. [DOI] [PMC free article] [PubMed] [Google Scholar]
- 10.Witkiewicz AK, Dasgupta A, Nguyen KH, Liu C, Kovatich AJ, Schwartz GF, et al. Stromal caveolin-1 levels predict early DCIS progression to invasive breast cancer. Cancer Biol Ther. 2009;8:1167–1175. doi: 10.4161/cbt.8.11.8874. [DOI] [PubMed] [Google Scholar]
- 11.Di Vizio D, Morello M, Sotgia F, Pestell RG, Freeman MR, Lisanti MP. An absence of stromal Caveolin-1 is associated with advanced prostate cancer, metastatic disease and epithelial Akt activation. Cell Cycle. 2009;8:2420–2424. doi: 10.4161/cc.8.15.9116. [DOI] [PMC free article] [PubMed] [Google Scholar]
- 12.Pavlides S, Whitaker-Menezes D, Castello-Cros R, Flomenberg N, Witkiewicz AK, Frank PG, et al. The reverse Warburg effect: aerobic glycolysis in cancer associated fibroblasts and the tumor stroma. Cell Cycle. 2009;8:3984–4001. doi: 10.4161/cc.8.23.10238. [DOI] [PubMed] [Google Scholar]
- 13.Pavlides S, Tsirigos A, Vera I, Flomenberg N, Frank PG, Casimiro MC, et al. Loss of stromal Caveolin-1 leads to oxidative stress, mimics hypoxia and drives inflammation in the tumor microenvironment, conferring the “Reverse Warburg Effect”: A transcriptional informatics analysis with validation. Cell Cycle. 2010;9:2201–2219. doi: 10.4161/cc.9.11.11848. [DOI] [PubMed] [Google Scholar]
- 14.Martinez-Outschoorn UE, Pavlides S, Whitaker-Menezes D, Daumer KM, Milliman JN, Chiavarina B, et al. Tumor cells induce the cancer associated fibroblast phenotype via Caveolin-1 degradation: Implications for breast cancer and DCIS therapy with autophagy inhibitors. Cell Cycle. 2010;9:2423–2433. doi: 10.4161/cc.9.12.12048. [DOI] [PubMed] [Google Scholar]
- 15.Martinez-Outschoorn UE, Balliet RM, Rivadeneira DB, Chiavarina B, Pavlides S, Wang C, et al. Oxidative stress in cancer associated fibroblasts drives tumor-stroma co-evolution: A new paradigm for understanding tumor metabolism, the field effect and genomic instability in cancer cells. Cell Cycle. 2010;9:3256–3276. doi: 10.4161/cc.9.16.12553. [DOI] [PMC free article] [PubMed] [Google Scholar]
- 16.Martinez-Outschoorn UE, Trimmer C, Lin Z, Whitaker-Menezes D, Chiavarina B, Zhou J, et al. Autophagy in cancer associated fibroblasts promotes tumor cell survival: Role of hypoxia, HIF1 induction and NFkB activation in the tumor stromal microenvironment. Cell Cycle. 2010;9:3515–3533. doi: 10.4161/cc.9.17.12928. [DOI] [PMC free article] [PubMed] [Google Scholar]
- 17.Volonte D, Galbiati F, Pestell RG, Lisanti MP. Cellular stress induces the tyrosine phosphorylation of Caveolin-1 (Tyr14) via activation of p38 mitogen-activated protein kinase and c-Src kinase. J Biol Chem. 2001;276:8094–8103. doi: 10.1074/jbc.M009245200. [DOI] [PubMed] [Google Scholar]
- 18.Shajahan AN, Tiruppathi C, Smrcka AV, Malik AB, Minshall RD. Gbetagamma activation of Src induces caveolae-mediated endocytosis in endothelial cells. J Biol Chem. 2004;279:48055–48062. doi: 10.1074/jbc.M405837200. [DOI] [PubMed] [Google Scholar]
- 19.Shajahan AN, Timblin BK, Sandoval R, Tiruppathi C, Malik AB, Minshall RD. Role of Src-induced dynamin-2 phosphorylation in caveolae-mediated endocytosis in endothelial cells. J Biol Chem. 2004;279:20392–20400. doi: 10.1074/jbc.M308710200. [DOI] [PubMed] [Google Scholar]
- 20.Criollo A, Senovilla L, Authier H, Maiuri MC, Morselli E, Vitale I, et al. The IKK complex contributes to the induction of autophagy. EMBO J. 2010;29:619–631. doi: 10.1038/emboj.2009.364. [DOI] [PMC free article] [PubMed] [Google Scholar]
- 21.Goldman SJ, Taylor R, Zhang Y, Jin S. Autophagy and the degradation of mitochondria. Mitochondrion. 2010;10:309–315. doi: 10.1016/j.mito.2010.01.005. [DOI] [PMC free article] [PubMed] [Google Scholar]
- 22.Mazure NM, Pouyssegur J. Hypoxia-induced autophagy: cell death or cell survival? Curr Opin Cell Biol. 2010;22:177–180. doi: 10.1016/j.ceb.2009.11.015. [DOI] [PubMed] [Google Scholar]
- 23.Mazure NM, Pouyssegur J. Atypical BH3-domains of BNIP3 and BNIP3L lead to autophagy in hypoxia. Autophagy. 2009;5:868–869. doi: 10.4161/auto.9042. [DOI] [PubMed] [Google Scholar]
- 24.Zhang H, Bosch-Marce M, Shimoda LA, Tan YS, Baek JH, Wesley JB, et al. Mitochondrial autophagy is an HIF-1-dependent adaptive metabolic response to hypoxia. J Biol Chem. 2008;283:10892–10903. doi: 10.1074/jbc.M800102200. [DOI] [PMC free article] [PubMed] [Google Scholar] [Retracted]
- 25.Tanida I, Ueno T, Kominami E. LC3 and Autophagy. Methods Mol Biol. 2008;445:77–88. doi: 10.1007/978-1-59745-157-4_4. [DOI] [PubMed] [Google Scholar]
- 26.Zhang H, Gao P, Fukuda R, Kumar G, Krishnamachary B, Zeller KI, et al. HIF-1 inhibits mitochondrial biogenesis and cellular respiration in VHL-deficient renal cell carcinoma by repression of c-MYC activity. Cancer Cell. 2007;11:407–420. doi: 10.1016/j.ccr.2007.04.001. [DOI] [PubMed] [Google Scholar]
- 27.Witkiewicz AK, Dasgupta A, Sammons S, Er O, Potoczek MB, Guiles F, et al. Loss of stromal caveolin-1 expression predicts poor clinical outcome in triple negative and basal-like breast cancers. Cancer Biol Ther. 2010;10:135–143. doi: 10.4161/cbt.10.2.11983. [DOI] [PMC free article] [PubMed] [Google Scholar]
- 28.Bonuccelli G, Whitaker-Menezes D, Castello-Cros R, Pavlides S, Pestell RG, Fatatis A, et al. The Reverse Warburg Effect: glycolysis inhibitors prevent the tumor promoting effects of Caveolin-1 deficient cancer associated fibroblasts. Cell Cycle. 2010;9:1960–1971. doi: 10.4161/cc.9.10.11601. [DOI] [PubMed] [Google Scholar]
- 29.Sonveaux P, Vegran F, Schroeder T, Wergin MC, Verrax J, Rabbani ZN, et al. Targeting lactate-fueled respiration selectively kills hypoxic tumor cells in mice. J Clin Invest. 2008;118:3930–3942. doi: 10.1172/JCI36843. [DOI] [PMC free article] [PubMed] [Google Scholar]
- 30.Bonuccelli G, Tsirigos A, Whitaker-Menezes D, Pavlides S, Pestell RG, Chiavarina B, et al. Ketones and lactate “fuel” tumor growth and metastasis: Evidence that epithelial cancer cells use oxidative mitochondrial metabolism. Cell Cycle. 2010;9:3506–3514. doi: 10.4161/cc.9.17.12731. [DOI] [PMC free article] [PubMed] [Google Scholar]
- 31.Pavlides S, Tsirigos A, Migneco G, Whitaker-Menezes D, Chiavarina B, Flomenberg N, et al. The autophagic tumor stroma model of cancer: Role of oxidative stress and ketone production in fueling tumor cell metabolism. Cell Cycle. 2010;9:3485–3505. doi: 10.4161/cc.9.17.12721. [DOI] [PMC free article] [PubMed] [Google Scholar]
Associated Data
This section collects any data citations, data availability statements, or supplementary materials included in this article.


