

Abstract
Mammalian c-Myc is a member of a small family of three closely related transcription factors. The Myc family of proto-oncogenes are among the most potent activators of tumorigenesis and are frequently overexpressed in diverse cancers. c-Myc has an unusually broad array of regulatory functions, which include, in addition to roles in the cell cycle and apoptosis, effects on a variety of metabolic functions, cell differentiation, senescence and stem cell maintenance. A significant number of c-Myc interacting proteins have already been defined, but it is widely believed that the c-Myc interactome is vastly larger than currently documented. In addition to interactions with components of the transcription machinery, transcription independent nuclear interactions with the DNA replication and RNA processing pathways have been reported. Cytoplasmic roles of c-Myc have also been recently substantiated. Recent advances in proteomics have opened new possibilities for the isolation of protein complexes under native conditions and confidently identifying the components using ultrasensitive, high mass accuracy and high resolution mass spectrometry techniques. In this communication we report a new tandem affinity purification (TAP) c-Myc interaction screen that employed new cell lines with near-physiological levels of c-Myc expression with multi-dimensional protein identification techniques (MudPIT) for the detection and quantification of proteins. Both label-free and the recently developed stable isotope labeling with amino acids in cell culture (SILAC) methodologies were used. Combined data from multiple biological replicates provided a dataset of 418 non-redundant proteins, 389 of which are putative novel interactors. This new information should significantly advance our understanding of this interesting and important master regulator.
Key words: c-Myc, proto-oncogene, proteomics, tandem affinity purification, MudPIT analysis, SILAC, protein-protein interaction, protein complex
Introduction
c-Myc is a member of a small family of three closely related transcription factors, c-Myc, N-Myc and L-Myc.1 Numerous studies have documented that the Myc family of proto-oncogenes are among the most potent activators of tumorigenesis, and are frequently overexpressed in diverse cancers.2 Deregulation of Myc activity can occur by a range of mechanisms, including indirect ones such as activation of upstream signaling or impairment of its turnover.3 Given that our understanding of these mechanisms remains incomplete, the contribution of Myc to the total load of human cancers is probably still underestimated.
The c-Myc protein is comprised of an N-terminal transcription regulatory domain (NTD), a central region containing PEST degradation and nuclear localization signals (NLS), and a C-terminal DNA binding domain (CTD). The NTD engages in a variety of protein-protein interactions with components of the transcriptional and chromatin remodeling machineries.4 It contains short sequence motifs (MbI and MbII) that are evolutionarily conserved among all Myc family members and are required for biological activity.5 The CTD of c-Myc contains basic, helix-loop-helix and leucine zipper (bHLH-LZ) motifs that mediate interaction with its binding partner Max and the sequence-specific DNA binding of the Myc/Max heterodimer.
Beginning with the identification of Max some twenty years ago, a large number of c-Myc interacting proteins have been defined. The general picture that has emerged is that c-Myc activates its targets by a combination of three mechanisms:6 (1) recruitment of histone acetyl transferase (HAT) activity; (2) recruitment of ATP-dependent SWI/SNF chromatin remodeling complexes; and (3) facilitation of promoter clearance and elongation by an already engaged RNA polymerase II (RNA Pol II). c-Myc is also involved in the repression of many genes, which is mediated by protein-protein interactions and interference with a number of transcription factors, including Miz-1, TFII-I, YY-1, NF-Y and Sp1, or by recruitment of Dnmt3a DNA methyltransferase to specific promoters.7
c-Myc also engages in a number of transcription independent interactions, for example with components of TFII-H to promote mRNA cap methylation,5 with several members of the S phase prereplicative complex to stimulate DNA replication,5 with a number of tumor suppressors and cell cycle regulators that negatively regulate its activity,1 and with multiple ubiquitin ligases to promote either its own destruction or activation of transcriptional activity.3
The currently annotated number of c-Myc interactors in the Human Protein Reference Database (HPRD) stands at seventy one.8 Due to the very low abundance of c-Myc in normal, non-cancerous cells, as well as its rapid turnover most studies have taken advantage of ectopic overexpression or two-hybrid approaches to identify c-Myc binding proteins. Recent advances in proteomics have opened new possibilities for the isolation of complexes under native conditions with confident identification and quantification of the components using ultrasensitive mass spectrometry (MS) techniques. The use of a mass spectrometer with high resolution and high mass accuracy in this study greatly increases the confidence of assignments of interacting proteins and facilitates quantitative analysis using both label free and stable isotope labeling strategies. The only report to date to analyze c-Myc complexes using tandem affinity purification (TAP) combined with the multi-dimensional protein identification technique (MudPIT), identified 220 interacting proteins using an LTQ mass spectrometer.9 The fact that only nine of these proteins overlap with the HPRD annotated interactors underscores the need for further investigations. In this communication we report a new TAP-Myc interaction screen that used new cell lines with near-physiological levels of c-Myc expression as well as the recently developed and quantitative stable isotope labeling with amino acids in cell culture (SILAC) methodology, combined with high mass accuracy and high resolution MudPIT tandem MS/MS spectra detection of proteins on the Thermo hybrid linear ion trap fourier transform ion cyclotron resonance (LTQ-FTICR) mass spectrometer.
Results
Construction of TAP-Myc fusion proteins and testing their in vivo activity.
The TAP-tag was fused to the full length c-Myc protein either at its N-terminus (TAPMyc) or C-terminus (MycTAP; Materials and Methods; Fig. 1A). Since heterologous protein fusions can lead to impairment of biological activity, the TAP-tagged c-Myc proteins were expressed in cells lacking endogenous c-myc and tested for complementation. We have previously constructed by gene targeting c-myc-/- derivatives of the Rat-1 fibroblast cell line;16 these cells display profound proliferation and cell cycle defects,24,25 which can be fully restored by expression of wild-type c-myc cDNA. Stable expression of either TAPMyc or MycTAP in c-myc-/- cells restored normal growth phenotypes (not shown), indicating that the TAP-tag does not affect the biological activity of c-Myc. Examination of extracts prepared from the complemented cell lines by immunoblotting showed that the TAP-tag fusion proteins remained intact (not shown); complementation was thus not due to release of c-Myc from the fusion proteins by proteolysis. TAPMyc and MycTAP were also expressed in human fibroblasts transformed with telomerase and SV40 large and small T antigens (LF1/TERT/LT/ST).11 Ectopic expression of biologically active c-Myc significantly accelerates the growth of LF1/TERT/LT/ST cells, and endows them with the ability to grow in an anchorage-independent manner.11 In this biological assay TAPMyc and MycTAP also displayed full c-Myc activity (not shown).
Figure 1.

Size exclusion chromatography of nuclear TAPMyc complexes. (A) Schematic representation of the TAPMyc protein. Structure of the TAP-tag: Prot A, protein A; TEV, TEV protease cleavage site; CBP, calmodulin binding protein. c-Myc contains a N-terminal transactivation domain and a C-terminal DNA binding domain. The conserved regions of c-Myc known as Myc boxes I through IV are shown a MBI, MBII, MBIII and MBIV. The C-terminal domain is composed of a basic region, b, a helix-loop-helix region, HLH, and a leucine zipper, LZ. In the MycTAP protein (not shown) the order of domains was reversed to be (N-to-C terminus): Myc(MBI-IV-b-HLH-LZ)-Cal BP-TEV-Prot A. (B) Size exclusion chromatography of TAPMyc-and MycTAP-containing nuclear exacts prepared using the Evan and Hancock method on a Superdex 200 column. Fractions were resolved by SDS-PAGE and immunoblotted for the protein A epitope of the TAP-tag. Lower portions of the same gel were probed for Max. Elution of molecular weight markers is shown above.
Extraction of high molecular weight TAP-Myc complexes.
LF1/TERT/LT/ST cells maintain stable expression of ectopic c-Myc because it confers a proliferative advantage. We initially worked with both TAPMyc- and MycTAP-expressing LF1/TERT/LT/ST, but for the large scale purifications used TAPMyc cells simply because they gave slightly higher yields during extraction. HAMyc-expressing cells were used as negative controls: they express HAMyc at levels equivalent to TAPMyc or MycTAP cells and display identical growth properties, but the HA-tag does not bind to IgG or calmodulin beads.
Two different lysis conditions were tested for the extraction of nuclear c-Myc complexes: the classical Dignam et al. method18 frequently used for the purification of transcription factors, and the Evan and Hancock method,17 developed specifically for the extraction of c-Myc. Both of the methods employ hypotonic buffer lysis to remove the cytoplasm; to extract the nuclei the Dignam et al. method uses high salt and glycerol, while the Evan and Hancock method uses physiological salt concentrations in the presence of a non-ionic detergent. Both methods resulted in the extraction of 50–70% of total TAPMyc, MycTAP or HAMyc; the remainder was associated with the insoluble nuclear pellet and could only be extracted by complete solubilization with SDS. Digestion of chromosomal DNA with DNaseI during the extraction did not recover any additional TAPMyc, MycTAP or HAMyc. Eventually the Evan and Hancock method was adopted for large scale purification, simply because it required fewer steps and gave a slightly higher yield than the Dignam et al. method.
As an initial characterization, nuclear extracts were subjected to size exclusion chromatography by FPLC on a Superdex 200 column, and the fractions were immunoblotted for either the TAP-tag or Max. The great majority of TAPMyc or MycTAP was found to be present in megadalton molecular weight complexes (Fig. 1B). A minor peak was seen in the 200–300 kDa range, and essentially no signal was seen in the region of monomeric Myc or Myc/Max dimers. Max comigrated with Myc in the high molecular weight region. The large TAPMyc and MycTAP complexes migrated in the first few included fractions just behind the void volume; given the low resolution of gel filtration in this range, multiple different complexes could be present and comigrating. The migration of the complexes was not influenced by binding to DNA because the elution behavior did not change when extracts were treated with DNaseI (not shown). Likewise, the high molecular weight migration was not due to the presence of protein-detergent micelles, since extracts prepared using the Dignam et al. method (which does not employ any detergent) resulted in identical column profiles. Finally, the migration was not influenced by the TAP-tag, because HAMyc behaved in the same manner.
Tandem affinity purification.
This purification scheme involved a pull-down on IgG Sepharose beads, release by cleavage with TEV protease, a second pull-down on Calmodulin Sepharose beads and release by the chelation of calcium (see Fig. 2A for a schematic and Materials and Methods for details). Myc and Max proteins were monitored throughout the purification by immunoblotting (Fig. 2B). Both Myc and Max were detected in the final EGTA eluted fractions and were maintained at the same relative ratio as in the starting material, indicating that Myc complexes, at least with respect to Myc/Max dimers, remained intact during the purification. The purification of TAPMyc was specific, since HAMyc showed no interaction with either the IgG beads or the calmodulin beads and Max was never detected at any of the purification steps when HAMyc-containing extracts were processed.
Figure 2.

Tandem affinity purification of TAPMyc complexes. (A) For single-step purifications, after washing IgG beads with buffer B, beads were washed with buffer B without protease and phosphatase inhibitors, casein and NP40, and bound proteins were eluted with 100 mM glycine pH 2.5. The MudPIT/MS steps were the same after all purifications. (B) Purifications of nuclear extracts from TAPMyc (upper parts) and HAMyc (lower parts) expressing cells were monitored by immunoblotting for both c-Myc and Max at each purification step. The relevant proteins are identified in the right margin. Note the faster migration of the TAPMyc protein after removal of the protein A domain with TEV protease (TAPMyc w/o Prot A). Lane 1 (Sup), nuclear extract after pulldown with IgG beads; lanes 2 and 3 (N1 and N2), nuclei were extracted twice and the fractions were pooled as the starting material (Input) for the purification; lane 4 (IP), after pulldown the IgG beads were washed and an aliquot was boiled in sample buffer to remove bound Myc complexes (note efficient pulldown of Max, and lack of pulldown of either HAMyc or Max in the lower parts); lane 5 (TEV Rxn) IgG beads were incubated with TEV protease and an aliquot of the reaction was treated with sample buffer (note the almost complete cleavage of the TAPMyc protein); lane 6 (TEV Sup) beads were removed and the supernatant was assayed for released Myc complexes; lane 7 (TEV Beads) complexes remaining bound to the beads were released with sample buffer (note strong retention of complexes on beads in spite of efficient TEV cleavage); lane 8 (TEV beads wash) TEV beads were washed extensively with CB buffer and complexes remaining on beads were scored by release with sample buffer (note continuing strong retention of complexes on beads); lane 9 (Cal Beads Sup) the TEV-released complexes were loaded onto Calmodulin beads, the beads were spun down, and complexes remaining in the supernatant were assayed (note reasonable capture by Calmodulin beads); lane 10 (Cal beads) pulled-down complexes were determined by boiling an aliquot of the beads with sample buffer; lane 11 (Cal Beads EGTA) Cal Beads after elution with EGTA were treated as before (lane 10; note efficient release of complexes with EGTA); lanes 12–16 are individual fractions of the EGTA elutions (E1 through E5, in that order), note that most of the complexes eluted in fractions 1 and 2. Loading of lanes is indicated below the top part, for example, lane 16 contains the equivalent of 28-times the amount of starting material shown in lane 3. The lanes in the HAMyc parts are loaded in the same order and same proportions.
The Myc complexes were further characterized using a series of ultracentrifugation steps (Fig. 3A). A small portion of the Calmodulin Sepharose eluate was in the form of aggregates, as evidenced by the fact that 10–15% of total Myc and Max could be pelleted by short (20 min) 25,000 g and 50,000 g spins. After this initial clearing, very little Myc and Max was pelleted by subsequent 75,000 g and 100,000 g spins. That high molecular weight complexes were present was indicated by the observation that longer (2 hr) centrifugation at 100,000 g could pellet over 50% of the Myc and Max present. The presence of complexes was further demonstrated by concentrating the Calmodulin Sepharose eluate by centrifugal ultrafiltration (using a 10 kDa cutoff Microcon membrane) and Superdex 200 size exclusion FPLC (Fig. 3B) under the same conditions used previously to characterize the crude nuclear extracts. As before, Myc and Max were present predominantly in megadalton complexes that migrated in the first few included fractions.
Figure 3.

Characterization of TAPMyc purified complexes. (A) The Calmodulin Sepharose eluate was subjected to a series of spins: spin 1, 25,000 g, 20 min, spin 2, 50,000 g, 20 min, spin 3, 75,000 g, 20 min., spin 4, 100,000 g, 20 min. The pellet of each spin was recovered (P1 through P4) and the supernatant was carried over into the next spin. Supernatants: final, 100,000 g; start, input material. Samples were analyzed by immunoblotting; the relevant proteins are identified in the right margin. rMyc; recombinant c-Myc used as a loading control. (B) The Calmodulin Sepharose eluate was concentrated by centrifugal ultrafiltration (Microcon, Millipore) and subjected to size exclusion chromatography on a Superdex 200 column. Fractions were resolved by SDS-PAGE and immunoblotted. Because the TAPMyc protein at this stage of purification had the protein A epitope cleaved off, we had to rely on c-Myc antibodies to detect it. Although we could clearly detect TAPMyc in the input, because of the limited quantities this starting material and the relatively low affinity of available c-Myc antibodies, we were not able to cleanly detect TAPMyc in the column fractions. Max protein was however clearly visible. Elution of molecular weight markers is shown above.
Following concentration, the Calmodulin Sepharose eluate was also analyzed by SDS-PAGE and silver staining. A number of proteins were found to be present (Fig. 4), but the majority of them are likely to be nonspecific since they were found in purifications starting with either TAPMyc or HAMyc containing extracts. The migration positions of Myc and Max were ascertained by immunoblotting a gel loaded with the same samples. The most prominent specifically enriched band visible by silver staining was Myc itself. Max was obscured by IgG and casein bands migrating in the lower portion of the gel. Despite extensive washing during purification, some IgG chains and casein remained present in the final fractions. Several TAPMyc-enriched bands were visible, but none stained as intensely as Myc.
Figure 4.

SDS-PAGE and silver stain analysis of purified TAPMyc complexes. The Calmodulin Sepharose eluate was concentrated by centrifugal ultrafiltration (Microcon, Millipore) and 3 µg protein was run on a 3–10% polyacrylamide gel followed by silver staining. The c-Myc band is indicated in the left margin, as are additional bands that appeared enriched in the TAPMyc sample (arrows). IgG heavy and light chains are indicated in the right margin.
MS/MS analysis of the TAP samples.
The Calmodulin Sepharose eluate was finally processed for MS using MudPIT (Materials and Methods). Tryptic digests were resolved over a strong cation exchange column followed by a reverse phase column for the first and second dimensions, respectively, injected online into a Thermo Finnigan LTQFT hybrid ion trap fourier transform mass spectrometer, and tandem MS/MS spectra were acquired in real time. This approach resulted in the detection of 1,645 proteins, of which 48 were enriched > two-fold in the TAPMyc sample and identified with 2 or more unique peptides (Table 1, see Sup. Table 2 for summary of all experiments). Max was detected with 7 peptides. The great majority of proteins (1,469) were identified with a single peptide only.
Table 1.
Summary of the two-step purification experiment
| GeneID1 | Symbol2 | Protein name3 | Pept. #4 | GeneID1 | Symbol2 | Protein name3 | Pept. #4 | ||
| M | C | M | C | ||||||
| 4008 | LMO7 | LIM domain only 7 | 12 | 8 | 85442 | KNDC1 | KIND domain containing 1 | 2 | 1 |
| 4000 | LMNA | Lamin A/C | 8 | 3 | 11061 | LECT1 | Leukocyte chemotaxin 1 | 2 | 0 |
| 4149 | MAX | Myc associated factor X | 7 | 0 | 79778 | MICALL2 | MICAL like 2 | 2 | 0 |
| 10128 | LRPPRC | Leucine rich PPR motif protein | 4 | 0 | 4285 | MIPEP | Mitochondrial peptidase | 2 | 0 |
| 284119 | PTRF | RNA pol I release factor | 4 | 3 | 27030 | MLH3 | MutL homolog 3 | 2 | 0 |
| 7273 | TTN | Titin | 4 | 2 | 79671 | NLRX1 | NLR family member X1 | 2 | 0 |
| 55914 | ERBB2IP | Erbb2 interacting protein | 3 | 0 | 9369 | NRXN3 | Neurexin 3 | 2 | 0 |
| 3550 | IK | IK nuclear protein | 3 | 1 | 23037 | PDZD2 | PDZ domain containing 2 | 2 | 0 |
| 4240 | MFGE8 | EGF factor 8 protein | 3 | 0 | 112464 | PRKCDBP | PKCδ binding protein | 2 | 1 |
| 89797 | NAV2 | Neuron navigator 2 | 3 | 0 | 5784 | PTPN14 | Protein Tyr phosphatase 14 | 2 | 0 |
| 51421 | AMOTL2 | Angiomotin line 2 | 2 | 1 | 26056 | RAB11FIP5 | RAB11 interacting protein 5 | 2 | 0 |
| 411 | ARSB | Arylsulfatase B | 2 | 0 | 55758 | RCOR3 | REST corepressor 3 | 2 | 1 |
| 259266 | ASPM | Abnormal spindle homolog | 2 | 0 | 9699 | RIMS2 | Synaptic membrane exocytosis 2 | 2 | 0 |
| 83858 | ATAD3B | ATPase, AAA domain 3B | 2 | 1 | 79890 | RIN3 | Ras and Rab interactor 3 | 2 | 0 |
| 9859 | CEP170 | KARP1 binding protein | 2 | 1 | 6092 | ROBO2 | Roundabout homolog 2 | 2 | 0 |
| 286234 | C9orf79 | Hypothetical protein | 2 | 0 | 9997 | SCO2 | Cyto. oxidase deficient homol. 2 | 2 | 0 |
| 79848 | CSPP1 | Centrosome, spindle pole protein | 2 | 0 | 221935 | SDK1 | Sidekick homolog 1 | 2 | 0 |
| 85440 | DOCK7 | Dedicator of cytokinesis 7 | 2 | 0 | 25956 | SEC31B | SEC31 homolog B | 2 | 0 |
| 159090 | FAM122B | Hypothetical protein | 2 | 0 | 10290 | SPEG | SPEG complex locus | 2 | 0 |
| 3312 | HSPA8 | Heat shock 70 protein 8 | 2 | 0 | 7277 | TUBA4A | Tubulin alpha 4A | 2 | 0 |
| 22807 | IKZF2 | IKAROS family Zn finger 2 | 2 | 0 | 7316 | UBC | Ubiquitin C | 2 | 0 |
| 3566 | IL4R | Interleukin 4 receptor | 2 | 0 | 7498 | XDH | Xanthine dehydrogenase | 2 | 0 |
| 23288 | IQCE | IQ motif containing E | 2 | 0 | 64131 | XYLT1 | Xylosyltransferase I | 2 | 0 |
| 3834 | KIF25 | Kinesin family member 25 | 2 | 0 | 23318 | ZCCHC11 | Zn finger CCHC domain 11 | 2 | 0 |
Current NCBI Entrez Gene number.
Current NCBI Entrez Gene symbol.
Descriptive name of encoded protein.
The number of unique peptides detected in the Myc-pulldown samples (M) and the control (C) samples. See Materials and Methods for definitions of enrichment. MYC was identified by a single peptide only in the M-samples and was not found in the C-samples. See Supplemental Table 2 for a summary of all purification experiments.
The limited number of multipeptide hits was likely due to the small amount of material present in the final Calmodulin Sepharose eluate. The TAP-tag and associated purification scheme employed here can be limited by serious inefficiencies and losses of material at several steps (www.proteomecenter.org/protocols/), which we were unable to overcome in spite of extensive optimization. Likewise, it was not possible to increase the amount of starting material (∼13 mg of nuclear extract) which could be recovered from −3 × 10⁸ cells grown on 32 15 cm plates (since we always grew and processed TAPMyc and HAMyc cells in parallel, one experiment involved the harvesting of 64 15 cm plates). We estimated that TAPMyc was present at ∼0.001% of total protein in the nuclear extract, and at ∼2% in the ∼3 µg of the final Calmodulin Sepharose eluate, for an enrichment of some 1,000–2,000-fold. We attempted to adapt the TAPMyc expressing cell lines to growth in liquid suspension but did not succeed. We also found that freezing at any point during the purification (including the cell pellets) resulted in the disruption of the interaction between Myc and Max, and hence the entire procedure, from cell harvest to elution from the Calmodulin Sepharose, had to be performed in a single run of some 36 hrs.
Single step purification and MS/MS analysis.
To overcome these problems and scale up the amount of protein needed for MS/MS analysis we eliminated the second affinity step (Calmodulin Sepharose) of the purification, and simply eluted TAPMyc complexes from the IgG Sepharose beads with low pH. This single step purification greatly reduced the time line and increased the yields, however, it also significantly reduced the enrichment. Our rationale was that without this sacrifice we could not obtain adequate amounts of material for MS/MS, and that MudPIT had the ability to resolve the much more complex protein mixtures. To increase the confidence of this approach, we performed four complete biological replicates (cells grown on separate occasions and processed independently all the way through MS/MS analysis). Because of the complexity these data are presented as supplemental online information (Sup. Table 1, also see Sup. Table 2 for summary of all experiments). Myc and Max were enriched in all the replicates. Combined between all four replicates, this approach resulted in the detection of 5,603 proteins. 3,832 were identified with a single peptide only, and 320 were specifically enriched in the TAPMyc sample.
SILAC, single step purification and MS/MS analysis.
To decrease the technical variability between replicate analyses, we obtained quantitative MS data using SILAC, which allows experimental and reference cells to be mixed, processed and analyzed as a single combined sample. Cultures were grown for at least six generations in “heavy” medium (Invitrogen) supplemented with dialyzed serum, [U-13C6]-L-lysine and [U-13C6]-L-arginine. Control cultures were grown under identical conditions except that “light” lysine and arginine were used for supplementation. Cells grown in light and heavy media were mixed in equal proportions prior to the preparation of extracts to ensure that all biochemical procedures were applied equivalently to both (Fig. 5). Extracts were subjected to the one step purification, MudPIT and MS/MS analysis as described above. Four independent biological replicates were performed. In three experiments HAMyc cells were grown in heavy media and TAPMyc cells in light media; in the fourth the label was switched. The combined data from all replicates resulted in the detection of 722 proteins. 212 were identified with a single peptide only, and 87 were specifically enriched in the TAPMyc sample (Table 2; also see Sup. Table 2 for summary of all experiments). As in the label-free experiments, Myc and Max were detected with multiple peptides in all experiments and were specifically enriched only in TAPMyc samples.
Figure 5.
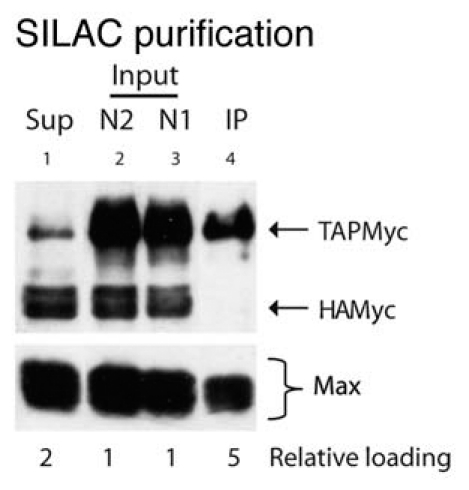
Single-step purification of TAPMyc complexes. TAPMyc and HAMyc cells, grown in light and heavy media respectively, were pooled in equal proportions and subjected to the Evan and Hancock nuclear extraction. Samples were analyzed by immunoblotting; the relevant proteins are identified in the right margin. Lane 1 (Sup), nuclear extract after pulldown with IgG beads; lanes 2 and 3 (N1 and N2), nuclei were extracted twice and the fractions were pooled as the starting material (Input) for the purification; lane 4 (IP), after pulldown the IgG beads were washed and an aliquot was boiled in sample buffer to remove bound Myc complexes (note efficient pulldown of Max, and lack of pulldown of HAMyc). The numbers shown below the parts indicate the relative loading of the individual lanes in comparison to the input.
Table 2.
Summary of the one-step purification SILAC experiments1
| GeneID2 | Symbol3 | Protein name4 | Exp. #5 | Pept. #6 | GeneID2 | Symbol3 | Protein name4 | Exp. #5 | Pept. #6 | ||||
| M | C | M | C | M | C | M | C | ||||||
| 871 | SERPINH1 | Serpin peptidase inhibitor | 4 | 0 | 81 | 3 | 5939 | RBMS2 | ssRNA/DNA binding prot. 2 | 2 | 0 | 3 | 0 |
| 4000 | LMNA | Lamin A/C | 4 | 0 | 72 | 12 | 10643 | IGF2BP3 | IGF-2 mRNA binding prot. 3 | 2 | 0 | 3 | 0 |
| 3315 | HSPB1 | Heat shock 27 protein 1 | 4 | 0 | 53 | 4 | 51094 | ADIPOR1 | Adiponectin receptor 1 | 2 | 0 | 2 | 0 |
| 2316 | FLNA | Filamin A, alpha | 4 | 0 | 30 | 0 | 24148 | PRPF6 | pre-mRNA process. factor 6 | 2 | 0 | 2 | 0 |
| 51726 | DNAJB11 | DnaJ (Hsp40) homolog | 4 | 0 | 28 | 9 | 861 | RUNX1 | Runt-related transc. factor 1 | 2 | 0 | 2 | 0 |
| 70 | ACTC1 | Cardiac actin alpha1 | 4 | 0 | 26 | 1 | 865 | CBFB | Core binding factor β sub. | 2 | 0 | 2 | 0 |
| 4149 | MAX | Myc associated factor X | 4 | 0 | 21 | 0 | 54788 | DNAJB12 | Hsp40 homolog, fam. B, 12 | 2 | 0 | 2 | 0 |
| 302 | ANXA2 | Annexin A2 | 4 | 0 | 19 | 1 | 2117 | ETV3 | ETS variant 3 | 2 | 0 | 2 | 0 |
| 2335 | FN1 | Fibronectin 1 | 4 | 0 | 16 | 2 | 8061 | FOSL1 | Fos-like antigen 1 | 2 | 0 | 2 | 0 |
| 112464 | PRKCDBP | PKCδ binding protein | 4 | 0 | 13 | 2 | 80097 | MZT2B | Mitotic spindle org. prot. 2B | 2 | 0 | 2 | 0 |
| 3956 | LGALS1 | Lectin, galactose binding 1 | 4 | 0 | 11 | 0 | 55183 | RIF1 | Rap1 interacting factor 1 | 2 | 0 | 2 | 0 |
| 3516 | RBPJ | IgκJ recombination protein | 4 | 0 | 9 | 4 | 5954 | RCN1 | Reticulocalbin 1 | 2 | 0 | 2 | 0 |
| 54927 | CHCHD3 | CHCH domain containing 3 | 4 | 0 | 6 | 0 | 51065 | RPS27L | Ribosomal protein S27-like | 2 | 0 | 2 | 0 |
| 23753 | SDF2L1 | Stromal cell factor 2-like 1 | 3 | 0 | 24 | 0 | 7018 | TF | Transferrin | 2 | 0 | 2 | 0 |
| 3303 | HSPA1A | Heat shock 70 protein 1A | 3 | 1 | 20 | 8 | 801 | CALM1 | Calmodulin | 1 | 0 | 3 | 0 |
| 4841 | NONO | Non-pou domain Oct binding | 3 | 1 | 20 | 11 | 55914 | ERBB2IP | Erbb2 interacting protein | 1 | 0 | 3 | 0 |
| 4904 | YBX1 | Y box binding protein 1 | 3 | 0 | 18 | 1 | 54814 | QPCTL | Glutaminyl-pept. cyclotrans. | 1 | 0 | 3 | 1 |
| 71 | ACTG1 | Actin, gamma1 | 3 | 0 | 17 | 2 | 23394 | ADNP | Act. dep. neuro homeobox | 1 | 0 | 2 | 1 |
| 7086 | TKT | Transketolase | 3 | 0 | 17 | 2 | 23193 | GANAB | Glucosidase α neutral AB | 1 | 0 | 2 | 0 |
| 1500 | CTNND1 | Catenin delta1 | 3 | 1 | 16 | 6 | 9551 | ATP5J2 | ATP synthase mito. sub. F2 | 1 | 0 | 2 | 0 |
| 6737 | TRIM21 | Tripartite motif-containing 21 | 3 | 0 | 14 | 1 | 817 | CANK2D | Calmodulin dep. kinase II δ | 1 | 0 | 2 | 0 |
| 7019 | TFAM | Mito. transcription factor A | 3 | 0 | 6 | 0 | 1503 | CTPS | CTP synthase | 1 | 0 | 2 | 0 |
| 4609 | MYC | c-Myc transcription factor | 3 | 0 | 6 | 1 | 10970 | CKAP4 | Cytoskeleton assoc. prot. 4 | 1 | 0 | 2 | 0 |
| 6938 | TCF12 | Transcription factor 12 | 3 | 1 | 6 | 3 | 4976 | OPA1 | Dymanin-like mito. protein | 1 | 0 | 2 | 0 |
| 27086 | FOXP1 | Forkhead box P1 | 3 | 0 | 5 | 0 | 57634 | EP400 | E1A binding protein p400 | 1 | 0 | 2 | 0 |
| 6525 | SMTN | Smoothelin | 3 | 1 | 5 | 1 | 23085 | ERC1 | Rab6-interact. CAST prot. 1 | 1 | 0 | 2 | 0 |
| 1937 | EEF1G | Transl. elongation factor 1γ | 3 | 0 | 4 | 0 | 9931 | HELZ | RNA helicase with Zn finger | 1 | 0 | 2 | 0 |
| 25915 | NDUFAF3 | Mito. complex I assembly 3 | 3 | 0 | 3 | 0 | 79035 | OBFC2B | ssDNA-binding fold protein 2B | 1 | 0 | 2 | 0 |
| 90102 | PHLDB2 | Pleckstrin homology B 2 | 3 | 0 | 3 | 0 | 116540 | MRPL53 | Mito. ribosomal protein L53 | 1 | 0 | 2 | 0 |
| 9472 | AKAP6 | PKA anchor protein 6 | 3 | 1 | 3 | 1 | 4720 | NDUFS2 | Mito. complex I Fe-S prot. 2 | 1 | 0 | 2 | 0 |
| 9425 | CDYL | Chromodomain Y-like | 3 | 1 | 3 | 1 | 7157 | TP53 | p53 tumor suppressor | 1 | 0 | 2 | 1 |
| 55819 | RNF130 | Ring finger protein 130 | 3 | 1 | 3 | 1 | 64175 | LEPRE1 | Prolyl-3-hydroxylase 1 | 1 | 0 | 2 | 0 |
| 6742 | SSBP1 | ssDNA-binding protein 1 | 2 | 0 | 8 | 0 | 5984 | RFC4 | Replication factor C4 | 1 | 0 | 2 | 1 |
| 1537 | CYC1 | Cytochrome C1 | 2 | 0 | 7 | 0 | 6137 | RPL13 | Ribosomal protein L13 | 1 | 0 | 2 | 0 |
| 9688 | NUP93 | Nucleoporin 93 kDa | 2 | 0 | 7 | 1 | 284119 | PTRF | RNA Pol I release factor | 1 | 0 | 2 | 1 |
| 5708 | PSMD2 | Proteasome 26S subunit 2 | 2 | 0 | 5 | 0 | 23677 | SH3BP4 | SH3 domain-binding prot. 4 | 1 | 0 | 2 | 0 |
| 7316 | UBC | Ubiquitin C | 2 | 0 | 5 | 0 | 6745 | SSR1 | Signal sequence receptor α | 1 | 0 | 2 | 0 |
| 60312 | AFAP1 | Actin associated protein 1 | 2 | 0 | 4 | 0 | 51295 | ECSIT | Drosophila Ecsit homolog | 1 | 0 | 2 | 0 |
| 10270 | AKAP8 | PKA anchor protein 8 | 2 | 0 | 4 | 0 | 10051 | SMC4 | SMC4 protein | 1 | 0 | 2 | 0 |
| 9260 | PDLIM7 | PDZ and LIM domain 7 | 2 | 0 | 4 | 0 | 7295 | TXN | Thioredoxin | 1 | 0 | 2 | 0 |
| 6726 | SRP9 | Signal recognition particle 9 | 2 | 0 | 4 | 2 | 7247 | TSN | Translin | 1 | 0 | 2 | 0 |
| 2274 | FHL2 | Four and half LIM domains 2 | 2 | 0 | 4 | 0 | 7277 | TUBA4A | Tubulin alpha 4A | 1 | 0 | 2 | 0 |
| 5917 | RARS | Arginyl-tRNA synthetase | 2 | 0 | 3 | 1 | 6631 | SNRPC | U1 snRNP protein C | 1 | 0 | 2 | 0 |
| 10521 | DDX17 | DEAD box polypeptide 17 | 2 | 0 | 3 | 1 | |||||||
Total yield from all four experiments combined.
Current NCBI Entrez Gene number.
Current NCBI Entrez Gene official symbol.
Descriptive name of encoded protein.
The number of experiments (out of a total of four) in which the protein was enriched in the Myc-pulldown samples (M) as opposed to the control (C) samples. See Materials and Methods for definitions of enrichment.
The sum of unique peptides detected in each experiment in the Myc-pulldown samples (M) and the control (C) samples. See Supplemental Table 2 for a summary of all purification experiments.
Discussion
We employed three distinct experimental approaches for the purification and identification of c-Myc complexes. All were based on the ectopic expression of a TAPMyc fusion protein in a human fibroblast cell line. We verified that the TAPMyc fusion protein we constructed was biologically active and that it conferred the expected phenotype in the cell line used for purification. Our first approach (designated two-step) employed tandem affinity purification on IgG beads followed by Calmodulin beads. In the second approach (designated label-free) we performed only one round of purification using IgG beads. In the third approach (designated SILAC) we added metabolic labeling with 13C lysine and arginine prior to the single-step purification on IgG beads. Four independent biological replicates were performed in both the label-free and SILAC series of experiments. All purifications were processed using MudPIT followed by MS/MS analysis.
We found 48 proteins to be specifically enriched in the two-step experiment (Table 1; also see Materials and Methods for definitions of enrichment), 320 proteins in the label-free experiments (Sup. Table 1) and 87 proteins in the SILAC experiments (Table 2). Removing Myc from these lists provides 418 non-redundant proteins as the combined total of putative c-Myc interactors identified in this study (Sup. Table 3). Our combined dataset of 418 proteins shares 27 proteins with the 220 protein dataset of Koch et al.9 (12% overlap) and six proteins with the 71 protein HPRD dataset of known c-Myc interactors.8 (8% overlap; Sup. Table 3). The overlaps between our three experimental datasets range from 8% to 29% (Fig. 6) with 5 proteins being common to all three datasets. Two (40%) of these proteins (MAX, TUBA4A) are found in both the HPRD and Koch et al. datasets. Three proteins (ERBB2IP, PRKCDBP, UBC) are novel interactors. Twenty-four additional proteins are shared by two datasets (Fig. 6 and Sup. Table 3), and among these are twenty novel interactors. Another useful way to evaluate the data is to consider the proteins that scored consistently in the biological replicates: 33 interactors were present in at least three out of four biological replicates in the label-free experiments (Sup. Table 1), and 31 proteins scored in that category in the SILAC experiments (Table 2). Of the 29 interactors shared between two (or more) experimental approaches, 14 (50%) were present in three (or more) biological replicates in the label-free or SILAC experiments, indicating that these top scoring hits are being repeatedly and consistently identified.
Figure 6.
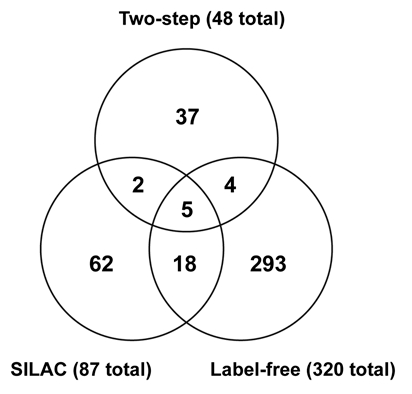
Venn diagram of the relationships between the two-step, label-free and SILAC series of experiments. The overlap between the two-step and label-free datasets is 9 proteins (19% of two-step), between the two-step and SILAC datasets 7 proteins (15% of two-step), and between the SILAC and label-free datasets 23 proteins (27% of SILAC). The two-step dataset shares 11 proteins with the other two datasets (23%), the label-free dataset shares 27 proteins with the other two datasets (8%) and the SILAC dataset shares 25 proteins with the other two datasets (29%). Five proteins were found in all datasets (MAX, ERBB2IP, PRKCDBP, TUBA4A, UBC), and 24 additional proteins were present in two out of three datasets (ACTC1, ADNP, CBFB, CEP170, CKAP4, DNAJB12, EP400, ETV3, FLNA, FN1, HSPB1, LGALS1, LMNA, PSMD2, PTRF, QPCTL, RAB11FIP5, RIMS2, RPS27L, RUNX1, SERPINH1, SMTN, TXN, XYLT1). Proteins not found in the HPRD or Koch et al. datasets are underlined.
Of the novel proteins present in all three experimental approaches, UBC encodes one of the polyubiquitin proteins encoded by the human genome. Rather than an interactor, it is likely that ubiquitin was identified by virtue of its covalent modification of a subset of c-Myc proteins. The ability to repeatedly obtain a signal from this small and transient pool of c-Myc molecules underscores the sensitivity of our methodologies. PSMD2 (a 26S proteasome regulatory subunit) was present among the proteins shared between two experimental approaches, and PSMA3 (a proteasomal subunit) and RNF130 (a E3 ubiquitin ligase) were identified in three out of four label-free and SILAC biological replicates, respectively. Koch et al.9 also identified a significant number of components in the proteasomal pathways, suggesting that TAP-tagged Myc proteins, like native c-Myc, are being targeted for degradation.
Of the remaining two novel interactors present in all three experimental approaches, ERBB2IP, also known as Erbin, is a protein containing 17 leucine-rich repeats and one PDZ domain that was identified as an interactor and regulator of the receptor tyrosine kinase ErbB2/Her2.26 Subsequently it was shown to affect the Ras signaling pathway by disrupting Ras-Raf interaction,27 and of relevance to c-Myc, interacting though its PDZ domain with several transcriptional regulators including β-catenin, c-Rel, Smad3 and HTLV-1 Tax.28–30 Little is known about the second novel interactor, PRKCDBP. This protein, also known as SRBC, was identified as a protein kinase C (PKC) δ binding protein and in vitro substrate that contains a leucine zipper-like motif and two PEST sequences.31 The most abundant literature on SRBC implicates it as a tumor suppressor gene frequently methylated in a variety of human cancers.32–36 Recently, SRBC was identified as a caveolin-1 adapter molecule.37 Interestingly, SRBC was represented by multiple peptides in all four SILAC biological replicates, and PTRF, a protein related to SRBC and likewise a caveolin-1 adapter, was present in two of our three experimental approaches as a c-Myc interactor (Sup. Table 3). It is tempting to speculate that intracellular trafficking mediated by caveolae membranes is involved in regulating c-Myc activity; along similar lines, caveolin-1 was recently implicated in activating p53.38
Of the 29 c-Myc interactors identified in two (or more) of our three experimental approaches (Sup. Table 3), 8 (28%) are cytoskeletal proteins. Three major categories of filamentous proteins were present: actins, lamins and tubulins. Multiple tubulins are documented as c-Myc interactors in HPRD, and association with lamin A (LMNA) and beta actin (ACTB) has been reported in the literature.9,39 We found TUBA4A in all three of our experimental approaches, and LMNA and ACTC1 in two. LMNA and ACTG1 were present in three SILAC biological replicates, and TUBB6 in three replicates of the label-free experiments. In addition, numerous cytoskeleton associated proteins, such as filamin (FLNA), microtubule associated proteins (CEP55, CEP170, MAP1A) and others were identified. LMNA is known to functionally interact with several transcription factors and chromatin associated proteins,40 and many of the other identified proteins have nuclear as well as cytoplasmic localizations and roles. However, a number of reports over the years have implied cytoplasmic roles for the c-Myc protein, and recently a calpain protease generated fragment of c-Myc, Myc-Nick, has been identified as a microtubule-binding protein involved in promoting tubulin acetylation and cytoplasmic reorganization.41 In light of this discovery, our finding of several endoplasmic reticulum and vessicle-associated proteins, including several RAB GTPases involved in intracellular vessicular transport, is of heightened interest.
Not surprisingly, a major category of c-Myc interactors were transcription factors and chromatin-associated proteins, including ADNP, CDYL, ETV3, FOXP1, NONO, PTRF, RUNX1, TCF12, YBX1 (7 of 29 or 24%, identified in two or more of our experimental approaches, Sup. Table 3). Of the novel interactors identified here, RUNX1 (also known as Acute Myeloid Leukemia 1 Oncogene, AML1), is important in coordinating the expression of numerous cell cycle regulators. RUNX1 interacts with several transcription cofactors, including the histone acetylase p300 (EP300) and the CREB-binding protein (CREBBP, also known as CBP), both of which have also been reported to interact with c-Myc.42,43 Furthermore, the RUNX1 regulatory subunit CBFB was identified in two of our experimental approaches, making this an interesting topic for further studies.
We also performed a Gene Ontology (GOstat) analysis44 on the entire list of 418 non-redundant proteins identified in this study (Sup. Tables 4–6). In the Cellular Compartment ontology (Sup. Table 4) nucleus was most highly enriched, but was followed closely by the cytoplasm, and interestingly, the mitochondrion (the preparation of nuclei we used, namely gentle lysis of cytoplasmic membranes with NP40, only provides an enrichment, and hence some cytoplasmic components were present in the extracts used for purification). Both the microtubule cytoskeleton and actin cytoskeleton were significantly enriched. A variety of cytoplasmic vesicles were also enriched. In the Biological Process ontology (Sup. Table 5), transcription was the most highly enriched, followed by the cell cycle. Also highly enriched were DNA processes such as replication, repair and chromatin modification, followed by cytoskeletal processes such as cellular trafficking and localization, and cell stress and death responses including apoptosis. In the Molecular Function ontology (Sup. Table 6), the most highly enriched categories were nucleotide/ATP binding. Also highly enriched were nucleic acid/RNA/DNA binding, transcription factor biding and a variety of transcription associated activities. Cytoskeletal protein binding, helicase activity and a variety of metabolic activities were also significantly enriched. This analysis is highly consistent with c-Myc being predominantly a nuclear protein that interacts with numerous proteins involved with transcription and chromatin organization. The strong enrichment for cell cycle and apoptosis is consistent with those known functions of c-Myc. The interaction with the cytoskeleton is also prominent and recently supported by direct experimental evidence.41 Not documented to date but of note are the enrichments for the mitochondrion and cytoplasmic vessicles, the latter of which may be relevant to the interaction of c-Myc with PRKCDBP (SRBC, above), a component of caveolae. We also performed an enrichment analysis for interacting protein domains,45 in which the PDZ domain was the top hit (Sup. Table 7). Interaction of c-Myc with PDZ domains has not been previously noted, and may be relevant for its interaction with ERBB2IP (above), a candidate found in all three of our experimental approaches.
Considering our most highly purified c-Myc complexes (two-step purification, Fig. 4) it is interesting to note that no interacting protein, other than Max, was as abundant as c-Myc (in Fig. 4 Max is obscured by the contaminating IgG light chains, but immunoblotting experiments indicate that it co-purifies with c-Myc in roughly stoichiometric amounts). Koch et al.9 observed a similar lack of equivalently staining bands in two separate purifications. Taken together, these data suggest that c-Myc is not found predominantly in a single, multi-component complex, such as, for example, the SAGA complex,46 components of which have been shown to interact with c-Myc.6 The patterns of purification observed by us and Koch et al.9 are more consistent with c-Myc molecules being dispersed among multiple macromolecular complexes. A corollary of this interpretation, also consistent with the very low expression levels of c-Myc, is that the macromolecular complexes that interact with c-Myc contain the protein in very small amounts.
Size exclusion chromatography (Figs. 1 and 3) also indicated that c-Myc is found predominantly in large (>1 mDa) macromolecular complexes. The resolution of this method in this size range is not adequate to determine the number of distinct complexes that may be present. A minor peak was seen in the 200–300 kDa range, and essentially no signal was seen in the region of Myc/Max dimers. Max co-migrated with Myc under all conditions. Koch et al.9 used sucrose gradient sedimentation, and reported c-Myc in a large number of protein complexes with a broad range of molecular weights. They also observed c-Myc in a size range consistent with Myc/Max dimers. The latter discrepancy could be due to several factors. First, we prepared nuclear extracts whereas Koch et al. used whole cell extracts. Second, the levels of c-Myc overexpression were likely higher in the cell lines used by Koch et al. Third, the presence in c-Myc complexes of fibrous proteins with extended conformations, such as actin, tubulin or lamin, could anomalously affect our gel filtration elution profiles. Finally, Koch et al. used three cycles of freeze-thawing to promote the lysis of cells, whereas we observed that any freezing-thawing (of either cell pellets or extracts) caused considerable disruption of complexes in our hands. More importantly, however, both studies documented the presence of significant amounts of very large Myc-containing complexes that were relatively stable during the TAP procedure.
Given the involvement of c-Myc in diverse biological processes, and the several already reported interactions with large, multicomponent protein complexes, it is widely believed that the c-Myc interactome is vastly larger than currently documented. Only one prior report has used an unbiased, genome-wide proteomic approach for the identification of c-Myc-interacting proteins.9 Given the importance of c-Myc in human cancer, the paucity of such efforts reflect the biochemical challenges in working with c-Myc: its low abundance in the cell, its highly unstable nature, and its many interacting partners. The main advances of the study reported here are the use of high resolution, high mass accuracy LC/MS methods for the detection of peptides from c-Myc interacting proteins, and the application of SILAC labeling of proteins in vivo. To our knowledge this is the first study to employ SILAC to obtain quantitative data of the c-Myc interactome coupled with a stringent cut-off of 2% false discovery rate (FDR) for the identification of interacting proteins estimated by a decoy database search. The datasets presented here are highly consistent with prior studies, and greatly expand our knowledge of c-Myc interacting protein partners. This new information should significantly advance our understanding of this interesting and important master regulator.
Materials and Methods
Construction of Myc-Tap fusion proteins.
Mouse c-myc cDNA was PCR amplified with primers containing restriction sites for subsequent subcloning: ACT GAG TGA TCA CTA GGA AGA TCT CAT CCG GAA TTC ACC ATG CCC CTC AAC GTG AAC (forward) and GCT CCG CTC GAG GGC GTA CAA TTG TCG GCG TTA GGA TCC AGA GGT TTC GAA GCT GTT C (reverse; restriction sites underlined). To allow the introduction of a C-terminal TAP-tag the stop codon of c-myc was replaced with a BamHI site. This also changed the last amino acid of c-Myc from alanine to serine, which has previously been shown not to affect c-Myc activity.10 The amplified fragment was digested with BclI and XhoI and placed into the pWZL-Blast retroviral vector11 digested with BamHI and SalI. N- and C-terminal TAP-tag vectors, pZome1-N and pZome1-C,12 were obtained from EUROSCARF (http://web.uni-frankfurt.de/fb15/mikro/euroscarf). The TAP-tags were released from the pZome vectors using BamHI and EcoRI. To create the N- or C-terminal TAP-Myc fusion, the corresponding TAP-tag was ligated into the pWZL-Blast-Myc plasmid digested with BglII and EcoRI (for N-terminal fusion) or with BamHI and MfeI (for C-terminal fusion). The plasmids are referred as pWZL-Blast-TAPMyc for the N-terminal fusion and pWZL-Blast-MycTAP for the C-terminal fusion.
Cell lines and culture conditions.
LF1/TERT/LT/ST cells were derived from LF1,13 normal human diploid fibroblasts (HDF) by sequential introduction of human telomerase and simian virus 40 large T and small T antigens using retroviral vectors.11 Retrovirus vectors were packaged using the amphotropic Phoenix cell line obtained from G. Nolan (Stanford University) according to their recommended protocol (http://www.stanford.edu/group/nolan). LF1/TERT/LT/ST cells were infected with pWZL-Blast-TAPMyc and pWZL-Blast-MycTAP (this communication) and with pWZL-Blast-HAMyc11 and selected with three µg/ml of blasticidin. A second round of selection for vigorous anchorage independent growth was imposed by plating pools of drug resistant cells in soft agar,14 and clonal cell lines were established from large colonies. The resultant cell lines, all derivatives of LF1/TERT/LT/ST, are referred to as TAPMyc, MycTAP and HAMyc. TGR-1 is a hprt- subclone of the Rat-1 cell line.15 Homozygous knockout c-myc-/- cells were generated by gene targeting from the TGR-1 cell line,16 and a subclone designated HO15.19 was used for further experiments.
All HDF-derived cell lines were initially grown in Ham's F-10 medium supplemented with 15% fetal bovine serum in an atmosphere of 92.5% N2, 5% CO2 and 2.5% O2. For large scale biochemical experiments TAPMyc, MycTAP and HAMyc cells were later adapted to growth in Dulbecco's modified Eagle's medium (DMEM) supplemented with 10% cosmic serum (Hyclone). These, and all subsequent cell lines were cultured in air adjusted to 5% total CO2 content. Rat-1 derivatives were grown in DMEM supplemented with 10% calf serum. Phoenix cells were grown in DMEM supplemented with 10% heat-inactivated fetal bovine serum. All cultures were at 37°C. All media were supplemented with glutamine, penicillin and streptomycin. SILAC was performed as specified by the manufacturer (Invitrogen). Cultures were grown in SILAC medium using the Invitrogen MS10030 kit for at least six population doublings. The heavy amino acids used for the labeling were [U-13C6]-L-lysine (provided in the SILAC medium kit) and [U-13C6]-L-arginine (Invitrogen, MS10011).
Preparation of nuclear extracts.
Cells were grown in 15 cm dishes to 90% confluency, washed three times with ice cold phosphate buffered saline (PBS), and harvested by scraping into PBS on ice. A typical experiment used 35 plates, which yielded 4–5 ml of packed cell volume (PCV), or 1.5 × 10⁸ to 2 × 10⁸ cells. An aliquot of ∼106 cells was removed for immunoblotting. The remaining cells were centrifuged at 1,000 rpm for 5 min at 4°C and immediately processed for lysis and extraction. In SILAC experiments cells grown in heavy and light media were scraped in PBS as above, equal PCV of each were combined prior to lysis and extraction, and henceforth treated as a single sample. The PCV were verified to contain equivalent amounts of protein. Two lysis and extraction protocols were used (with minor modifications): Evan and Hancock (1985),17 and Dignam et al. (1983).18 In the Evan and Hancock protocol, cells were gently resuspended in three PCV of low salt buffer (100 mM HEPES pH 6.8, 5 mM KCl, 5 mM MgCl2 and 0.5% NP40, supplemented with protease and phosphatase inhibitors (1 µg/ml aprotinin, 1 µg/ml leupeptin, 1 mM PMSF, 10 mM β-glycerophosphate, 2 mM sodium orthovanadate) and incubated on ice for 10 min. Nuclei were pelleted by centrifugation as above (1,000 rpm for 5 min at 4°C), and the supernatant was saved as the cytoplasmic fraction. Nuclei were washed once in one PCV of low salt buffer, pelleted, and the supernatant was saved as the cytosolic wash. To lyse the nuclei, the pellet was resuspended in two PCV of high salt buffer (100 mM HEPES pH 6.8, 250 mM NaCl, 5 mM KCl, 5 mM MgCl2 and 0.5% NP40, supplemented with protease and phosphatase inhibitors) and incubated on ice for 30 min with occasional homogenizing using a syringe with a 25 gauge needle. The lysate was centrifuged as above, the supernatant was collected as the nuclear extract, and the residual insoluble material as the nuclear pellet. The nuclear extract was further centrifuged at 16,300 x g for 30 min at 4°C to remove aggregated proteins. At each step of the protocol a fraction equivalent of 106 starting cells was removed to monitor the efficiency of the extraction by immunoblotting. Extraction in the presence of DNase was performed as above except that 1 µl (2 units) of DNaseI (New England Biolabs, M0303) was added per 50 µl of high salt buffer. The extracts were used immediately for subsequent steps, since freezing and thawing resulted in some dissociation of Myc-Max complexes.
The steps of the Dignam et al. protocol were similar to those of the Evan and Hancock protocol with the exception of the buffer composition. Low salt buffer: 10 mM Tris pH 7.9, 1.5 mM MgCl2, 10 mM KCl, 0.5 mM DTT and 0.2 mM PMSF; high salt buffer: 20 mM Tris pH 7.9, 25% glycerol, 420 mM NaCl, 1.5 mM MgCl2, 0.2 mM EDTA, 0.5 mM DTT, 0.2 mM PMSF. After the high speed centrifugation to remove aggregates, the nuclear extract was dialyzed using a 10 kDa cut-off membrane against 20 mM Tris pH 7.9, 10% glycerol, 0.1 mM KCl, 0.2 mM EDTA, 10 mM β-mercaptoethanol and 0.2 mM PMSF, for five hours at 4°C with two changes of buffer. Dialyzed nuclear extract was further cleared by centrifugation at 16,300 x g for 30 min at 4°C and immediately used for subsequent steps.
Size exclusion chromatography.
Size exclusion chromatography was performed using a Superdex 200 column (Amersham Biosciences). Nuclear extracts prepared using the Evan and Hancock protocol were adjusted to 150 mM NaCl by dilution with 20 mM HEPES pH 6.8. The column buffer was 20 mM HEPES pH 6.8, 150 mM NaCl, 1 mM DTT, 0.5 mM EDTA and 0.1% NP40. For extracts prepared with the Dignam et al. protocol the column was equilibrated and run with dialysis buffer. The columns were run at 0.25 ml/min to 0.5 ml/min at 4°C on the GE Health Care/Amersham Biosciences fast protein liquid chromatography (FPLC) system. 250 µl fractions were collected and 90–100 µl of each fraction was analyzed by immunoblotting.
Immunoblotting.
Samples were separated by 10% SDS PAGE, electro transferred to PVDF membrane (Millipore), and processed using standard protocols.19 The primary antibodies were: HA, Covance (MMS-101P); c-Myc, Upstate (06-340); Max, Santa Cruz (sc-197). Horseradish peroxide (HRP)-conjugated secondary antibodies were obtained from Jackson Immuno Research. Chemiluminescence was detected using a kit from Pierce (34080).
TEV protease purification.
A bacterial expression construct of TEV protease was obtained from D. Waugh (National Cancer Institute, Frederick, MD). Cultures of 200 ml were grown at 37°C to an OD600 of 0.7, TEV protease expression was induced with 1 mM IPTG, and incubation was continued overnight at 18°C. Cells were collected by centrifugation and pellets were stored at −80°C. Lysis was performed by sonication using a Branson S-250D digital sonifier equipped with a 0.5 inch tip (4 min total time, 50% amplitude, 2 s on/8 s off cycles) in His-tag lysis buffer (50 mM Tris pH 8.0, 5 mM imidazole, 500 mM NaCl, 0.1% Triton-X 100 and protease inhibitors). The extracts were centrifuged at 40,000 x g for 35 min at 4°C to pellet debris and insoluble proteins. The cleared supernatant was used for TEV protease purification over a Ni-NTA column (Qiagen) using His-tag buffer A (50 mM Tris pH 8.0, 5 mM imidazole and 500 mM NaCl) for binding and washing, and His-tag buffer B (50 mM Tris pH 8.0, 500 mM imidazole and 500 mM NaCl) for elution. Fractions eluted from the Ni-NTA column were analyzed by SDS PAGE to identify the peak fractions of TEV protease, which were then pooled and dialyzed against buffer C (50 mM Tris pH 7.5, 1 mM EDTA and 5 mM DTT). After dialysis, the sample was again cleared by centrifugation, glycerol and Triton-X100 were added to 50% and 0.1% final concentrations, respectively, and aliquots were stored at −80°C.
TAP purification.
IgG sepharose beads (GE Health Care/Amersham Biosciences) were first washed with Evan and Hancock high salt buffer (without protease and phosphatase inhibitors), followed by three rounds of successive washes with low pH buffer (0.1 M NaC2H3O2 pH 4.0 and 0.5 M NaCl) and high pH buffer (0.1 M Tris pH 8.0 and 0.5 M NaCl). The beads were then washed once with high salt buffer, three times with 0.1 M glycine pH 2.5, and twice again with high salt buffer. Finally, the beads were equilibrated in high salt buffer (supplemented with protease and phosphatase inhibitors) and blocked overnight at 4°C using 1 mg/ml casein (Sigma, C6905-1G) in high salt buffer. Blocked IgG beads were incubated with nuclear extract for 2 h at 4°C with gentle rotation (50–60 µl of blocked beads were used per 1 mg of nuclear extract protein, 9–14 mg total protein was processed in a typical large scale purification, and the concentration of the extract was 1 mg/ml). The beads were washed three times with high salt buffer containing 1 mg/ml casein, followed by four washes with TEV protease reaction buffer (10 mM Tris pH 8.0, 150 mM NaCl, 0.1% NP40, 0.5 mM EDTA, 1 mM DTT and 1 mg/ml casein). All the washes were done for 5 min at 4°C with gentle rotation. IgG beads were then incubated with TEV protease in a 200 µl reaction volume per mg of protein overnight at 4°C. At the end of the reaction the beads were pelleted, the supernatant was collected, its volume was measured and CaCl2 was added to 3 mM (final concentration). The beads were washed three times with 1.5 to 2.4 ml (170 µl per 1 mg of input extract protein) of calmodulin binding (CB) buffer (10 mM Tris pH 8.0, 150 mM NaCl, 1 mM Mg-acetate, 1 mM imidazole, 2 mM CaCl2, 0.1% NP40 and 10 mM β-mercaptoethanol), the washes were added to the TEV supernatant, and this pooled fraction was then used for the subsequent calmodulin pulldown. Prior to use, Calmodulin Sepharose (Stratagene 214-303-52) were washed twice in CB buffer and once in CB buffer containing 1 mg/ml casein. 30–35 µl of calmodulin beads were used per 1 mg of starting nuclear extract, and were incubated with the pooled TEV supernatant for 2 hr at 4°C. The calmodulin beads were then washed once with CB buffer containing 1 mg/ ml casein, four times with CB buffer without casein, and twice with CB buffer without casein, NP40 and imidazole. After the final wash the beads were incubated in one bead volume of elution buffer (50 mM NH4HCO3 pH 8.5, 150 mM NaCl and 2 mM EGTA) for 15 min at room temperature. Two rounds of elution were done and combined. The eluted fractions were then analyzed in four ways: (1) estimation of total protein (Coomassie plus kit, Pierce 23236); (2) SDS-PAGE followed by silver staining (Pierce 24612); (3) SDS-PAGE followed by immunoblotting; and (4) mass spectrometry. Small aliquots were removed at each step of the purification and analyzed by immunoblotting for Myc and Max proteins to monitor their partitioning during the purification and to estimate the efficiency of recovery at each step. Concentration of the final EGTA eluted fraction for SDS-PAGE and silver stain analysis was done by centrifugal ultrafiltration (10 kDa cut-off Microcon, Millipore). To minimize protein loss due to sticking to the walls of the Microcon device, the concentrator was pretreated with a 5% solution of Tween-20, as recommended by the manufacturer.
For one-step purification based only on the protein A epitope of the TAP-tag, the pulldown using IgG beads was performed as described above. After incubation with nuclear extract, the beads were washed four times with Evan and Hancock high salt buffer supplemented with protease and phosphatase inhibitors, 1 mg/ml casein and 0.1% NP40, followed by three washes of the same buffer without protease and phosphatase inhibitors, casein and NP40. The bound proteins were eluted from the beads using one bead volume of 100 mM glycine pH 2.5 followed by one bead volume of 100 mM glycine pH 2.3. Each step of the elution was performed for 10 min. at room temperature. Eluted fractions were neutralized by adding 0.1 volumes of 1 M Tris pH 8.5 and pooled for subsequent mass spectrometry analysis.
Mass spectrometry analysis.
Starting sample volume was estimated, solid urea was added to a final concentration of 8 M, and the samples were incubated for 5 min at 95°C. The urea concentration was lowered to 4 M by dilution with 50 mM NH4HCO3 pH 8.5 for EGTA eluted fractions, or with 100 mM NH4HCO3 pH 8.5 for acid eluted fractions (to achieve a final concentration of 50 mM NH4HCO3 pH 8.5). Tryptic digestion was performed using 2.5 µg of trypsin (Promega 14005-858) overnight at 37°C. All these and subsequent steps were performed using 1.5 ml Sarstedt microfuge tubes (Fisher Scientific 50809205). After tryptic digestion the peptides were desalted using C-18 reverse phase columns (Michrom Bioresources, TR1/25109/52). The C-18 column was washed twice with 0.1% acetic acid/water, the peptide sample was brought to pH 3.0 using 1 M HCl, and loaded on the column. The column was washed twice with 0.1% acetic acid, the peptides were eluted with (7:3) acetonitrile: 0.1% acetic acid, and the eluted sample was dried using a speed vacuum apparatus. MudPIT separation20 employed a strong cation exchange (SCX) column for the first dimension separation and a C-18 reverse phase column for the second dimension separation. An in-house SCX column of polysulfoethyl A (300 Å, 5 µm) resin (Nest Group, PBMSE0503) was made in a fused silica capillary of 250 µm inner diameter (Polymicro Technologies 2000026). The resin was resuspended in methanol and loaded into the capillary using a high pressure chamber system “bomb” (http://fields.scripps.edu/mudpit/). The column was packed up to a length of 15–20 cm. After packing, the column was washed using the bomb with water for 30 min. and then with 0.2 M NaH2PO4, 0.3 M CH3COONa for 30 min. The column was then connected to the HPLC system Agilent Series 1100 quaternary pump, and washed with water for 45 min at the flow rate of 0.1 ml/min. To prepare the column, 200 pmol of bovine serum albumin (BSA) tryptic digest was bomb loaded onto the column, which was then washed with 1 M CH3COONa for 45 min. using the bomb. Finally, the column was washed using the HPLC pump as above.
To perform the SCX separation, a dried peptide sample was reconstituted in 0.1% acetic acid/water and loaded onto the column using the bomb. The nonretained fraction was collected to assay for efficiency of peptide binding to the column. The SCX column was then connected to the HPLC system and peptides were eluted using a 12-step salt gradient made by combining buffer A (30% acetonitrile, 5 mM NaH2PO4 pH 3.0) and buffer B (30% acetonitrile, 5 mM NaH2PO4 pH 3.0, 500 mM CH3COONH4). The 12 steps (low to high salt) contained the following proportions of buffer B: 0%, 2%, 4%, 6%, 8%, 10%, 12%, 14%, 16%, 18%, 20%, 50% and 100%. Each eluted fraction was dried and processed for the second dimension.
For reversed-phase analysis, an in-house C-18 reversed-phase pre-column and analytical column were used.21 Individual fractions from the SCX column were reconstituted in 0.1% acetic acid/water and loaded onto the reverse phase pre-column. The peptides were eluted using a 0–70% acetonitrile gradient over a period of 30 min. and separated on the analytical column with integrated 5 µm electrospray tip. The analytical column was connected on-line with a Thermo Finnigan hybrid ion trap Fourier transform (LTQ-FT) high resolution mass spectrometer, and tandem MS/MS spectra were acquired in real time. All the steps of reversed-phase analysis were performed in an automated fashion.21
MS/MS spectra were searched with the SEQUEST algorithm (version 27, revision 12) and assigned to peptide sequences from the NCBI non-redundant protein database sliced in Bioworks 3.1 for human proteins. Search parameters designated variable modifications of +79.9663 Da on Ser, Thr and Tyr for phosphorylation. Database identified peptides were filtered with Xcorr versus charge state. Only those peptides with a precursor mass error less than 20 ppm and Xcorr ≥ 1.5 (+1), 2 (+2) or 2.5 (≥ +3) were retained for further analysis. Peptides were quantified using inhouse developed software based on the ICIS algorithm within the Xcalibur XDK provided by ThermoFisher.
In label-free experiments peptides identified in various SCX fractions of one nuclear extract were combined into a single list. The lists of unique peptides for TAPMyc (sample) and HAMyc (control) extracts were compared to one another to compute the fold-enrichment of peptides in one sample versus the other. A peptide was considered to be enriched in the sample if its peak area was ≥ 2 in sample relative to control, and enriched in the control if its peak area was ≥ 2 in control relative to sample. Peptides with enrichments less than two-fold in either direction were not used for further analysis. A given protein was considered to be specifically enriched in the sample if greater than 50% of its detected peptides were enriched in sample versus control. Results from four individual biological replicates were combined to identify the proteins that were enriched in at least three of the four replicates.
Similar to the label-free experiments, in SILAC experiments only peptides assigned by SEQUEST with a precursor mass error of 20 ppm or less were considered. Additional variable modifications of +6.0201 Da on Lys and Arg were specified for the SILAC samples. A cut-off of 2% false discovery rate (FDR) estimated by decoy database search22 was also applied by constraining the logistic spectral score23 for the dataset. The ratio of selected ion chromatogram peak areas for sample versus control peptide pairs, of a given sequence and charge, were used to compute a SILAC peak area ratio. Peptides with a SILAC peak area ratio (sample/control) > 1.3 were considered enriched in the sample, and those with peak area ratio (control/sample) > 1.3 were considered enriched in the control. All peptides with enrichments less than 1.3-fold in either direction were discarded. Peptides for which one of the selected ion chromatograms (heavy or light) was not discernable above background but the other was present with a signal-to-noise ratio of 1.3:1 were also considered enriched. As above, a given protein was considered to be enriched if > 50% of its detected peptides were enriched in sample versus control. Four biological replicates were performed and analyzed by this process to score the number of replicates in which a given protein was enriched in sample versus control.
Acknowledgements
This work was supported in part by NIH/NIGMS grant R01 GM040960 and NIH/NIA grant R37 AG016694 to J.M.S. A.R.S. was supported in part by the COBRE award from the NIH/NCRR P20 RR015578. The Genomics Core Facility in the Laboratories for Molecular Medicine at Brown University was supported in part by the COBRE award from the NIH/NCRR P20 RR015578. J.M.S. is a Senior Scholar of the Ellison Medical Foundation.
Footnotes
Previously published online: www.landesbioscience.com/journals/cc/article/14199
Supplementary Material
References
- 1.Meyer N, Penn LZ. Reflecting on 25 years with MYC. Nat Rev Cancer. 2008;8:976–990. doi: 10.1038/nrc2231. [DOI] [PubMed] [Google Scholar]
- 2.Albihn A, Johnsen JI, Henriksson MA. MYC in oncogenesis and as a target for cancer therapies. Adv Cancer Res. 2010;107:163–224. doi: 10.1016/S0065-230X(10)07006-5. [DOI] [PubMed] [Google Scholar]
- 3.Dai MS, Jin Y, Gallegos JR, Lu H. Balance of Yin and Yang: ubiquitylation-mediated regulation of p53 and c-Myc. Neoplasia. 2006;8:630–644. doi: 10.1593/neo.06334. [DOI] [PMC free article] [PubMed] [Google Scholar]
- 4.Ponzielli R, Katz S, Barsyte-Lovejoy D, Penn LZ. Cancer therapeutics: Targeting the dark side of Myc. Eur J Cancer. 2005;41:2485–2501. doi: 10.1016/j.ejca.2005.08.017. [DOI] [PubMed] [Google Scholar]
- 5.Cole MD, Cowling VH. Transcription-independent functions of MYC: Regulation of translation and DNA replication. Nat Rev Mol Cell Biol. 2008;9:810–815. doi: 10.1038/nrm2467. [DOI] [PMC free article] [PubMed] [Google Scholar]
- 6.Cowling VH, Cole MD. Mechanism of transcriptional activation by the Myc oncoproteins. Semin Cancer Biol. 2006;16:242–252. doi: 10.1016/j.semcancer.2006.08.001. [DOI] [PubMed] [Google Scholar]
- 7.Kleine-Kohlbrecher D, Adhikary S, Eilers M. Mechanisms of transcriptional repression by Myc. Curr Top Microbiol Immunol. 2006;302:51–62. doi: 10.1007/3-540-32952-8_3. [DOI] [PubMed] [Google Scholar]
- 8.Mathivanan S, Periaswamy B, Gandhi TK, Kandasamy K, Suresh S, Mohmood R, et al. An evaluation of human protein-protein interaction data in the public domain. BMC Bioinform. 2006;7:19. doi: 10.1186/1471-2105-7-S5-S19. [DOI] [PMC free article] [PubMed] [Google Scholar]
- 9.Koch HB, Zhang R, Verdoodt B, Bailey A, Zhang CD, Yates JR, 3rd, et al. Large-scale identification of c-MYC-associated proteins using a combined TAP/MudPIT approach. Cell Cycle. 2007;6:205–217. doi: 10.4161/cc.6.2.3742. [DOI] [PubMed] [Google Scholar]
- 10.Littlewood TD, Hancock DC, Danielian PS, Parker MG, Evan GI. A modified oestrogen receptor ligandbinding domain as an improved switch for the regulation of heterologous proteins. Nucleic Acids Res. 1995;23:1686–1690. doi: 10.1093/nar/23.10.1686. [DOI] [PMC free article] [PubMed] [Google Scholar]
- 11.Wei W, Jobling WA, Chen W, Hahn WC, Sedivy JM. Abolition of cyclin-dependent kinase inhibitor p16Ink4a and p21Cip1/Waf1 functions permits Ras-induced anchorage-independent growth in telomerase-immortalized human fibroblasts. Mol Cell Biol. 2003;23:2859–2870. doi: 10.1128/MCB.23.8.2859-2870.2003. [DOI] [PMC free article] [PubMed] [Google Scholar]
- 12.Rigaut G, Shevchenko A, Rutz B, Wilm M, Mann M, Seraphin B. A generic protein purification method for protein complex characterization and proteome exploration. Nat Biotechnol. 1999;17:1030–1032. doi: 10.1038/13732. [DOI] [PubMed] [Google Scholar]
- 13.Brown JP, Wei W, Sedivy JM. Bypass of senescence after disruption of p21CIP1/WAF1 gene in normal diploid human fibroblasts. Science. 1997;277:831–834. doi: 10.1126/science.277.5327.831. [DOI] [PubMed] [Google Scholar]
- 14.Bazarov AV, Adachi S, Li SF, Mateyak MK, Wei S, Sedivy JM. A modest reduction in c-myc expression has minimal effects on cell growth and apoptosis but dramatically reduces susceptibility to Ras and Raf transformation. Cancer Res. 2001;61:1178–1186. [PubMed] [Google Scholar]
- 15.Prouty SM, Hanson KD, Boyle AL, Brown JR, Shichiri M, Follansbee MR, et al. A cell culture model system for genetic analyses of the cell cycle by targeted homologous recombination. Oncogene. 1993;8:899–907. [PubMed] [Google Scholar]
- 16.Mateyak MK, Obaya AJ, Adachi S, Sedivy JM. Phenotypes of c-Myc-deficient rat fibroblasts isolated by targeted homologous recombination. Cell Growth Differ. 1997;8:1039–1048. [PubMed] [Google Scholar]
- 17.Evan GI, Hancock DC. Studies on the interaction of the human c-myc protein with cell nuclei: p62c-myc as a member of a discrete subset of nuclear proteins. Cell. 1985;43:253–261. doi: 10.1016/0092-8674(85)90030-3. [DOI] [PubMed] [Google Scholar]
- 18.Dignam JD, Martin PL, Shastry BS, Roeder RG. Eukaryotic gene transcription with purified components. Meth Enzymol. 1983;101:582–598. doi: 10.1016/0076-6879(83)01039-3. [DOI] [PubMed] [Google Scholar]
- 19.Harlow E, Lane D. Antibodies: A Laboratory Manual. Cold Spring Harbor Laboratory Press; 1988. [Google Scholar]
- 20.Washburn MP, Wolters D, Yates JR., 3rd Large-scale analysis of the yeast proteome by multidimensional protein identification technology. Nat Biotechnol. 2001;19:242–247. doi: 10.1038/85686. [DOI] [PubMed] [Google Scholar]
- 21.Ficarro SB, Salomon AR, Brill LM, Mason DE, Stettler-Gill M, Brock A, et al. Automated immobilized metal affinity chromatography/nano-liquid chromatography/electrospray ionization mass spectrometry platform for profiling protein phosphorylation sites. Rapid Commun Mass Spectrom. 2005;19:57–71. doi: 10.1002/rcm.1746. [DOI] [PubMed] [Google Scholar]
- 22.Elias JE, Gygi SP. Target-decoy search strategy for increased confidence in large-scale protein identifications by mass spectrometry. Nat Methods. 2007;4:207–214. doi: 10.1038/nmeth1019. [DOI] [PubMed] [Google Scholar]
- 23.Yu K, Sabelli A, DeKeukelaere L, Park R, Sindi S, Gatsonis CA, et al. Integrated platform for manual and high-throughput statistical validation of tandem mass spectra. Proteomics. 2009;9:3115–3125. doi: 10.1002/pmic.200800899. [DOI] [PMC free article] [PubMed] [Google Scholar]
- 24.Mateyak MK, Obaya AJ, Sedivy JM. c-Myc regulates cyclin D-Cdk4 and -Cdk6 activity but affects cell cycle progression at multiple independent points. Mol Cell Biol. 1999;19:4672–4683. doi: 10.1128/mcb.19.7.4672. [DOI] [PMC free article] [PubMed] [Google Scholar]
- 25.Schorl C, Sedivy JM. Loss of protooncogene c-Myc function impedes G1 phase progression both before and after the restriction point. Mol Biol Cell. 2003;14:823–835. doi: 10.1091/mbc.E02-10-0649. [DOI] [PMC free article] [PubMed] [Google Scholar]
- 26.Borg JP, Marchetto S, Le Bivic A, Ollendorff V, Jaulin-Bastard F, Saito H, et al. ERBIN: A basolateral PDZ protein that interacts with the mammalian ERBB2/HER2 receptor. Nat Cell Biol. 2000;2:407–414. doi: 10.1038/35017038. [DOI] [PubMed] [Google Scholar]
- 27.Dai P, Xiong WC, Mei L. Erbin inhibits RAF activation by disrupting the sur-8-Ras-Raf complex. J Biol Chem. 2006;281:927–933. doi: 10.1074/jbc.M507360200. [DOI] [PubMed] [Google Scholar]
- 28.Ress A, Moelling K. Interaction partners of the PDZ domain of erbin. Protein Pept Lett. 2006;13:877–881. doi: 10.2174/092986606778256126. [DOI] [PubMed] [Google Scholar]
- 29.Deliot N, Chavent M, Nourry C, Lecine P, Arnaud C, Hermant A, et al. Biochemical studies and molecular dynamics simulations of Smad3-Erbin interaction identify a non-classical Erbin PDZ binding. Biochem Biophys Res Commun. 2009;378:360–365. doi: 10.1016/j.bbrc.2008.10.175. [DOI] [PubMed] [Google Scholar]
- 30.Dai F, Chang C, Lin X, Dai P, Mei L, Feng XH. Erbin inhibits transforming growth factor beta signaling through a novel Smad interacting domain. Mol Cell Biol. 2007;27:6183–6194. doi: 10.1128/MCB.00132-07. [DOI] [PMC free article] [PubMed] [Google Scholar]
- 31.Izumi Y, Hirai S, Tamai Y, Fujise-Matsuoka A, Nishimura Y, Ohno S. A protein kinase Cdelta-binding protein SRBC whose expression is induced by serum starvation. J Biol Chem. 1997;272:7381–7389. doi: 10.1074/jbc.272.11.7381. [DOI] [PubMed] [Google Scholar]
- 32.Tong SY, Ki KD, Lee JM, Kang MJ, Ha TK, Chung SI, et al. Frequent inactivation of hSRBC in ovarian cancers by promoter CpG island hypermethylation. Acta Obstet Gynecol Scand. 2010;89:629–635. doi: 10.3109/00016341003678443. [DOI] [PubMed] [Google Scholar]
- 33.Davidsson J, Lilljebjorn H, Andersson A, Veerla S, Heldrup J, Behrendtz M, et al. The DNA methylome of pediatric acute lymphoblastic leukemia. Hum Mol Genet. 2009;18:4054–4065. doi: 10.1093/hmg/ddp354. [DOI] [PubMed] [Google Scholar]
- 34.Lee JH, Byun DS, Lee MG, Ryu BK, Kang MJ, Chae KS, et al. Frequent epigenetic inactivation of hSRBC in gastric cancer and its implication in attenuated p53 response to stresses. Int J Cancer. 2008;122:1573–1584. doi: 10.1002/ijc.23166. [DOI] [PubMed] [Google Scholar]
- 35.Zochbauer-Muller S, Fong KM, Geradts J, Xu X, Seidl S, End-Pfutzenreuter A, et al. Expression of the candidate tumor suppressor gene hSRBC is frequently lost in primary lung cancers with and without DNA methylation. Oncogene. 2005;24:6249–6255. doi: 10.1038/sj.onc.1208775. [DOI] [PubMed] [Google Scholar]
- 36.Xu XL, Wu LC, Du F, Davis A, Peyton M, Tomizawa Y, et al. Inactivation of human SRBC, located within the 11p15.5-p15.4 tumor suppressor region, in breast and lung cancers. Cancer Res. 2001;61:7943–7949. [PubMed] [Google Scholar]
- 37.McMahon KA, Zajicek H, Li WP, Peyton MJ, Minna JD, Hernandez VJ, et al. SRBC/cavin-3 is a caveolin adapter protein that regulates caveolae function. EMBO J. 2009;28:1001–1015. doi: 10.1038/emboj.2009.46. [DOI] [PMC free article] [PubMed] [Google Scholar]
- 38.Bartholomew JN, Volonte D, Galbiati F. Caveolin-1 regulates the antagonistic pleiotropic properties of cellular senescence through a novel Mdm2/p53-mediated pathway. Cancer Res. 2009;69:2878–2886. doi: 10.1158/0008-5472.CAN-08-2857. [DOI] [PMC free article] [PubMed] [Google Scholar]
- 39.Park J, Wood MA, Cole MD. BAF53 forms distinct nuclear complexes and functions as a critical c-Myc-interacting nuclear cofactor for oncogenic transformation. Mol Cell Biol. 2002;22:1307–1316. doi: 10.1128/mcb.22.5.1307-1316.2002. [DOI] [PMC free article] [PubMed] [Google Scholar]
- 40.Andres V, Gonzalez JM. Role of A-type lamins in signaling, transcription, and chromatin organization. J Cell Biol. 2009;187:945–957. doi: 10.1083/jcb.200904124. [DOI] [PMC free article] [PubMed] [Google Scholar]
- 41.Conacci-Sorrell M, Ngouenet C, Eisenman RN. Mycnick: A cytoplasmic cleavage product of Myc that promotes alpha-tubulin acetylation and cell differentiation. Cell. 2010;142:480–493. doi: 10.1016/j.cell.2010.06.037. [DOI] [PMC free article] [PubMed] [Google Scholar]
- 42.Faiola F, Liu X, Lo S, Pan S, Zhang K, Lymar E, et al. Dual regulation of c-Myc by p300 via acetylationdependent control of Myc protein turnover and coactivation of Myc-induced transcription. Mol Cell Biol. 2005;25:10220–10234. doi: 10.1128/MCB.25.23.10220-10234.2005. [DOI] [PMC free article] [PubMed] [Google Scholar]
- 43.Vervoorts J, Luscher-Firzlaff JM, Rottmann S, Lilischkis R, Walsemann G, Dohmann K, et al. Stimulation of c-MYC transcriptional activity and acetylation by recruitment of the cofactor CBP. EMBO Rep. 2003;4:484–490. doi: 10.1038/sj.embor.embor821. [DOI] [PMC free article] [PubMed] [Google Scholar]
- 44.Beissbarth T, Speed TP. GOstat: Find statistically over-represented Gene Ontologies within a group of genes. Bioinformatics. 2004;20:1464–1465. doi: 10.1093/bioinformatics/bth088. [DOI] [PubMed] [Google Scholar]
- 45.Huang da W, Sherman BT, Lempicki RA. Systematic and integrative analysis of large gene lists using DAVID bioinformatics resources. Nat Protoc. 2009;4:44–57. doi: 10.1038/nprot.2008.211. [DOI] [PubMed] [Google Scholar]
- 46.Nagy Z, Tora L. Distinct GCN5/PCAF-containing complexes function as co-activators and are involved in transcription factor and global histone acetylation. Oncogene. 2007;26:5341–5357. doi: 10.1038/sj.onc.1210604. [DOI] [PubMed] [Google Scholar]
Associated Data
This section collects any data citations, data availability statements, or supplementary materials included in this article.