

Abstract
Background
CRT has been shown to be beneficial in the majority of patients with NYHA class III–IV symptoms, prolonged QRS duration, and an EF ≤35%. The use of imaging modalities to quantify dyssynchrony may help identify patients who may benefit from CRT, but do not meet current selection criteria. We hypothesize that patients with mild-to-moderate LV dysfunction have significant degrees of mechanical dyssynchrony.
Methods
We compared phase analysis measures of mechanical dyssynchrony from gated SPECT imaging in patients with mild-to-moderate LV dysfunction (EF 35–50%, n = 93), with patients with severe LV dysfunction (EF ≤ 35%, n = 167), and with normal controls (EF ≥ 55%, n = 75). Furthermore, we evaluated the relationships between QRS duration and dyssynchrony and determined the prevalence of dyssynchrony in patients with mild-moderate LV dysfunction.
Results
Patients with mild-moderate LV dysfunction have more dyssynchrony than normal controls (phase SD 37.7° vs 8.8°, P < .001 and bandwidth 113.5° vs 28.7°, P < .001), but less dyssynchrony than patients with severe LV dysfunction (phase SD 37.7° vs 52.0°, P < .001 and bandwidth 113.5° vs 158.2°, P < .001). In the cohort of patients with LV EF 35–50%, there were only weak correlations between QRS duration and dyssynchrony (phase SD, r = 0.28 and bandwidth, r = 0.20). There were 73 patients with LVEF 35–50% and QRS duration <120 milliseconds of which 21 (28.8%) had mechanical dyssynchrony. Overall, 37% of patients with mild-to-moderate LV dysfunction had significant degrees of mechanical dyssynchrony.
Conclusions
This is the largest reported study evaluating mechanical dyssynchrony in patients with mild-moderate LV dysfunction using phase analysis of gated SPECT imaging. In this study, approximately one-third of patients with mild-to-moderate LV dysfunction had significant LV mechanical dyssynchrony. With further study, phase analysis of gated SPECT imaging may help improve patient selection for CRT.
Keywords: Mechanical dyssynchrony, cardiac resynchronization therapy, heart failure, SPECT imaging
INTRODUCTION
Cardiac resynchronization therapy (CRT) is approved for the treatment of heart failure (HF) patients with New York Heart Association (NYHA) class III or IV symptoms, a left ventricular (LV) ejection fraction (EF) ≤35%, and a QRS duration ≥120 milliseconds. Studies have shown improvements in quality of life, functional class, exercise capacity, EF, and mortality for patients who receive CRT in addition to optimal medical therapy.1–4
However, approximately 30% of patients fail to benefit from CRT using current guideline criteria for patient selection.5,6 The reasons for failing to respond to CRT can be complex and can include incomplete background medical therapy, patient noncompliance, suboptimal AV timing, underlying arrhythmia, poor LV lead positioning, and persistent mechanical dyssynchrony.7 Studies have also shown that assessment of mechanical LV dyssynchrony may be a better predictor of patient response to CRT and that the QRS duration as a surrogate may not accurately reflect the degree of mechanical dyssynchrony present.8,9 Therefore, efforts have been made to improve patient selection for CRT by more precisely defining LV mechanical dyssynchrony. These efforts have previously focused on echocardiographic techniques using tissue Doppler imaging.5
A novel technique has been developed to quantify mechanical dyssynchrony using phase analysis of gated single photon emission computed tomography (SPECT) myocardial perfusion imaging (MPI). Advantages to this technique include its automation, reproducibility, and three-dimensional assessment of LV dyssynchrony.10–16 Additionally, SPECT imaging has other potential advantages such as the ability to provide simultaneous quantification of myocardial perfusion which has been shown to be an independent predictor of response to CRT.17–19
Although traditional indications for CRT include patients with LV EF ≤35%, patients with mild degrees of LV dysfunction have been shown to respond to CRT in a small prospective study.20 However, a complete description of dyssynchrony using phase analysis in this patient population has not been previously reported. This paper serves to examine the degree of mechanical dyssynchrony as assessed by gated SPECT phase analysis in patients with mild-moderate LV dysfunction, defined as a LV EF between 35 and 50%. This paper will also evaluate the relationship between electrical dyssynchrony as determined by QRS duration and SPECT-derived mechanical dyssynchrony and also report the prevalence of significant dyssynchrony in this cohort of patients.
METHODS
Patient Selection
The study population comprised a retrospective cohort of consecutive patients who were referred for gated SPECT MPI at Duke University Medical Center. The following inclusion criteria were applied: (1) age greater than 18 years, (2) weight <440 pounds, (3) “excellent” image quality as determined by reading physician blinded to present study, (5) diagnostic electrocardiogram done within 24 hours of the SPECT MPI available for review in the electronic medical record system, (6) Regular R-R interval allowing gated SPECT MPI. A total of 335 patients met the inclusion criteria that included 93 patients with LV EF 35–50%, 167 patients with LV EF ≤35%, and 75 normal controls. All patients were referred for gated SPECT imaging for routine clinical indications. Any resting perfusion defect from the final interpretation by an experienced nuclear cardiologist was used to define “perfusion abnormalities.” The QRS duration was recorded from an automated, computerized report and was confirmed by visual inspection. Normal controls were defined as patients having an LV EF ≥55%, having no abnormalities on perfusion imaging, and having no history of coronary artery disease.
SPECT Imaging and Determination of Dyssynchrony
The post-stress image data sets were gated at the time of image acquisition. All patients received a single isotope, technetium (Tc) 99m labeled tetrofosmin, radiopharmaceutical protocol. Images were obtained with a “step and shoot” protocol at a minimum of 30 seconds per step and a minimum of 60 frames at 8 frames per cycle. A standard gamma cameral with a 64 × 64 matrix and a low energy, high-resolution collimnator was used. The R-R window used for gating was within 20% of the average prescan electrocardiogram cycle length. The short-axis data sets were generated using Butter-worth filtering followed by filtered back projection reconstruction and oblique reorientation. The automated LV EF from the gated SPECT study was used for this analysis.
A method to extract amplitude (representing the degree of systolic wall thickening) and phase (representing the timing of the onset of mechanical contraction) from regional LV count changes obtained during gated SPECT MPI has been previously reported.10 Three-dimensional count distributions are extracted from each of the eight LV short-axis data sets and submitted to Fourier phase analysis. The analysis applies one-dimensional fast Fourier transform to the count variation over time of each voxel to calculate the phase of the first Fourier harmonic. Then, the analysis generates a three-dimensional phase distribution describing the timing of the LV regional onset of mechanical contraction as a function of degrees, with the 360° range representing the entire length of the R-R interval. Once the phase distribution is generated, it is displayed on the polar map as well as in histogram format. An example of the phase histogram is shown in Figure 1. Of note, the effective temporal resolution of this technique utilizing a fast Fourier algorithm to calculate the phase shift for dyssynchrony analysis has been evaluated and correlates to 1/64th of the cardiac cycle and there was no significant impact on the phase SD when 8 or 16 frames per cycle was applied.11
Figure 1.
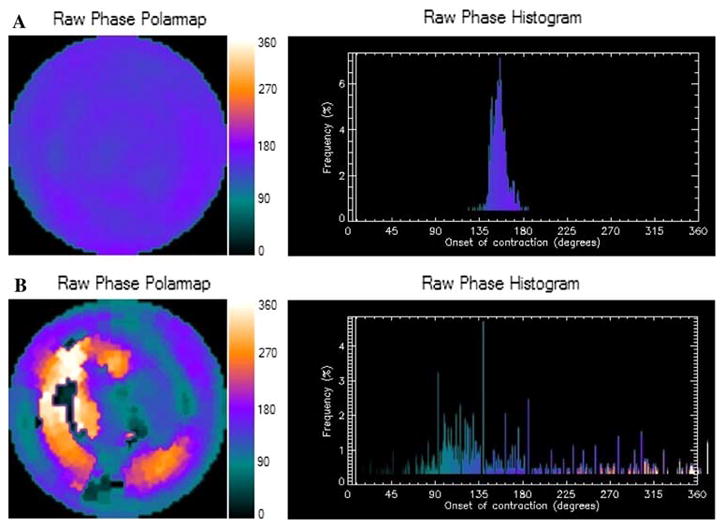
Representative phase histogram. A Normal phase histogram: The X-axis represents the timing of one cardiac cycle (R-R interval) in degrees. The Y-axis represents the percent of myocardium demonstrating the onset of mechanical contraction during any particular phase of the cardiac cycle. The color maps have 256 levels with the minimum level corresponding to black and the maximum level corresponding to white. B Abnormal phase histogram showing a wide bandwidth indicating a delayed onset of myocardial contraction representing significant left ventricular mechanical dyssynchrony.
Two quantitative indices are calculated from the phase distribution as a measure of dyssynchrony. The standard deviation of the LV phase distribution, phase SD, and phase histogram bandwidth which represents the phase range during which 95% of the LV is initiating contraction. The larger the phase SD and histogram bandwidth, the higher the degree of mechanical dyssynchrony. The software has been implemented in the Emory Cardiac Toolbox (Emory University/Syntermed, Atlanta, GA) for analysis of gated SPECT myocardial perfusion imaging.
Statistical Methods
A descriptive analysis was performed examining the age, gender, and risk burden distribution in the entire cohort. The mean, median, and standard deviations were calculated for continuous variables and categorical variables were described as percentages. Baseline characteristics and SPECT imaging phase indices were examined. The Wilcoxon rank-sum test was used to determine if there were any significant differences in the distribution of the quantitative phase analysis indices describing the degree of mechanical dyssynchrony between the cohorts studied. Results presented include mean values ± SD and medians (25th percentiles, 75th percentiles) for each cohort of patients studied. Correlation coefficients were used to examine the relation between QRS duration and the degree of mechanical dyssynchrony as quantified using the phase analysis indices. All statistical analyses were performed using SAS Version 8 (SAS Institute, Cary, NC). The level of statistical significance was a priori set at .05 and a two sided P value was used for all analyses.
We compared the distributions of the phase analysis results in patients with mild-to-moderate LV dsyfunction (EF 35–50%) with those of patients with severe LV dysfunction (EF ≤ 35%) and normal controls. We evaluated the relationship between electrical dyssynchrony as determined by QRS duration and mechanical dyssynchrony as quantified by phase analysis. Lastly, we evaluated the prevalence of significant dyssynchrony (phase SD ≥ 43°) in the total cohort of patients with mild-to-moderate LV dysfunction and in the subsets of these patients with normal perfusion (n = 10), perfusion abnormalities (n = 83), normal QRS duration (n = 73), and prolonged QRS duration ≥120 milliseconds (n = 20). A phase SD cutoff of 43° to define significant dyssynchrony was chosen based upon prior work by Henneman et al where this was found to have a reasonable sensitivity and specificity for predicting response to CRT.13
This study was approved by the institutional review board at Duke University Medical Center. The authors had access to and take full responsibility for the integrity of the data.
RESULTS
Baseline characteristics are shown in Table 1. In the cohort of 93 patients with mild-moderate LV dysfunction, 74% were male, 70% were white, and the mean age was 64 years. Of the total cohort studied, 11% had normal myocardial perfusion imaging, 89% had myocardial perfusion abnormalities on SPECT imaging, 78% had normal QRS duration, and 22% had a QRS duration ≥120 milliseconds.
Table 1.
Baseline characteristics
| Normal | Mild-to-Mod LV dysfunction | Severe LV dysfunction | |
|---|---|---|---|
| n | 75 | 93 | 167 |
| Demographics | |||
| Age (years) | 61.2 | 63.6 | 65.9 |
| Sex (% male) | 33.3 | 74.2 | 77.8 |
| Race (%White) | 59.5 | 69.9 | 64.7 |
| Comorbidities (%) | |||
| CAD | 0.0 | 90.3 | 82.6 |
| HTN | 68.0 | 88.2 | 79.6 |
| Diabetes | 26.7 | 47.3 | 44.3 |
| CRI | 16.0 | 32.3 | 38.9 |
| Diagnostic testing | |||
| QRS Duration (millisecond) | 83.9 | 105.3 | 126.1 |
| ESV (mL) | 26.3 | 109.4 | 175.1 |
| Left ventricular mass (g) | 115.1 | 179.9 | 212.9 |
CAD, History of coronary artery disease; HTN, hypertension; CRI, chronic renal insufficiency (creatinine ≥ 2 mg/dL); ESV, end systolic volume.
The comparisons of mechanical dyssynchrony in patients with mild-to-moderate LV dysfunction versus normal controls and patients with severe LV dysfunction are shown in Table 2. Patients with mild-to-moderate LV dysfunction have significantly more dyssynchrony than normal controls as determined by phase SD (37.7° ± 17.0° vs 8.8° ± 3.1°, P <.001) and bandwidth (113.5° ± 54.8° vs 28.7° ± 9.4°, P <.001), but they have significantly less dyssynchrony than patients with severe LV dysfunction as measured by phase SD (37.7° ± 17.0° vs 52.0° ± 21.7°, P <.001) and bandwidth (113.5° ± 54.8° vs 158.2° ± 70.7°, P <.001).
Table 2.
Comparison of mechanical dyssynchrony in patients with mild-moderate LV dysfunction, severe LV dysfunction, and normal controls
| Normal (n = 75) | Mild-moderate LV dysfunction (n = 93) | Severe LV dysfunction (n = 167) | P† | P‡ | |
|---|---|---|---|---|---|
| Phase SD (°) | |||||
| Mean ± SD | 8.8 ± 3.1 | 37.7 ± 17.0 | 52.0 ± 21.7 | <.001 | <.001 |
| Bandwidth (°) | |||||
| Mean ± SD | 28.7 ± 9.3 | 113.5 ± 54.5 | 158.2 ± 70.5 | <.001 | <.001 |
Patients with mild-moderate LV dysfunction have significantly more dyssynchrony than normal controls (†P <.001 for both phase SD and bandwidth). Patients with mild-moderate LV dysfunction have significantly less dyssynchrony than patients with severe LV dysfunction (‡P <.001 for both phase SD and bandwidth).
Represents P value for comparison of normal versus mild-moderate LV dysfunction.
Represents P value for mild-moderate LV dysfunction versus severe LV dysfunction.
The relationships between QRS duration and mechanical dyssynchrony are shown in Figure 2. Overall, patients with prolonged QRS duration demonstrated higher degrees of mechanical dyssynchrony than patients with normal QRS durations as measured by phase SD (49.4° ± 18.0° vs 34.5° ± 15.4°, P = .002) and bandwidth (137.7° ± 52.0° vs 106.9° ± 54.0°, P = .014). For the cohort of patients with mild-moderate LV dysfunction, there were weak correlations between QRS duration and phase SD or bandwidth with correlation coefficients of 0.28 and 0.20, respectively. Although statistically significant, these correlation coefficients explain only 8% (r2 = 0.078, P = .006) and 4% (r2 = 0.04, P = .05) of the association between QRS duration and the respective measures of mechanical dyssynchrony.
Figure 2.

Relationship between QRS duration and mechanical dyssynchrony in patients with mild-moderate LV dysfunction. A Scatter plot of dyssynchrony by phase SD versus QRS duration for patients with mild-to-moderate dysfunction showing a weak association (r = 0.28). B Scatter plot of dyssynchrony assessed by histogram bandwidth versus QRS duration for patients with mild-to-moderate LV dysfunction showing a weak association (r = 0.20).
Figure 3 demonstrates the prevalence of significant dyssynchrony (phase SD ≥ 43°) in patients with mild-to-moderate LV dysfunction. Thirty-seven percent of the total cohort of patients demonstrated significant degrees of dyssynchrony. Of the 83 patients with perfusion defects, 41% were found to have significant mechanical dyssynchrony compared to none of the patients with normal perfusion patterns. Interestingly, almost 29% of patients with a LV EF of 35–50% and QRS duration <120 milliseconds were found to have significant mechanical dyssynchrony.
Figure 3.

Prevalence of dyssynchrony in mild-moderate LV dysfunction. Bar graph demonstrating findings from the 93 patient cohort with mild-moderate LV dysfunction. 36.6% of the total cohort was found to have significant degrees of dyssynchrony (defined as a phase SD >43°). Of note, 28.8% of patients with mild-moderate LV dysfunction and QRS duration <120 milliseconds have significant dyssynchrony.
DISCUSSION
The evaluation of dyssynchrony has become an important consideration in the management of patients with HF and LV dysfunction.21 Current echocardiographic measures of dyssynchrony may not be sufficiently sensitive or specific to predict a favorable response to CRT. This was highlighted by the recently reported results of the predictors of response to cardiac resynchronization therapy (PROSPECT) trial which demonstrated that the currently available echocardiographic techniques added little to improve the selection of patients for CRT and suffered from high degrees of intercore lab variability in a large multi-center study.6 An improved method to predict which patients will respond favorably to CRT could be an important clinical tool and has been the subject of significant research efforts.
The use of phase analysis of gated SPECT MPI has been reported to be a method that can quantify mechanical dyssynchrony in a three-dimensional, automated, and reproducible manner. Early studies utilizing this novel technique have demonstrated that a phase SD ≥43° was the optimal cutoff to predict response to CRT in a cohort of patients with traditional indications for CRT.10–16 The potential for improved patient selection for CRT using gated SPECT perfusion imaging lies not only with quantification of mechanical dyssynchrony, but also with the simultaneous assessment of myocardial perfusion which has been previously shown to have an independent ability to predict response to CRT.16–19 It is important to note that dyssynchrony as assessed by gated SPECT phase analysis may be superior to traditional echocardiographic techniques due to the methodology of this application, rather than the method itself. While echocardiographic determinants of dyssynchrony rely on 1 or at most a few cardiac cycles, phase analysis quantifies dyssynchrony based upon an accumulation of data averaged over a 15–20 minute study period that can represent more than 1,000 cardiac cycles.
In addition to the potential for improving the selection of patients who meet current criteria for CRT, imaging techniques may be able to identify patients who have significant dyssynchrony and may benefit from CRT but are not currently eligible. This could include patients with more mildly reduced LV EF and patients with less severe HF symptoms. CRT has been shown to improve LV function and improve symptoms in patients with NYHA class II symptoms in the Multicenter InSync ICD Randomized Clinical Evaluation II (MIRACLE ICD II) study.22 Similarly, the only reported study evaluating CRT in patients with an LV EF between 35 and 45% demonstrated improvements in LV volume, LV EF, and NYHA functional class.20 The magnitude of these improvements was similar to improvements in patients with LV EF ≤35% who received CRT.
Our study sought to define the amount of dyssynchrony present in patients with mild-to-moderate LV dysfunction which has not been previously reported utilizing phase analysis. We found that patients with mild-to-moderate LV dysfunction have significant amounts of dyssynchrony. Approximately one-third of these patients had a phase SD of ≥43°. Importantly, this degree of LV dyssynchrony is approximately 8–9 times greater than the standard deviation of normal controls and represents a relatively large degree of dyssynchrony. This point has significant clinical implications as demonstrated in a recent study by Ypenburg et al23 where it was shown that patients with greater degrees of LV dyssynchrony tend to have a more robust response to CRT.
This study demonstrated a lack of significant relationship between QRS duration and mechanical dyssynchrony in patients with mild-moderate LV dysfunction. These data reinforce the hypothesis that QRS duration may not reflect the optimal selection method for CRT.9,24–28 Several small single center studies have demonstrated improvements after CRT in HF patients with narrow QRS and evidence of mechanical dyssynchrony by echocardiography, while one small randomized study demonstrated only subjective improvements by NYHA functional class.9,26–29 Although patients with more severe LV dysfunction and prolonged QRS duration tend to have higher degrees of dyssynchrony, these variables are not entirely “mutually inclusive” and there may be important differences in the degree of dyssynchrony in patients with more advanced HF symptoms irrespective of the degree of LV dysfunction or QRS prolongation.30
Our study has some important limitations. The retrospective nature of our study limits the ability to describe the degree of HF symptoms in our cohort of patients with various degrees of LV dysfunction. Additionally, since patients with mild-to-moderate LV dysfunction are not currently eligible for CRT, we are unable to report clinical endpoints or predict whether this group of patients responds to CRT by phase analysis of gated SPECT.
CONCLUSION
The ability to use nuclear imaging to simultaneously assess perfusion, function, and quantify mechanical dyssynchrony in an automated and reproducible manner could help improve patient selection for CRT. Currently, data are limited for this technique with respect to randomized trials or patient outcomes. Further study of phase analysis by gated SPECT imaging is warranted to assess the clinical applicability of this technology.
Acknowledgments
Dr. Atchley is a fellow in training supported by a National Institutes of Health T32 grant. This study was funded by the Medtronic-Duke Strategic Alliance of which Dr. Trimble was the primary investigator. Dr. Garcia reports an ownership interest in and serves as a consultant/advisor board member to Syntermed Inc. Dr. Garcia also receives royalties from the sale of clinical software which was used as part of this research.
References
- 1.Abraham WT, Fisher WG, Smith AL, Delurgio DB, Leon AR, Loh E, et al. Cardiac resynchronization in chronic heart failure. N Engl J Med. 2002;346:1845–53. doi: 10.1056/NEJMoa013168. [DOI] [PubMed] [Google Scholar]
- 2.Young JB, Abraham WT, Smith AL, Leon AR, Lieberman R, Wilkoff B, et al. Combined cardiac resynchronization and implantable cardioversion defibrillation in advanced chronic heart failure: The MIRACLE ICD trial. JAMA. 2003;289:2685–94. doi: 10.1001/jama.289.20.2685. [DOI] [PubMed] [Google Scholar]
- 3.Bristow MR, Saxon LA, Boehmer J, Krueger S, Kass DA, De Marco T, et al. Cardiac-resynchronization therapy with or without an implantable defibrillator in advanced chronic heart failure. N Engl J Med. 2004;350:2140–50. doi: 10.1056/NEJMoa032423. [DOI] [PubMed] [Google Scholar]
- 4.Cleland JG, Daubert JC, Erdmann E, Freemantle N, Gras D, Kappenberger L, et al. The effect of cardiac resynchronization on morbidity and mortality in heart failure. N Engl J Med. 2005;352:1539–49. doi: 10.1056/NEJMoa050496. [DOI] [PubMed] [Google Scholar]
- 5.Bax JJ, Abraham T, Barold SS, Breithardt OA, Fung JW, Garrigue S, et al. Cardiac resynchronization therapy: Part 1—issues before device implantation. J Am Coll Cardiol. 2005;46:2153–67. doi: 10.1016/j.jacc.2005.09.019. [DOI] [PubMed] [Google Scholar]
- 6.Chung ES, Leon AR, Tavazzi L, Sun JP, Nihoyannopoulos P, Merlino J, et al. Results of the predictors of response to CRT (PROSPECT) trial. Circulation. 2008;117:2608–16. doi: 10.1161/CIRCULATIONAHA.107.743120. [DOI] [PubMed] [Google Scholar]
- 7.Mullens W, Grimm RA, Verga T, Dresing T, Starling RC, Wilkoff BL, et al. Insights from a cardiac resynchronization optimization clinic as part of a heart failure disease management program. J Am Coll Cardiol. 2009;53:765–73. doi: 10.1016/j.jacc.2008.11.024. [DOI] [PubMed] [Google Scholar]
- 8.Leclercq C, Faris O, Tunin R, Johnson J, Kato R, Evans F, et al. Systolic improvement and mechanical resynchronization does not require electrical synchrony in the dilated failing heart with left bundle-branch block. Circulation. 2002;106:1760–3. doi: 10.1161/01.cir.0000035037.11968.5c. [DOI] [PubMed] [Google Scholar]
- 9.Achilli A, Sassara M, Ficili S, Pontillo D, Achilli P, Alessi C, et al. Long-term effectiveness of cardiac resynchronization therapy in patients with refractory heart failure and “narrow” QRS. J Am Coll Cardiol. 2003;42:2117–24. doi: 10.1016/j.jacc.2003.08.024. [DOI] [PubMed] [Google Scholar]
- 10.Chen J, Garcia EV, Folks RD, Cooke CD, Faber TL, Tauxe EL, et al. Onset of left ventricular mechanical contraction as determined by phase analysis of ECG-gated myocardial perfusion SPECT imaging: Development of a diagnostic tool for assessment of cardiac mechanical dyssynchrony. J Nucl Cardiol. 2005;12:687–95. doi: 10.1016/j.nuclcard.2005.06.088. [DOI] [PubMed] [Google Scholar]
- 11.Chen J, Faber TL, Cooke CD, Garcia EV. Temporal resolution of multiharmonic phase analysis of ECG-gated myocardial perfusion SPECT studies. J Nucl Cardiol. 2008;15:383–91. doi: 10.1016/j.nuclcard.2008.02.014. [DOI] [PMC free article] [PubMed] [Google Scholar]
- 12.Trimble MA, Velazquez EJ, Adams GL, Honeycutt EF, Pagnanelli RA, Barnhart HX, et al. Repeatability and reproducibility of phase analysis of gated single-photon emission computed tomography myocardial perfusion imaging used to quantify cardiac dyssynchrony. Nucl Med Commun. 2008;29:374–81. doi: 10.1097/MNM.0b013e3282f81380. [DOI] [PMC free article] [PubMed] [Google Scholar]
- 13.Trimble MA, Borges-Neto S, Smallheiser S, Chen J, Honeycutt EF, Shaw LK, et al. Evaluation of left ventricular mechanical dyssynchrony as determined by phase analysis of ECG-gated SPECT myocardial perfusion imaging in patients with left ventricular dysfunction and conduction disturbances. J Nucl Cardiol. 2007;14:298–307. doi: 10.1016/j.nuclcard.2007.01.041. [DOI] [PubMed] [Google Scholar]
- 14.Henneman MM, Chen J, Ypenburg C, Dibbets P, Bleeker GB, Boersma E, et al. Phase analysis of gated myocardial perfusion single-photon emission computed tomography compared with tissue Doppler imaging for the assessment of left ventricular dyssynchrony. J Am Coll Cardiol. 2007;49:1708–14. doi: 10.1016/j.jacc.2007.01.063. [DOI] [PubMed] [Google Scholar]
- 15.Marsan NA, Henneman MM, Chen J, Ypenburg C, Dibbets P, Ghio S, et al. Left ventricular dyssynchrony assessed by two-three-dimensional imaging modalities: Phase analysis of gated myocardial perfusion SPECT and tri-plane tissue Doppler imaging. Eur J Nucl Med Mol Imaging. 2008;35:166–73. doi: 10.1007/s00259-007-0539-6. [DOI] [PMC free article] [PubMed] [Google Scholar]
- 16.Henneman MM, Chen J, Dibbets-Schneider P, Stokkel MP, Bleeker GB, Ypenburg C, et al. Can LV dyssynchrony as assessed with phase analysis on gated myocardial perfusion SPECT predict response to CRT? J Nucl Med. 2007;48:1104–11. doi: 10.2967/jnumed.107.039925. [DOI] [PubMed] [Google Scholar]
- 17.Bleeker GB, Kaandorp TA, Lamb HJ, Boersma E, Steendijk P, de Roos A, et al. Effect of posterolateral scar tissue on clinical and echocardiographic improvement after cardiac resynchronization therapy. Circulation. 2006;113:969–76. doi: 10.1161/CIRCULATIONAHA.105.543678. [DOI] [PubMed] [Google Scholar]
- 18.Ypenburg C, Schalij MJ, Bleeker GB, Steendijk P, Boersma E, Dibbets-Schneider P, et al. Extent of viability to predict response to cardiac resynchronization therapy in ischemic heart failure patients. J Nucl Med. 2006;47:1565–70. [PubMed] [Google Scholar]
- 19.Adelstein EC, Saba S. Scar burden by myocardial perfusion imaging predicts echocardiographic response to cardiac resynchronization therapy in ischemic cardiomyopathy. Am Heart J. 2007;153:105–12. doi: 10.1016/j.ahj.2006.10.015. [DOI] [PubMed] [Google Scholar]
- 20.Fung JW, Zhang Q, Yip GW, Chan JY, Chan HC, Yu CM. Effect of cardiac resynchronization therapy in patients with moderate left ventricular systolic dysfunction and wide QRS complex: A prospective study. J Cardiovasc Electrophysiol. 2006;17:1288–92. doi: 10.1111/j.1540-8167.2006.00612.x. [DOI] [PubMed] [Google Scholar]
- 21.Hunt SA. ACC/AHA 2005 guideline update for the diagnosis and management of chronic heart failure in the adult: A report of the American College of Cardiology/American Heart Association Task Force on Practice Guidelines (Writing Committee to Update the 2001 Guidelines for the Evaluation and Management of Heart Failure) J Am Coll Cardiol. 2005;46:e1–82. doi: 10.1016/j.jacc.2005.08.022. [DOI] [PubMed] [Google Scholar]
- 22.Abraham WT, Young JB, Leon AR, Adler S, Bank AJ, Hall SA, et al. Effects of cardiac resynchronization on disease progression in patients with left ventricular systolic dysfunction, an indication for an implantable cardioverter-defibrillator, and mildly symptomatic chronic heart failure. Circulation. 2004;110:2864–8. doi: 10.1161/01.CIR.0000146336.92331.D1. [DOI] [PubMed] [Google Scholar]
- 23.Ypenburg C, van Bommel RJ, Borleffs CJ, Bleeker GB, Boersma E, Schalij MJ, et al. Long-term prognosis after cardiac resynchronization therapy is related to the extent of left ventricular reverse remodeling at midterm follow-up. J Am Coll Cardiol. 2009;53:483–90. doi: 10.1016/j.jacc.2008.10.032. [DOI] [PubMed] [Google Scholar]
- 24.Bleeker GB, Schalij MJ, Molhoek SG, Verwey HF, Holman ER, Boersma E, et al. Relationship between QRS duration and left ventricular dyssynchrony in patients with end-stage heart failure. J Cardiovasc Electrophysiol. 2004;15:544–9. doi: 10.1046/j.1540-8167.2004.03604.x. [DOI] [PubMed] [Google Scholar]
- 25.Trimble M, Borges-Neto S, Honneycutt E, Shaw LK, Chen J, Garcia E, et al. Electrical dyssynchrony does not correlate with mechanical dyssynchrony as determined by phase analysis of ECG-gated SPECT myocardial perfusion imaging. Oral presentation. J Nucl Cardiol. 2007;14:S79. doi: 10.1016/j.nuclcard.2007.01.041. [DOI] [PubMed] [Google Scholar]
- 26.Turner MS, Bleasdale RA, Mumford CE, Frenneaux MP, Morris-Thurgood JA. Left ventricular pacing improves haemodynamic variables in patients with heart failure with a normal QRS duration. Heart. 2004;90:502–5. doi: 10.1136/hrt.2003.011759. [DOI] [PMC free article] [PubMed] [Google Scholar]
- 27.Bleeker GB, Holman ER, Steendijk P, Boersma E, van der Wall EE, Schalij MJ, et al. Cardiac resynchronization therapy in patients with a narrow QRS complex. J Am Coll Cardiol. 2006;48:2243–50. doi: 10.1016/j.jacc.2006.07.067. [DOI] [PubMed] [Google Scholar]
- 28.Yu CM, Chan YS, Zhang Q, Yip GW, Chan CK, Kum LC, et al. Benefits of cardiac resynchronization therapy for heart failure patients with narrow QRS complexes and coexisting systolic asynchrony by echocardiography. J Am Coll Cardiol. 2006;48:2251–7. doi: 10.1016/j.jacc.2006.07.054. [DOI] [PubMed] [Google Scholar]
- 29.Beshai JF, Grimm RA, Nagueh SF, Baker JHII, Beau SL, Greenberg SM, et al. Cardiac-resynchronization therapy in heart failure with narrow QRS complexes. N Engl J Med. 2007;357:2461–71. doi: 10.1056/NEJMoa0706695. [DOI] [PubMed] [Google Scholar]
- 30.Samad Z, Trimble MA, Atchley AE, Pagnanelli R, Chen J, Garcia EV, et al. Prevalence and predictors of dyssynchrony as determined by gated SPECT perfusion imaging in patients with left ventricular dysfunction. Eur Heart J. 2008;29:S5. [Google Scholar]