

Abstract
Nascent membrane proteins typically insert in a sequential fashion into the membrane via a protein-conducting channel, the Sec translocon. How this process occurs is still unclear, although a thermodynamic partitioning between the channel and the membrane environment has been proposed. Experiment- and simulation-based scales for the insertion free energy of various amino acids are, however, at variance, the former appearing to lie in a narrower range than the latter. Membrane insertion of arginine, for instance, requires 14–17 kcal/mol according to molecular dynamics simulations, but only 2–3 kcal/mol according to experiment. We suggest that this disagreement is resolved by assuming a two-stage insertion process wherein the first step, the insertion into the translocon, is energized by protein synthesis and, therefore, has an effectively zero free-energy cost; the second step, the insertion into the membrane, invokes the translocon as an intermediary between the fully hydrated and the fully inserted locations. Using free-energy perturbation calculations, the effective transfer free energies from the translocon to the membrane have been determined for both arginine and leucine amino acids carried by a background polyleucine helix. Indeed, the insertion penalty for arginine as well as the insertion gain for leucine from the translocon to the membrane is found to be significantly reduced compared to direct insertion from water, resulting in the same compression as observed in the experiment-based scale.
Keywords: membrane-protein insertion, SecY, ribosome, hydrophobicity scale
Nearly all membrane proteins found in the inner membranes of bacterial cells and the membranes of eukaryotic cells are inserted concomitant with their synthesis by the ribosome, i.e., cotranslationally (1). Insertion into the bilayer does not happen directly, but rather occurs via a highly conserved protein-conducting channel in the membrane, the Sec translocon (2–4). At an early stage of synthesis, the ribosome docks to the channel, forming a tightly bound complex (5, 6). The polypeptide is then inserted into the translocon prior to entering the membrane, the former step requiring a driving force, such as nucleotide hydrolysis, a membrane potential gradient, or the pressure exerted by the growing nascent chain (2).
In addition to aiding the insertion of membrane proteins, the translocon also allows certain nascent proteins to cross the membrane (2). Structures of the Sec translocon (7–9) reveal two apparent gates, one transverse for the passage of soluble proteins across the membrane and one lateral for the exit of membrane proteins (7, 10, 11). The lateral gate is formed at the interface of two halves of SecY (7, 12) (see Fig. 1B). This gate fluctuates during translocation of the nascent polypeptide (13, 14), although what factors govern its opening and closing are unclear (8, 9, 15).
Fig. 1.

Side view of the simulated systems. In all panels, the polyleucine helix is shown in cyan; red spheres on the helix indicate the position of hybrid leucine/arginine residues used for FEP. The extent of water in the periodic system is illustrated as a transparent gray surface. Lipids are shown as teal lines with phosphorus and nitrogen atoms of their headgroups indicated as orange and blue spheres, respectively. (A) Pure-membrane/polyleucine system. (B) SecYEβ/polyleucine system. SecYEβ is shown in gray (SecY), orange (E), and yellow (β). The lateral gate helices 2b and 7 are shown in green. (C) Close-up of the pore region of SecY from B. SecYEβ is displayed as a molecular surface, colored as in B, indicating the exposure of the polyleucine helix to the membrane.
Given the two pathways presented by the translocon, there must exist a way to discriminate between proteins destined for the lipid membrane environment and proteins destined for the lumen or the extracellular space. Although hydrophobicity is the predominant factor (16), it is insufficient per se to determine whether or not a given polypeptide segment will be integrated into the membrane (17, 18). Both residues immediately flanking a transmembrane (TM) segment (19) and those in other TM segments upstream or downstream (18, 20) can also contribute to the membrane insertion propensity of the segment. Experiments have demonstrated that the polypeptide chain can interact with lipids while still in the channel (21–23), leading to the proposal that insertion is a thermodynamic partitioning between channel and membrane (23–25). A kinetic model of insertion has also been proposed, in which the polypeptide can control the lateral gate conformation from within the channel. The opening or closing of the gate then determines whether or not a given segment is integrated into the membrane (15). A combination of the two models is also possible, wherein the polypeptide controls both its exposure to the lipid bilayer and its potential integration.
A quantitative, sequence-based description of the probability of membrane insertion was first determined via experiments that systematically challenged the translocon with a variety of putative TM segments (24). By further incorporating position-dependent effects for all twenty amino acids, a simple free-energy scale for TM-segment insertion was constructed (17) and predictors based on the scale proved to be reasonably accurate (26). An unexpected result from this so-called “biological hydrophobicity scale” is a relatively low insertion penalty for charged residues, even to the center of the bilayer. For instance, the free-energy cost for inserting arginine is only 2.6 kcal/mol (24). A number of computational investigations have been undertaken since, in an attempt to understand at an atomic level the origin of this energetic cost. Translocation of an arginine amino acid borne by an effectively infinite polyleucine α-helix from water to the hydrophobic membrane core requires 17 kcal/mol (27). Other studies of the translocation of side-chain analogs have corroborated the large discrepancy between computational and experimental measurements, with values ranging from 10 to 14 kcal/mol for arginine (28–31). Furthermore, the free-energy gain from the insertion of hydrophobic amino acids was also found to be consistently larger in theoretical investigations compared to experiments. Appeals to differences in lipid composition (32) or to the charge state of titratable residues (33, 34) were not successful in explaining the discrepant results. Alternatively, by incorporating a large number of proteins in the bilayer, the free-energy cost for translocation of arginine from water to the membrane was reduced significantly, albeit the free-energy gain from inserting leucine remained unchanged (35). Recent coarse-grained simulations have also demonstrated that interactions between a putative TM segment and two additional TM helices and/or the translocon can reduce the free energy of insertion from water to membrane (36).
It has often been assumed hitherto that the equilibrium process measured in the translocon-based experiments is the direct transfer of a given amino acid from water to the bilayer, hence, neglecting any potential role of the ribosome or the translocon. Membrane insertion via the translocon is, however, more complicated, involving multiple mechanistic steps, including the slow transfer of the nascent polypeptide to the channel, the formation of secondary structure, and the subsequent exit from the channel into the membrane or the aqueous phase. It has been suggested that these steps can be summarized in two composite stages (34, 37), wherein only the second step, namely the partitioning of the TM segment from the channel to the membrane across the lateral gate, occurs at equilibrium. To examine this partitioning quantitatively, the thermodynamic cycle shown in Fig. 2 was constructed. This cycle connects the direct, artificial insertion of an amino acid from water to the membrane, i.e., ΔG(poly-L∶Argaq.→mem.), with the natural transfer of a full TM segment from the translocon to the membrane, i.e., ΔG(poly-L∶ArgSecY→mem.). From this cycle follows
 |
[1] |
where the free energy required for the transfer from water to SecY, i.e., ΔG(poly-L∶Argaq.→SecY), is provided by the ribosome.
Fig. 2.

Thermodynamic cycle for TM insertion. The upper cycle represents the transfer of a polyleucine helix with a solvent-exposed arginine residue from SecY to membrane. The lower cycle illustrates the same transfer but with the arginine residue located at the center of SecY and the membrane. The red box encapsulates the second stage of the proposed insertion process. Free-energy differences ΔG(poly-Laq.→mem.), ΔG(poly-Laq.→SecY), ΔG(Argaq.→mem.), and ΔG(Argaq.→SecY) were determined from FEP simulations, with the transfers from the aqueous state derived based on transfers from a vacuum state (see SI Appendix, Table S1 and Fig. S7). ΔG(poly-LSecY→mem.) and ΔG(poly-L∶ArgSecY→mem.) were calculated by completing the cycles.
To determine the insertion cost for a TM segment transiting from SecY to membrane, alchemical free-energy perturbation (FEP) (38) calculations have been carried out for the direct insertion of an effectively infinite polyleucine helix from the aqueous phase into the lipid bilayer and for the indirect insertion involving SecY. The aggregated simulation time was nearly 1 μs, including both forward and reverse FEP calculations, the latter being used not only to probe convergence of the calculations, but also to improve their reliability (39) (see SI Appendix). Based on the results of the simulations, a coherent model for membrane-protein insertion that includes the roles played by the ribosome and the translocon is developed and is shown to compare favorably with experimental results.
Results
In total, five independent FEP calculations were run with results listed in Table 1. These simulations provide the free-energy contributions necessary to complete the thermodynamic cycle of Fig. 2. First, the free-energy costs for the direct insertion of an arginine residue on a background polyleucine helix from water to membrane and to SecY, i.e., ΔG(Argaq.→mem.) and ΔG(Argaq.→SecY), were determined, which can be readily compared to previous calculations (27, 35). Then, to account for the contribution of the background helix to the insertion free energy, FEP simulations examining the insertion of a polyleucine helix from water to membrane and from water to SecY were also carried out. All calculated free energies are then combined in light of Eq. 1 to close the proposed thermodynamic cycle. As shown in Fig. 2, the free-energy change for transferring an infinite polyleucine helix from SecY to the membrane is -16.2 kcal/mol, whereas for a polyleucine helix with a central arginine amino acid, the free-energy change is still favorable, although less so, namely -8.3 kcal/mol. Finally, the resulting individual insertion free energies for arginine and leucine are determined to be 6.5 kcal/mol and -1.0 kcal/mol, respectively. These free energies present a range that is narrower than that found in previous simulations (28, 29, 31, 35) and is closer to the experimental one.
Table 1.
Overview of the free-energy changes associated with the different legs of the thermodynamic cycle
| Transformation | Total simulation time, ns | ΔG, kcal/mol | ||
| Forward |
Backward |
BAR* |
||
| ΔG(Argaq.→mem.) | 60.0 | +17.5 | −17.3 | +16.9 ± 0.2 |
| ΔG(Argaq.→SecY) | 60.0 | +9.0 | −9.8 | +9.0 ± 0.4 |
| ΔG(poly-Lvac.→aq.) | 93.0 | +52.8 | −50.7 | +51.7 ± 0.2 |
| ΔG(poly-Lvac.→mem.) | 93.0 | −1.9 | +6.9 | −4.6 ± 0.4 |
| ΔG(poly-Lvac.→SecY) | 128.4 | +15.1 | −8.6 | +11.5 ± 0.2 |
Transfer of Arginine to the Lipid Bilayer and to SecY.
Completion of the lower thermodynamic cycle in Fig. 2 requires first the determination of the free energy of insertion from water to membrane and to SecY for an arginine residue carried by an infinite, background polyleucine α-helix. Translocation of this residue from the aqueous phase to the interior of the lipid bilayer can be modeled through a mutation into leucine of an arginine located far above the interfacial environment, combined with the simultaneous mutation into arginine of a leucine at the geometric center of the membrane (see SI Appendix). Preliminary FEP calculations carried out to benchmark the cost-effectiveness of sampling and stratification or windowing strategies (39) for this transformation revealed that convergence of the ensemble average is hampered by slow degrees of freedom requiring extensive equilibration in each window. The slow equilibration of the system is a result of the considerable cost of dehydrating an arginine side chain, +59.4 kcal/mol (42), which causes the membrane to undergo extensive local deformation (43). This deformation allows water molecules to seep in and diffuse toward the titratable amino acid, while preserving the membrane’s overall structural integrity (see Fig. 3A). Microreversibility was achieved at the price of dividing the mutation process into 50 intermediate windows, each involving 0.6 ns of thermalization prior to 0.6 ns of data collection; i.e., the total simulation time was 60 ns. The Bennett acceptance ratio (BAR) net free-energy change amounts to +16.9 ± 0.2 kcal/mol, which almost exactly matches the estimate of Dorairaj and Allen, based on a 427-ns potential-of-mean-force calculation (27).
Fig. 3.

Deformation of the membrane by snorkeling of the arginine residue toward the membrane-water interface. The lower leaflet of the membrane, water, and polyleucine helix are shown as in Fig. 1A. The arginine residue is shown in licorice representation with the coordinating lipid phosphorus atom shown as a yellow sphere. Water that has penetrated the bilayer to solvate arginine is shown in red and white. (A) Membrane deformation for a pure membrane system. (B) Deformation of the membrane by arginine in the SecY-membrane system. The view is perpendicular to SecY’s lateral gate.
The same computational strategy was employed to model the translocation from water to SecY’s geometric center of a hydrated arginine residue borne by the same background polyleucine TM helix. The BAR net free-energy change is equal to +9.0 ± 0.4 kcal/mol. This change is appreciably less than that for insertion of arginine from water to the center of the membrane, demonstrating that the protein environment of the translocon lowers the barrier for translocation of an amino acid across the membrane. The present result can be related to that of Johansson and Lindahl (35), who estimated that the free energies of solvation by SecY of a leucine and an arginine side-chain analogue located near the lateral gate amount to ca. -4 and +5 kcal/mol, respectively. Taking the difference of these two free energies gives +9 kcal/mol, which matches exactly the free energy of the process simulated here, i.e., the transfer of an arginine into the center of SecY coupled to the transfer of a leucine out of SecY.
One may, however, ask to what extent the background TM helix contributes to the overall transfer free energy for an amino acid from water to the membrane or to SecY. This question has already been addressed by Li et al. by comparing the free energy of translocation for an arginine residue borne by a background TM helix with that for an isolated arginine side-chain analog (33). On the one hand, the side-chain analog encounters a 3–4 kcal/mol larger free-energy barrier at the center of the membrane than the helix-bound arginine, whereas on the other hand, the cost for desolvating a leucine residue from the enthalpically favorable lipid surroundings amounts to 4–5 kcal/mol (33, 35). Hence, there is an overall marginal influence of the background helix on the energetics of the translocation process, reconciling the present free-energy change for transferring an arginine residue into SecY and that measured by Johansson and Lindahl (35). That this free-energy change is markedly lower than that for the pure membrane can be ascribed to two closely related contributions. The disturbance induced by SecY on the bilayer structure reduces the cost incurred by the translocation of the charged amino acid with respect to an otherwise unperturbed membrane. Additionally, by preserving the level of hydration of its transmembrane helices, SecY offers a more hospitable environment to arginine, where the side chain can interact favorably with small pockets of water molecules as it appears in the midst of the membrane protein, and, to a lesser extent, with amino acids of SecY itself (see Fig. 3B).
Insertion Free Energy of a Polyleucine Helix.
If the membrane insertion process would occur in a single step, the amino acid moving directly from water to the membrane or to SecY, the calculations done above would already characterize the process sufficiently. Because the insertion process is, however, decomposed into two steps, namely insertion from the ribosome to the center of SecY and from there into the membrane, the free energy required for the latter step remains undetermined. For an amino acid borne by a background polyleucine helix, it is necessary to first consider the insertion free energy of the helix before the contribution to the total free energy of an individual amino acid, e.g., arginine, can be ascertained.
To determine the free-energy contribution of the background TM helix to insertion, FEP calculations have been carried out, wherein the entire helix was either created or annihilated in a given environment, i.e., in the membrane, in SecY, and in water. These calculations provide, effectively, transfer free energies for the helix from vacuum to each environment. By calculating the difference of these free energies, the net transfer free energy for the helix from one environment to another can be derived. The first calculation, namely transfer of the polyleucine helix from vacuum to water, gives a value for ΔG(poly-Lvac.→aq.) of +51.7 kcal/mol. This value compares reasonably well with a rough estimate of about +65 kcal/mol based on simulations of much shorter helices using an implicit solvent model (44). Transfer of the helix from vacuum to the membrane requires a greatly reduced free energy, -4.6 kcal/mol, due to the more hospitable environment afforded by the hydrophobic bilayer, compared to the aqueous phase. It should be noted that on account of the length of the helix, only a fraction of it is incorporated into the membrane, the rest being hydrated. The difference between the previous two values, that is ΔG(poly-Lvac→mem.) - ΔG(poly-Lvac.→aq.) = -56.3 kcal/mol, however, provides a length-independent free-energy change for inserting the helix from water to the membrane.
A final FEP calculation addressed the insertion of the polyleucine helix from vacuum to the interior of SecY. The BAR free-energy change for the insertion from vacuum, ΔG(poly-Lvac.→SecY), is equal to +11.5 kcal/mol, making the free energy of insertion from water, ΔG(poly-Laq.→SecY), -40.1 kcal/mol. That this value is greater than the insertion of the polyleucine helix from water to the membrane indicates that SecY presents an environment of intermediate hydrophobicity, between purely aqueous and purely nonpolar states. Using the thermodynamic cycle of Fig. 2, the insertion free energy of the polyleucine helix from SecY to the membrane is, thus, -16.2 kcal/mol; when a central arginine residue is present on the polyleucine helix, the free energy of insertion is -8.3 kcal/mol.
For the transfer of the background TM helix into the membrane or into SecY, the hysteresis between the forward and the backward transformations is relatively large compared to that associated to the other transfer processes simulated (see Table 1). Whereas the latter processes differ in the forward and backward directions by only 1–2 kcal/mol, transfer of the TM helix into the membrane and SecY differ by 5 and 6.5 kcal/mol, respectively. This difference is not unexpected, however, as the calculation of ΔG(poly-Lvac.→mem.) and ΔG(poly-Lvac.→SecY) constitutes a far greater computational challenge than that of the charge translocation process. Although convergence of the free-energy calculation can be attained in the aqueous medium, i.e., for ΔG(poly-Lvac.→aq.), it is markedly hampered by the heterogeneous protein and lipid environments. From a theoretical standpoint, these simulations can be viewed as extreme cases of the paradigmatic particle insertion (45), which in general converges better than its deletion counterpart. Although more dissipative, the forward creation of the helix, is, therefore, expected to yield a somewhat more reliable free-energy difference than the backward annihilation (39). To what extent the insertion processes in the membrane and in SecY are less exergonic remains, however, difficult to assess as the probability distributions for the different windows of the FEP calculations appear to overlap reasonably well, suggestive of small finite-length biases (see SI Appendix, Figs. S5 and S6).
Comparison to the Biological Hydrophobicity Scale.
The biological hydrophobicity scale was developed by measuring the insertion probability of a trial TM segment and then, assuming thermodynamic equilibrium between the inserted and noninserted states, converting this probability into an apparent free energy, i.e., ΔGapp (24). Although this scale was determined for individual amino acids placed at the center of a TM segment, by incorporating the positional dependence into ΔGapp the experimental apparent free energy of insertion for entire TM segments can be calculated, thereby permitting a direct comparison with theoretical values (17). Using the ΔG prediction server (17), for a 23-amino-acid polyleucine helix (see SI Appendix), one finds  , whereas for a polyleucine helix with a central arginine,
  is -7.9 kcal/mol. Although the latter value is in excellent agreement with the theoretical result (i.e.,
  ), the former is higher (
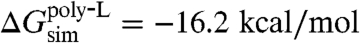 ), thereby suggesting that in the FEP calculations, the free-energy gain for leucine is slightly overestimated. The free-energy gain for transferring the polyleucine helix from SecY to the membrane is, nonetheless, significantly less than that for transferring it from the aqueous phase to the membrane (i.e., -56.3 kcal/mol). This reduction by a factor of about 3.5 demonstrates that in the two-stage insertion process described here, hydrophobic residues have a smaller free-energy gain for membrane insertion than in the direct transfer from water.
Because the present simulations utilized full helices instead of isolated amino acids, direct calculation of insertion free energies for individual residues, i.e.,  , is not possible. Because the two helices investigated are identical except for one residue, the difference between insertion of leucine and arginine can, however, be evaluated. After accounting for the distinct hydrophobic moments of the two TM helices, i.e.,
  (17), the amino-acid free-energy difference is
 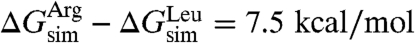 . If one assumes that the shape of the curve delineating the position of the residue vs. the free energy for the simulated polyleucine α-helix is the same as in Hessa et al. (17), the insertion free energy for an isolated, central leucine can be extracted through rescaling and comparison to the experimental value,
 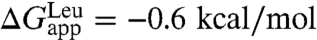 (24). This procedure yields
  and, thus,
  . The derived insertion free energy for leucine differs by only 0.4 kcal/mol, whereas that for arginine is 3.9 kcal/mol larger than the experimental value, i.e.,
  (24). Both values are, however, significantly closer than those based on simulations of direct transfer of isolated amino acids from water to the membrane, which are approximately -4 kcal/mol for leucine and +10–14 kcal/mol for arginine (28, 29, 31).
Discussion
Extensive, systematic experiments and simulations have been individually undertaken in recent years to answer the question of what governs the membrane insertion of TM segments, yet large quantitative discrepancies in the free energies of insertion persist. In particular, the experimental, translocon-based biological hydrophobicity scale appears compressed compared to the simulation-based scales, i.e., hydrophobic residues provide a smaller apparent free-energy gain upon insertion in experiments, whereas charged and polar residues incur a smaller penalty (see Table 2). In an attempt to explain this compression, Johansson and Lindahl (35) examined the effect of high-protein contents in membranes upon insertion free energies. Although this effect was found to be pronounced for arginine, reducing the free energy of insertion from water to membrane by over 10 kcal/mol, it was nonexistent for leucine, thus indicating that something was amiss in their proposed model (35). Here, the experiment–simulation disagreement is examined from a previously undescribed perspective, by considering the complete thermodynamic cycle for TM insertion. This cycle, which includes the translocon and the background polyleucine helix, matches better what is actually measured experimentally than direct insertion of isolated amino acids from water to lipid, as has been done in previous simulations. To quantify completely all legs of the cycle, extensive FEP calculations have been carried out, covering the transfer of a polyleucine helix with and without arginine from water to the membrane, from water to the interior of SecY, and from SecY to the membrane.
Table 2.
Comparison of ΔG values (kcal/mol) from different sources
An overview of the theoretical estimates based upon the FEP calculations reported here reveals moderate quantitative agreement with the experimental apparent free energies of insertion. Whereas  is reproduced almost perfectly, the same cannot be said for
  . The latter two quantities are related by the free energies for translocating a fully hydrated arginine residue borne by an infinite α-helix from water to the interior of a lipid bilayer, i.e., ΔG(Argaq.→mem.), and to the center of SecY, i.e., ΔG(Argaq.→SecY), for which both the statistical error and the finite-length bias have been shown to be marginal. However unassailable in principle, on account of the congruence with previously published simulations (27, 35), these quantities ought to be examined with additional care. Of particular interest is ΔG(Argaq.→SecY), the calculation of which relies upon two stringent choices, specifically on (i) the open state of the translocon and (ii) the relative orientation of the arginine side chain as it is progressively grown within the membrane protein. Although the model of SecY utilized here was built from the knowledge of two crystallographic structures of homologous sequences, wherein the lateral gate is either closed or partially open, a certain degree of arbitrariness necessarily resides in the assumption of the width of the opening (see SI Appendix). To what extent this assumption impacts the calculated free energy remains, however, largely unknown. Furthermore, the opening is likely a dynamic property of the lateral gate, dependent on the polypeptide currently residing in the channel (15).
Perhaps even more critical than the opening of the lateral gate of SecY is the orientation of the titratable amino acid inside the channel. Both in the present work and that of Johansson and Lindahl (35), the arginine side chain lies in close proximity to the hydrophobic core of the lipid bilayer. Although the small hysteresis and the overlap of the underlying probability distributions suggest a negligible systematic error, exhaustive sampling should embrace all possible slow degrees of freedom, including the axial rotation of the background α-helix. Swiveled by 180°, the charged residue would then be found within a protein environment of presumably higher permittivity than the interface with the lipidic acyl chains. Coarse-grained simulations examining the dependence of the free energy on the axial rotation of two helices have indeed shown that the free energy is minimal when an arginine on one helix is facing the polar regions of a neighboring helix or of SecY (36). Recent experiments suggest, however, that the hydrophobic character of the internal cavity of the translocon, particularly the pore ring, is of greater relevance to insertion than hitherto appreciated (47).
Despite the aforementioned uncertainties in the free energies calculated for specific transformations, it still remains that the present set of results yield a range in far better agreement with experiment than any previous theoretical endeavor. As illustrated in Table 2, the magnitude of the insertion free energy for charged (arginine), but also hydrophobic (leucine), residues is reduced when entering the bilayer from the translocon, compared to entering directly from the aqueous state. This coincident reduction not only provides a free-energy spread that is effectively compressed compared to previous simulation-based ones, but is also much closer to the biological one. The encouraging agreement with experiment suggests that the thermodynamic cycle depicted in Fig. 2 is representative of the true insertion process. In this process, a large fraction of the free energy required for a TM segment to enter the membrane is expended during nonequilibrium insertion by the ribosome into the translocon, followed by a thermodynamic partitioning of the TM segment between the channel and the bilayer, two environments separated by a barrier smaller than that between water and the membrane. It should be noted, however, that in the translocon-based experiments the trial TM segment may be in equilibrium between states other than translocon inserted and membrane inserted only, such as between the interior of the translocon and the aqueous phase, or even possibly between all three states.
According to a two-state partition scheme, a given TM segment is controlled by the equilibrium free energy between the translocon and the membrane. However, an isolated TM segment once in the bilayer may be metastable, possibly at the risk of being expelled later into the aqueous phase. Such thermodynamically unstable TM segments would be classified by translocon-based experiments as membrane-bound despite ultimately residing outside of it. Nonetheless, that a fully exposed arginine in the membrane core has not yet been observed provides some evidence that such a state could not persist indefinitely. In native membrane proteins, however, the risk of expulsion is mitigated by the interaction of the TM segment with neighboring proteins (36), including SecY (35). These interactions may be sufficient to shield any otherwise unfavorable TM segments, at least until protein synthesis and folding is complete. Another consequence of the putative two-stage model is that the kinetics of translocation through the translocon should be sequence dependent. Although translocation is driven by an external force coming, for instance, from elongation by the ribosome, the translocon can present varying levels of resistance. It has been observed experimentally that the addition of arginine or aspartate amino acids to a nascent peptide slows its translocation, albeit the former can also be explained by the tendency of positive residues to be retained on the cytoplasmic side (the so-called “positive-inside rule”) (48). At the opposite end of the scale, the translocation rate also depends on the hydrophobicity of the segment (49, 50). Marginally hydrophobic segments, which should steadily partition into the membrane, are hampered by their inability to slow translocation sufficiently down (49). More extensive tests of translocation kinetics, using all residues, would permit the rates and the effective free energies of insertion from the aqueous state into the translocon to be further compared.
Materials and Methods
In total, three systems were prepared using the program VMD (51). Each system contained the effectively infinite polyleucine α-helix, similar to that used in Dorairaj and Allen (27), in its specific environment, namely water, membrane, or SecY. All reported FEP calculations were carried out using NAMD 2.7b1 (52). Additional details of the simulation systems, parameters, and stratification schemes are presented in SI Appendix.
Supplementary Material
Acknowledgments.
The authors thank David Chandler for his helpful comments on this work. The authors acknowledge computer time provided by the Texas Advanced Computing Center, the National Center for Supercomputing Applications through the National Resources Allocation Committee (MCA93S028), the Grand Équipement National de Calcul Intensif, and the Centre Informatique National de l’Enseignement Supérieur. This work was supported by the National Institutes of Health (Grants R01-GM067887 and P41-RR005969) and the National Science Foundation (Grant PHY0822613).
Footnotes
The authors declare no conflict of interest.
This article is a PNAS Direct Submission.
This article contains supporting information online at www.pnas.org/lookup/suppl/doi:10.1073/pnas.1012758108/-/DCSupplemental.
References
- 1.Rapoport TA, Goder V, Heinrich SU, Matlack KE. Membrane-protein integration and the role of the translocation channel. Trends Cell Biol. 2004;14:568–575. doi: 10.1016/j.tcb.2004.09.002. [DOI] [PubMed] [Google Scholar]
- 2.Rapoport TA. Protein translocation across the eukaryotic endoplasmic reticulum and bacterial plasma membranes. Nature. 2007;450:663–669. doi: 10.1038/nature06384. [DOI] [PubMed] [Google Scholar]
- 3.Driessen AJM, Nouwen N. Protein translocation across the bacterial cytoplasmic membrane. Annu Rev Biochem. 2008;77:643–667. doi: 10.1146/annurev.biochem.77.061606.160747. [DOI] [PubMed] [Google Scholar]
- 4.Mandon EC, Trueman SF, Gilmore R. Translocation of proteins through the Sec61 and SecYEG channels. Curr Opin Cell Biol. 2009;21:501–507. doi: 10.1016/j.ceb.2009.04.010. [DOI] [PMC free article] [PubMed] [Google Scholar]
- 5.Becker T, et al. Structure of monomeric yeast and mammalian Sec61 complexes interacting with the translating ribosome. Science. 2009;326:1369–1373. doi: 10.1126/science.1178535. [DOI] [PMC free article] [PubMed] [Google Scholar]
- 6.Gumbart J, Trabuco LG, Schreiner E, Villa E, Schulten K. Regulation of the protein-conducting channel by a bound ribosome. Structure. 2009;17:1453–1464. doi: 10.1016/j.str.2009.09.010. [DOI] [PMC free article] [PubMed] [Google Scholar]
- 7.van den Berg B, et al. X-ray structure of a protein-conducting channel. Nature. 2004;427:36–44. doi: 10.1038/nature02218. [DOI] [PubMed] [Google Scholar]
- 8.Zimmer J, Nam Y, Rapoport TA. Structure of a complex of the ATPase SecA and the protein-translocation channel. Nature. 2008;455:936–943. doi: 10.1038/nature07335. [DOI] [PMC free article] [PubMed] [Google Scholar]
- 9.Tsukazaki T, et al. Conformational transition of Sec machinery inferred from bacterial SecYE structures. Nature. 2008;455:988–991. doi: 10.1038/nature07421. [DOI] [PMC free article] [PubMed] [Google Scholar]
- 10.Gumbart J, Schulten K. Molecular dynamics studies of the archaeal translocon. Biophys J. 2006;90:2356–2367. doi: 10.1529/biophysj.105.075291. [DOI] [PMC free article] [PubMed] [Google Scholar]
- 11.Gumbart J, Schulten K. The roles of pore ring and plug in the SecY protein-conducting channel. J Gen Physiol. 2008;132:709–719. doi: 10.1085/jgp.200810062. [DOI] [PMC free article] [PubMed] [Google Scholar]
- 12.Gumbart J, Schulten K. Structural determinants of lateral gate opening in the protein translocon. Biochemistry. 2007;46:11147–11157. doi: 10.1021/bi700835d. [DOI] [PubMed] [Google Scholar]
- 13.Cheng Z, Gilmore R. Slow translocon gating causes cytosolic exposure of transmembrane and lumenal domains during membrane protein integration. Nat Struct Mol Biol. 2006;13:930–936. doi: 10.1038/nsmb1146. [DOI] [PubMed] [Google Scholar]
- 14.du Plessis DJF, Berrelkamp G, Nouwen N, Driessen AJM. The lateral gate of SecYEG opens during proteins translocation. J Biol Chem. 2009;284:15805–15814. doi: 10.1074/jbc.M901855200. [DOI] [PMC free article] [PubMed] [Google Scholar]
- 15.Zhang B, Miller TF. Hydrophobically stabilized open state for the lateral gate of the Sec translocon. Proc Natl Acad Sci USA. 2010;107:5399–5404. doi: 10.1073/pnas.0914752107. [DOI] [PMC free article] [PubMed] [Google Scholar]
- 16.Kyte J, Doolittle RF. A simple method for displaying the hydropathic character of a protein. J Mol Biol. 1982;157:105–132. doi: 10.1016/0022-2836(82)90515-0. [DOI] [PubMed] [Google Scholar]
- 17.Hessa T, et al. Molecular code for transmembrane-helix recognition by the Sec61 translocon. Nature. 2007;450:1026–1030. doi: 10.1038/nature06387. [DOI] [PubMed] [Google Scholar]
- 18.Hedin LE, et al. Membrane insertion of marginally hydrophobic transmembrane helices depends on sequence context. J Mol Biol. 2010;396:221–229. doi: 10.1016/j.jmb.2009.11.036. [DOI] [PubMed] [Google Scholar]
- 19.Jaud S, et al. Insertion of short transmembrane helices by the Sec61 translocon. Proc Natl Acad Sci USA. 2009;106:11588–11593. doi: 10.1073/pnas.0900638106. [DOI] [PMC free article] [PubMed] [Google Scholar]
- 20.Heinrich SU, Rapoport TA. Cooperation of transmembrane segments during the integration of a double-spanning protein into the ER membrane. EMBO J. 2003;22:3654–3663. doi: 10.1093/emboj/cdg346. [DOI] [PMC free article] [PubMed] [Google Scholar]
- 21.Martoglio B, Hofmann MW, Brunner J, Dobberstein B. The protein-conducting channel in the membrane of the endoplasmic reticulum is open laterally toward the lipid bilayer. Cell. 1995;81:207–214. doi: 10.1016/0092-8674(95)90330-5. [DOI] [PubMed] [Google Scholar]
- 22.Mothes W, et al. Molecular mechanism of membrane protein integration into the endoplasmic reticulum. Cell. 1997;89:523–533. doi: 10.1016/s0092-8674(00)80234-2. [DOI] [PubMed] [Google Scholar]
- 23.Heinrich SU, Mothes W, Brunner J, Rapoport TA. The Sec61p complex mediates the integration of a membrane protein by allowing lipid partitioning of the transmembrane domain. Cell. 2000;102:233–244. doi: 10.1016/s0092-8674(00)00028-3. [DOI] [PubMed] [Google Scholar]
- 24.Hessa T, et al. Recognition of transmembrane helices by the endoplasmic reticulum translocon. Nature. 2005;433:377–381. doi: 10.1038/nature03216. [DOI] [PubMed] [Google Scholar]
- 25.White SH. Membrane protein integration: The biology-physics nexus. J Gen Physiol. 2007;129:363–369. doi: 10.1085/jgp.200709741. [DOI] [PMC free article] [PubMed] [Google Scholar]
- 26.Bernsel A, et al. Prediction of membrane-protein topology from first principles. Proc Natl Acad Sci USA. 2008;105:7177–7181. doi: 10.1073/pnas.0711151105. [DOI] [PMC free article] [PubMed] [Google Scholar]
- 27.Dorairaj S, Allen TW. On the thermodynamic stability of a charged arginine side chain in a transmembrane helix. Proc Natl Acad Sci USA. 2007;104:4943–4948. doi: 10.1073/pnas.0610470104. [DOI] [PMC free article] [PubMed] [Google Scholar]
- 28.Johansson ACV, Lindahl E. Position-resolved free energy of solvation for amino acids in lipid membranes from molecular dynamics simulations. Proteins. 2008;70:1332–1344. doi: 10.1002/prot.21629. [DOI] [PubMed] [Google Scholar]
- 29.MacCallum JL, Bennett WFD, Tieleman DP. Partitioning of amino acid side chains into lipid bilayers: Results from computer simulations and comparison to experiments. J Gen Physiol. 2007;129:371–377. doi: 10.1085/jgp.200709745. [DOI] [PMC free article] [PubMed] [Google Scholar]
- 30.MacCallum JL, Bennett WFD, Tieleman DP. Distribution of amino acids in a lipid bilayer from computer simulations. Biophys J. 2008;94:3393–3404. doi: 10.1529/biophysj.107.112805. [DOI] [PMC free article] [PubMed] [Google Scholar]
- 31.Choe S, Hecht KA, Grabe M. A continuum method for determining membrane protein insertion energies and the problem of charged residues. J Gen Physiol. 2008;131:563–573. doi: 10.1085/jgp.200809959. [DOI] [PMC free article] [PubMed] [Google Scholar]
- 32.Johansson ACV, Lindahl E. The role of lipid composition for insertion and stabilization of amino acids in membranes. J Chem Phys. 2009;130:185101. doi: 10.1063/1.3129863. [DOI] [PubMed] [Google Scholar]
- 33.Li L, Vorobyov I, Jr ADM, Allen TW. Is arginine charged in a membrane? Biophys J. 2008;94:L11–L13. doi: 10.1529/biophysj.107.121566. [DOI] [PMC free article] [PubMed] [Google Scholar]
- 34.Johansson ACV, Lindahl E. Titratable amino acid solvation in lipid membranes as a function of protonation state. J Phys Chem B. 2009;113:245–253. doi: 10.1021/jp8048873. [DOI] [PubMed] [Google Scholar]
- 35.Johansson ACV, Lindahl E. Protein contents in biological membranes can explain abnormal solvation of charged and polar residues. Proc Natl Acad Sci USA. 2009;106:15684–15689. doi: 10.1073/pnas.0905394106. [DOI] [PMC free article] [PubMed] [Google Scholar]
- 36.Rychkova A, Vicatos S, Warshel A. On the energetics of translocon-assisted insertion of charged transmembrane helices into membranes. Proc Natl Acad Sci USA. 2010;107:17598–17603. doi: 10.1073/pnas.1012207107. [DOI] [PMC free article] [PubMed] [Google Scholar]
- 37.White SH, von Heijne G. How translocons select transmembrane helices. Annu Rev Biophys. 2008;37:23–42. doi: 10.1146/annurev.biophys.37.032807.125904. [DOI] [PubMed] [Google Scholar]
- 38.Zwanzig RW. High-temperature equation of state by a perturbation method. I. Nonpolar gases. J Chem Phys. 1954;22:1420–1426. [Google Scholar]
- 39.Pohorille A, Jarzynski C, Chipot C. Good practices in free-energy calculations. J Phys Chem B. 2010;114:10235–10253. doi: 10.1021/jp102971x. [DOI] [PubMed] [Google Scholar]
- 40.Bennett CH. Efficient estimation of free energy differences from Monte Carlo data. J Comput Phys. 1976;22:245–268. [Google Scholar]
- 41.Kofke D, Cummings P. Precision and accuracy of staged free-energy perturbation methods for computing the chemical potential by molecular simulation. Fluid Phase Equilibr. 1998;150–151:41–49. [Google Scholar]
- 42.Deng Y, Roux B. Hydration of amino acid side chains: Nonpolar and electrostatic contributions calculated from staged molecular dynamics free energy simulations with explicit water molecules. J Phys Chem B. 2004;108:16567–16576. [Google Scholar]
- 43.Wilson MA, Pohorille A. Mechanism of unassisted ion transport across membrane bilayers. J Am Chem Soc. 1996;118:6580–6587. doi: 10.1021/ja9540381. [DOI] [PubMed] [Google Scholar]
- 44.Staritzbichler R, Gu W, Helms V. Are solvation free energies of homogeneous helical peptides additive? J Phys Chem B. 2005;109:19000–19007. doi: 10.1021/jp052403x. [DOI] [PubMed] [Google Scholar]
- 45.Widom B. Some topics in the theory of fluids. J Chem Phys. 1963;39:2808–2812. [Google Scholar]
- 46.Radzicka A, Wolfenden R. Comparing the polarities of the amino acids: Side chain distribution coefficients between the vapor phase, cyclohexane, 1-octanol, and neutral aqueous solution. Biochemistry. 1988;27:1664–1670. [Google Scholar]
- 47.Junne T, Kocik L, Spiess M. The hydrophobic core of the Sec61 translocon defines the hydrophobicity threshold for membrane integration. Mol Biol Cell. 2010;21:1662–1670. doi: 10.1091/mbc.E10-01-0060. [DOI] [PMC free article] [PubMed] [Google Scholar]
- 48.Monné M, Hessa T, Thissen L, von Heijne G. Competition between neighboring topogenic signals during membrane protein insertion into the ER. FEBS J. 2005;272:28–36. doi: 10.1111/j.1742-4658.2004.04394.x. [DOI] [PubMed] [Google Scholar]
- 49.Duong F, Wickner W. Sec-dependent membrane protein biogenesis: SecYEG, preprotein hydrophobicity and translocation kinetics control the stop-transfer function. EMBO J. 1998;17:696–705. doi: 10.1093/emboj/17.3.696. [DOI] [PMC free article] [PubMed] [Google Scholar]
- 50.Sääf A, Wallin E, von Heijne G. Stop-transfer function of pseudo-random amino acid segments during translocation across prokaryotic and eukaryotic membranes. Eur J Biochem. 1998;251:821–829. doi: 10.1046/j.1432-1327.1998.2510821.x. [DOI] [PubMed] [Google Scholar]
- 51.Humphrey W, Dalke A, Schulten K. VMD—Visual Molecular Dynamics. J Mol Graphics. 1996;14:33–38. doi: 10.1016/0263-7855(96)00018-5. [DOI] [PubMed] [Google Scholar]
- 52.Phillips JC, et al. Scalable molecular dynamics with NAMD. J Comput Chem. 2005;26:1781–1802. doi: 10.1002/jcc.20289. [DOI] [PMC free article] [PubMed] [Google Scholar]
Associated Data
This section collects any data citations, data availability statements, or supplementary materials included in this article.