Abstract
Most current approaches to multiantigen fluorescent imaging require overlaying of multiple images taken with separate filter sets as a result of differing dye excitation requirements. This requirement for false-color composite imaging prevents the user from visualizing multiple species in real time and disallows imaging of rapidly moving specimens. To address this limitation, here we investigate the use of oligodeoxyfluoroside (ODF) fluorophores as labels for antibodies. ODFs are short DNA-like oligomers with fluorophores replacing the DNA bases and can be assembled in many colors with excitation at a single wavelength. A DNA synthesizer was used to construct several short ODFs carrying a terminal alkyne group and having emission maxima of 410–670 nm. We developed a new approach to antibody conjugation, using Huisgen–Sharpless cycloaddition, which was used to react the alkynes on ODFs with azide groups added to secondary antibodies. Multiple ODF-tagged secondary antibodies were then used to mark primary antibodies. The set of antibodies was tested for spectral characteristics in labeling tubulin in HeLa cells and revealed a wide spectrum of colors, ranging from violet-blue to red with excitation through a single filter (340–380 nm). Selected sets of the differently labeled secondary antibodies were then used to simultaneously mark four antigens in fixed cells, using a single image and filter set. We also imaged different surface tumor markers on two live cell lines. Experiments showed that all colors could be visualized simultaneously by eye under the microscope, yielding multicolor images of multiple cellular antigens in real time.
Keywords: bioconjugation, immunofluorescence, multiplex
To understand the complexity and dynamics of the molecular interactions in biological systems, the parallel analysis of multiple species, such as different proteins in a cell or cells in a tissue specimen, is often needed (1, 2). The most common mode of imaging for tracking and labeling such species is fluorescence microscopy. For multispecies imaging, this typically requires the use of various fluorophores having distinct excitation and emission wavelengths. Commonly available organic fluorophores are typically used to tag biomolecules for these purposes (3, 4), which allows the visualization of three, or occasionally more, species via the use of separate excitation and emission filters. Using this strategy, one can label multiple cellular antigens, for example, by use of different commercially available dye-labeled secondary antibodies.
Although this approach is widely employed, some nonideal factors still exist. One of the major limiting issues of common organic dyes is that they have widely separated absorption spectra. This fact requires the researcher to use specialized filter sets and take a separate image for each dye; the final multicolor image is then constructed by overlaying false-color single-dye images. This approach enforces some restrictions on the researcher and equipment and places limitations on data acquisition. For example, rather than being visualized under the microscope in real time, multiple biological species labeled with different organic dyes have to be imaged separately and the images are subsequently reassembled. This becomes an even greater restriction in dynamic systems, where acquisition of multicolor images may not be possible.
A number of approaches have been investigated to overcome these limitations; chief among these has been the development of inorganic quantum dots (QDs). Excited by a single short wavelength, semiconductor QDs can generate size- and composition-tunable emission that is bright and resistant to photobleaching (5–7). However, with a size of ∼15–35 nm in diameter, quantum dots are much larger than most biological macromolecules. This intrinsic property of quantum dots hinders diffusion of their bioconjugates and reduces the specificity and efficiency of the species conjugated to them. Moreover, the large surface area and multiple conjugating groups on each particle result in inhomogeneity, due to the stochastic number and orientation of the biomolecules attached. Multivalency can also result in cross-linking multiple targets and interference with the system under study (8, 9). Several laboratories have worked to address these problems by making reduced-size and monovalent quantum dots (10, 11). Nevertheless, the size of these specialized particles (∼11 nm) remains large compared to organic dyes, and their preparation can be difficult and expensive.
One approach to solving the multispectral limitations of organic dyes has been the use of FRET dye pairs, which have been widely applied in DNA sequencing and analysis (12). In this approach, one donor fluorophore excites different acceptor fluorophores within different dye pairs, which enables a single excitation wavelength to produce varied emission colors. However, because the approach for interdye interaction is limited to the FRET mechanism, the number of emission colors can be limited in a set. In addition, the optimal separation of donor and acceptor (up to 13 base pairs) (13) can make these fluorescent tags relatively large. To our knowledge, FRET dye pairs have not been investigated for conjugation to biological macromolecules (outside of synthetic DNA) or applied in targeting specific cellular components.
Some critical properties of ideal fluorescent tags for multiplexed biological studies include (i) availability of a wide range of emission colors with a single excitation; (ii) small size compared with their conjugated biomolecules; (iii) a single functional group per each fluorescent tag to achieve monovalency; (iv) water solubility, (v) rapid synthesis, and (vi) simple bioconjugation. To achieve these properties, our laboratory has developed oligodeoxyfluorosides (ODFs), in which multiple fluorophores are assembled on a short DNA phosphodiester backbone, with fluorophores replacing DNA bases (14–16). The various forms of energy transfer within these fluorophores, including FRET, exciplex, excimer, H dimer, and other mechanisms (17, 18), lead to large Stokes shifts of as much as > 250 nm. This property enables them to generate a wide variety of emission colors with a single short-wavelength excitation (19). The emission from delocalized excited states that commonly occurs in ODFs results in their ability to be quenched with high efficiency (20–22), which has proven useful in the development of turn-on enzyme sensors (23). In addition, ODFs (which are commonly ∼1 nm in size) have much smaller size than other multicolor fluorescent tags such as FRET dye pairs, QDs, or fluorescent proteins. In principle, this should allow bioconjugates of ODFs to be less perturbed by labeling. Moreover, the synthesis of a given ODF defines the exact number of functional groups on each molecule to meet the monovalency requirement. In addition, ODFs are rapidly assembled in automated fashion on a DNA synthesizer, and conjugating groups are added during the synthesis with commercial reagents. Their DNA-like structure renders them water-soluble due to the negatively charged backbone. As a result of these properties, ODFs hold promise as a previously undescribed class of fluorescent label that might be applied more generally beyond DNA. However, it remains to be determined how readily such compounds can be conjugated to other biomolecules, such as proteins, and whether their spectral characteristics would be perturbed by such attachment.
To address these issues, here we have designed and synthesized a diverse set of alkyne-functionalized ODFs with clearly distinguishable emission colors and demonstrated a versatile antibody coupling approach using a [3 + 2] alkyne/azide cycloaddition reaction (“click” chemistry). In multiplexed immunofluorescence studies, four proteins located at different subcellular regions of a single cell were labeled and detected simultaneously by ODF-conjugated antibodies with high specificity. In addition, live tumor cells with varied receptors were specifically tagged and unambiguously differentiated by corresponding ODF-conjugated antibodies, demonstrating the feasibility of multiplexed living cell imaging with small and monovalent fluorescent tags.
Results
Design and Synthesis of ODF-Labeled Antibodies.
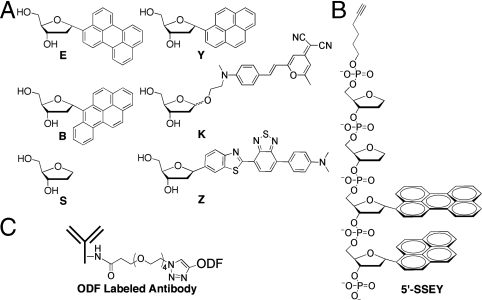
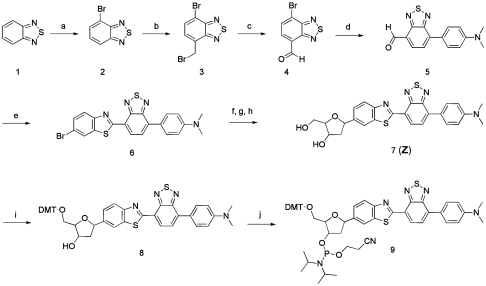
The design and selection of ODF dyes for this study were aimed at yielding a broad range of emission colors across the visible spectrum with excitation at 340–380 nm. The DNA-like ODFs chosen contained from one to as many as four fluorescent deoxyriboside monomers, and the set included five fluorophores in different arrangements (Fig. 1): perylene (E), pyrene (Y), benzopyrene (B), 4-(dicyanomethylene)-2-methyl-6-(p-dimethylaminostyryl)-4H-pyran (K), and 4-(7-(benzo[d]thiazol-2-yl)benzo[c][1,2,5]thiadiazol-4-yl)-N,N-dimethylaniline (Z) (15, 16, 19). A nonfluorescent abasic spacer (S) was also employed at the ends of the ODFs to further increase their aqueous solubility by virtue of the added phosphates. In a previous study, we developed ODFs with the sequences 5′-SB, 5′-SSYYYY, 5′-SSEY, 5′-SSEYK, and 5′-SSYKY to generate blue, cyan, green, yellow, and orange emission colors, respectively (19). To better cover the visible spectrum, we synthesized for this study a previously undescribed red-emitting monomer Z (Fig. 1; see SI Text for details). The fluorescent chromophore was assembled in five steps from benzothiadiazole (Scheme 1) via known intermediate 4. It was brominated and then coupled to a known deoxyribose precursor via Heck coupling and converted to the deoxyriboside (7) in two standard steps. Two additional routine reactions were carried out to provide the 5′-dimethoxytrityl-3′-phosphoramidite derivative (9) for use on a DNA synthesizer. Absorption and emission spectra of the deoxyriboside are given in Fig. S1; the compound has long-wavelength absorption bands at 330 and 490 nm and a prominent emission peak at 670 nm.
Fig. 1.
Structures in this study. (A) Structures of deoxyriboside monomers employed as components of ODF labels. (B) Structure of a typical alkyne-modified ODF with the sequence of 5′-alkynyl-SSEY (a turquoise-green dye). (C) Diagram showing the mode of conjugation of ODF to antibody.
Scheme 1.
Reagents and conditions: (a) Br2, 48% HBr, 72%; (b) 1,3,5-Trioxane, 48% HBr, AcOH, Trimethyl(tetradecyl)ammonium bromide, 51%; (c) NaIO4, dimethylformamide, 90%; (d) 4-(Dimethylamino)phenylboronic acid, Pd(Ph3P)4, Na2CO3, toluene, 92%; (e) 2-Amino-5-bromobenzenethiol, TsOH, toluene, 61%; (f) Cy2NMe, 3′-O-TBDPS-1,2-dehydro-2-deoxy-d-ribofuranose, PdCl2, Bu4NBr, dioxane; (g) TBAF, AcOH, THF; (h) Na(OAc)3BH, HOAc, CH3CN, THF, 43%; (i) DMT-Cl, AgNO3, Pyridine, 82%; (j) 2-Cyanoethyl N,N-diisopropylchlorophosphoramidite, DIEA, CH2Cl2, 89%.
We then rationally designed several previously undescribed ODF sequences containing Z that were expected to emit at ca. 670 nm. These ODFs as antibody conjugates were compared in a fixed-cell assay (see Fig. S2 and SI Text). As a result, we identified the sequence 5′-SSYZY, which had the desired red emission wavelength and the brightest emission when conjugated (Table S1). Interestingly, the compound in pure aqueous solution has a very low quantum yield at red wavelengths, but in low-polarity solvents, and as an antibody conjugate, its emission is considerably enhanced (Fig. S3). Thus, 5′-SSYZY was incorporated in the subsequent studies along with 5′-SB, 5′-SSYYYY, 5′-SSEY, 5′-SSEYK, and 5′-SSYKY. All ODFs in alkyne-derivatized form (see below) were characterized by MALDI-TOF mass spectrometry as well as by their absorption and emission spectra (Figs. S3–S8).
We then covalently coupled ODFs to antibodies. Oligonucleotides can be conjugated to proteins through various chemistries, including disulfide bond formation (24), biotin streptavidin interaction (25), maleimide-thiol coupling (26), etc. Recently, Huisgen–Sharpless cycloaddition chemistry as a simple, mild, and generally applicable strategy has also been explored (27). In this approach, the azide moiety was incorporated via in vitro translation into an esterase and the alkyne group was chemically conjugated to DNA. In the current study, we simplified this strategy by using a commercially available hexynyl phosphoramidite for DNA modification. Thus a DNA synthesizer was used to construct the ODFs and to functionalize them directly during the synthesis by adding the alkyne group at the 5′ terminus (Fig. 1B). For reaction with this, azide groups were introduced into goat anti-rat IgG antibodies by modifying lysine residues with commercially available 3-(azidotetra(ethyleneoxy))propionic acid succinimidyl ester, which required only a simple 30-min incubation of the antibody with 600 μM of the azide labeling compound in aqueous buffer. These azide-modified antibodies were subsequently conjugated to the six alkyne-functionalized ODFs via standard Cu(I)-mediated cycloaddition reactions (28–30) at 37 °C overnight (Scheme S1). For comparison of spectral properties and coupling efficiency, we followed the same procedure to label the antibody with Alexa 488, a conventional organic dye, employing a commercially available alkyne-modified derivative of this fluorophore. Excess dyes were removed from the labeled antibodies by size exclusion chromatography.
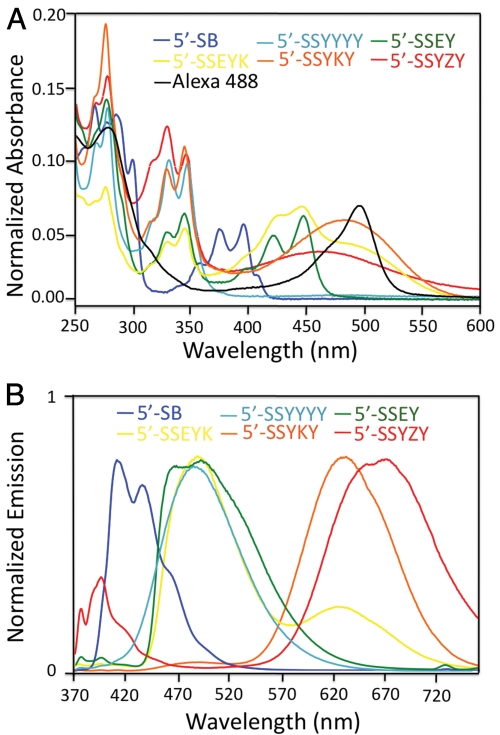
Labeled antibodies were characterized by absorption and emission spectra, as well as by the labeling number per antibody (see Fig. 2, Table S2, and SI Text). In the absorption spectra of ODF- and Alexa 488-conjugated antibodies (Fig. 2A), the peaks centered at 280 nm, 340–490 nm, and 495 nm correspond to antibodies, ODFs, and Alexa 488, respectively. The relative peak height data established that ODFs and Alexa 488 were successfully conjugated to antibodies using the cycloaddition chemistry. To maximize the fluorescent signal from each antibody molecule and minimize interference by the label in its antigen binding ability, we adjusted the dye conjugation times to achieve the optimal number of ODFs and Alexa 488 moieties on each antibody. From the absorption spectra, we calculated that the optimal labeling number for ODF-conjugated antibodies was 2.1–3.5, which is comparable with 2.8 for the Alexa 488-conjugated antibody (see SI Text for details). The emission spectra of ODF-conjugated antibodies (Fig. 2B) shows a broad range of emission properties upon the same excitation at 360 nm, with emission maxima ranging from 410–670 nm. The spectra closely resemble those previously reported for the ODFs alone (19), which establishes that the protein conjugation does not substantially perturb their emission properties.
Fig. 2.
(A) Normalized absorption spectra of ODF-conjugated IgGs antibodies and Alexa 488-conjugated IgG. (B) Normalized emission spectra of ODF-conjugated IgGs.
Microtubule Labeling with ODF-Conjugated Antibodies.
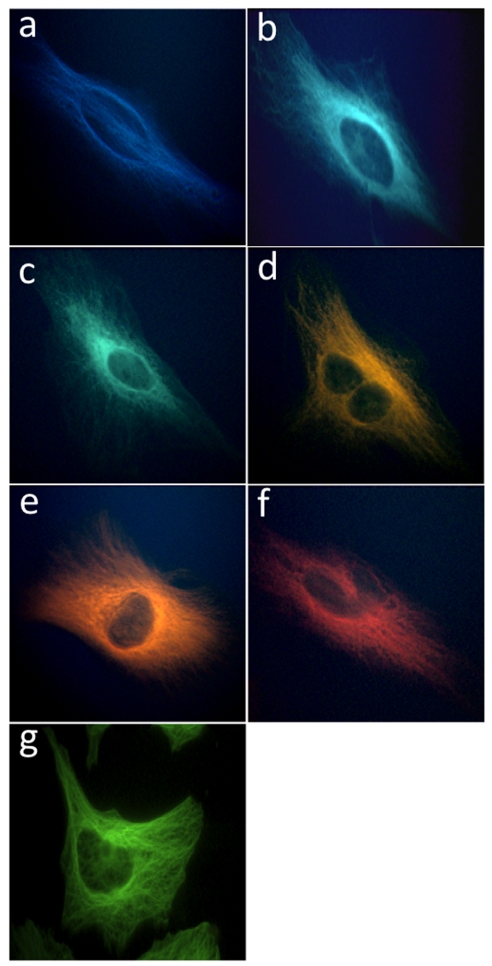
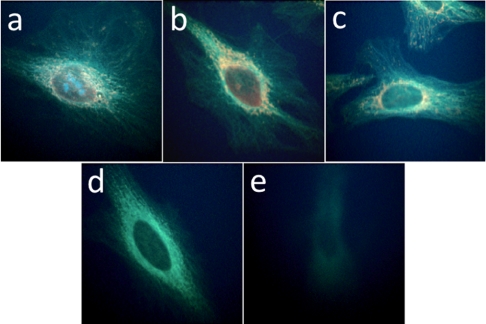
To investigate the ability of ODF-conjugated antibodies to mark a specific cellular antigen, we targeted α-tubulin, a constituent of microtubules. HeLa cells were fixed on glass slides and stained with rat anti-α-tubulin antibody, and subsequently incubated with goat anti-rat IgGs conjugated with 5′-SB (blue), 5′-SSYYYY (cyan), 5′-SSEY (turquoise-green), 5′-SSEYK (gold), 5′-SSYKY (orange), 5′-SSYZY (red), and Alexa 488 (green) (Fig. 3 A–G, respectively). The samples were imaged under an epifluorescence microscope using 340- to 380-nm excitation and a single long-pass (> 420 nm) emission filter. The real-color images (Fig. 3) demonstrate that ODF-conjugated antibodies can be used successfully to detect cellular targets in a specific manner, and with similar results as the Alexa488-conjugated antibody. This indicates that labeling with the relatively small and monovalent ODFs can retain the recognition function of the antibody similarly to labeling with a classical fluorophore.
Fig. 3.
Real-color images of microtubules labeled with ODF-conjugated IgGs (A–F) and Alexa 488-conjugated IgG (G). Fixed HeLa cells were incubated with rat anti-α-tubulin antibody and subsequently with the labeled IgG. A single filter set (ex 340–380 nm and em > 420 nm) was used to observe signals of (A) 5′-SB, (B) 5′-SSYYYY, (C) 5′-SSEY, (D) 5′-SSEYK, (E) 5′-SSYKY, and (F) 5′-SSYZY. A different filter set (ex 450–490 nm and em > 520 nm) was used to obtain image (G) with Alexa 488.
Quadruple Labeling with ODF-Conjugated Antibodies.
To demonstrate the feasibility of imaging multiplexed cellular targets in the same experiment, we labeled the nucleolus, nucleus, mitochondria, and microtubules with different ODF-conjugated antibodies. Fixed HeLa cells were incubated with human antinuclear antigen antibodies and mouse antioxphos complex V inhibitor protein antibody to label nuclear antigens and mitochondria, respectively. Then, the primary antibodies were tagged by 5′-SSYZY-conjugated goat anti-human IgG (red) and 5′-SSEYK conjugated goat anti-mouse IgG (gold). To minimize the cross reactivity among the secondary antibodies, microtubules were subsequently labeled with rat anti-α-tubulin antibody, followed by 5′-SSEY conjugated goat anti-rat IgG (green). To label the nucleolus, the cells were incubated sequentially with mouse antinucleolin antibody and 5′-SB conjugated goat anti mouse IgG (blue) (Fig. 4A). When examined under an epifluorescence microscope equipped with a 340- to 380-nm excitation filter and a > 420 nm long-pass emission filter, four different colors in this real-color image were clearly visible and distinguishable to the eye. Thus the four separate cellular targets in single cells were detected simultaneously and differentiated unambiguously.
Fig. 4.
Quadruple labeling of nucleoli, nuclei, mitochondria, and microtubules with ODF-conjugated IgGs. (A) Nucleoli of fixed Hela cells were labeled with mouse antinucleolin antibody and subsequently with 5′-SB conjugated goat anti-mouse IgG (blue); nuclei were labeled with human antinuclear antigen antibodies and subsequently with 5′-SSYZY conjugated goat anti-human IgG (red); mitochondria were labeled with mouse antioxphos complex V inhibitor protein antibody and subsequently with 5′-SSEYK conjugated goat anti mouse IgG (gold); microtubules were labeled with rat anti-α-tubulin antibody and subsequently with 5′-SSEY conjugated goat anti-rat IgG (green). (B) Control for A without mouse antinucleolin antibody. (c) Control for A without mouse antinucleolin antibody and human antinuclear antigen antibodies. (D) Control for A without mouse antinucleolin antibody, human antinuclear antigen antibodies, and mouse antioxphos complex V inhibitor protein antibody. (E) Control for A without primary antibodies. A single filter set (ex 340–380 nm and em > 420 nm) was used to obtain real-color images.
We performed control experiments by eliminating the incubation with one or multiple primary antibodies, while maintaining the incubation with all the four ODF-conjugated secondary antibodies. Without the incubation with mouse antinucleolin antibody, little or no blue emission from the nucleolus was observed (Fig. 4B), indicating the high specificity of 5′-SB conjugated goat anti-mouse IgG. Without the incubation with mouse antinucleolin antibody and human antinuclear antigen antibodies, little or no red emission from the nucleus was observed (Fig. 4C). Without the incubation with mouse antinucleolin antibody, human antinuclear antigen antibodies and mouse antioxphos complex V inhibitor protein antibody, little or no gold emission from mitochondria was observed (Fig. 4D). In controls lacking all primary antibodies, only weak background emission was observed (Fig. 4E), which may partially result from cellular autofluorescence. In these real-color images, ODF-conjugated secondary antibodies generated very little nonspecific binding signals in the absence of their corresponding primary antibodies, demonstrating that ODF-conjugated antibodies are specific for their targets and that the presence of the ODF labels does not cause nonspecific aggregation.
Detection of Different Tumor Cells with ODF-Conjugated Antibodies.
To assess the effectiveness and the specificity of ODF-conjugated antibodies in detection of antigens on the surface of live cells, we labeled carcinoembryonic antigen (CEA) on cultured LS174T cells (31). The cells were incubated with 5′-SSEY-conjugated goat anti-human CEA antibodies, which target the extracellular domain of CEA. Examined under an epifluorescence microscope, bright emission from CEA was clearly detected on all the LS174T cells (Fig. S9, Middle). When HeLa cells were incubated with 5′-SSEY-conjugated goat anti-human CEA antibodies, little or no fluorescence signal was observed (Fig. S9, Top). In the presence of a mixture of the two types of cells, only LS174T cells were clearly labeled and were clearly distinguished from HeLa cells (Fig. S9, Bottom). The results indicate that ODF-conjugated antibodies are effective for marking tumor cells expressing specific antigens.
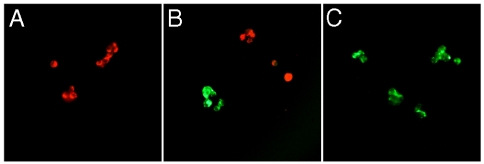
To further demonstrate the feasibility of specific tumor cell typing and differentiation in a multiplexed manner, we carried out simultaneous two-color cell imaging of CEA and integrin on LS174T and A431 cells, respectively. These two cell lines were incubated with a combination of 5′-SSEY-conjugated goat anti-human CEA antibodies and 5′-SSYZY-conjugated goat antiintegrin antibodies. When examined under an epifluorescence microscope equipped with a 340- to 380-nm excitation filter and a > 420 nm long-pass emission filter, strong 5′-SSYZY emission (red) emerged from A431 cells (Fig. 5A), whereas LS174T cells exhibited distinct 5′-SSEY emission (green) (Fig. 5C). With the same microscope, these two cell lines were clearly distinguished by eye on the basis of their fluorescence emission when both cell lines were present as a mixture (Fig. 5B); i.e., the two colors were visible in real time without image processing. The minimal overlapping of colors between cell types again suggests that the ODF-conjugated antibodies bind with high specificity.
Fig. 5.
Multiplexed detection and differentiation of different tumor cells with ODF-conjugated IgG. (A) A431 cells alone, (B) mixed A431 cells and LS174T cells, and (C) LS174T cells alone were incubated with 5′-SSYZY(red)-conjugated goat anti-integrin antibodies along with 5′-SSEY(green)-conjugated goat anti-human CEA antibodies. A single filter set (ex 340–380 nm and em > 420 nm) was used to obtain real-color images.
Discussion
Here we have demonstrated the feasibility of multiplexed intracellular and extracellular imaging with small and monovalent fluorescent ODF antibody conjugates. Previously, we described as many as 23 spectrally different ODFs with distinct emission colors upon single wavelength excitation (19). The dyes are water soluble, nontoxic, and stable in vivo (19). The current experiments show that such compounds can be readily conjugated to antibodies and used in simultaneous multiantigen imaging. The varied emission colors from different ODFs are clearly visible and unambiguously distinguished by eye under the microscope. In addition, we expect that with the use of a microscope capable of spectral imaging and deconvolution, multiple species in a biological system can be monitored and analyzed simultaneously and quantitatively. As the details of biological pathways in the cell are uncovered, the complexity of interactions of multiple protein players in any given pathway is becoming increasingly evident, and the use of ODF labels may simplify studies of such complex systems. Another of the chief advantages of multispectral dye sets is utility in dynamic systems; thus it will be of interest in the future to apply ODF dyes in studies of intra- and intercellular dynamics.
The current experiments demonstrate that functionalized ODF dyes are easily prepared and can be conjugated to antibodies in simple fashion. The ODFs are first assembled on a DNA synthesizer from a small number of components, and the conjugating group (an alkyne) is added as part of this automated synthesis. The preparation of an antibody for conjugation is done in one step with a commercially available azide-carrying reagent. No protecting groups are required for either of the reactive groups, unlike (for example) thiol-based conjugation strategies, and no undesired side products are seen. The final ODF conjugation to the antibody is also done in one step using mild cycloaddition chemistry, yielding labeling numbers the same as with a standard commercial dye. The cellular imaging results show that the ODF labels retain their spectral characteristics as antibody conjugates and that the labels do not interfere with normal antibody binding function.
Finally, ODFs have multiple advantages as fluorescent tags for molecular and cellular imaging. The large Stokes shifts and multispectral emission enable the detection of multiple components of a biological system simultaneously. Additionally, due to their relatively small size, multiple ODF moieties can be conjugated to a single biomolecule. Thus the fluorescent signal is amplified without interference of biomolecular function. Moreover, because it is explicitly synthesized, the number of functional groups on an ODF moiety is well defined to achieve monovalent attachment, which avoids cross-linking between multiple targets. Finally, assembled by DNA synthesizer, ODFs are simple to prepare and functionalize. Because libraries containing a large number of ODFs with different compositions and sequences can be rapidly synthesized (15, 16, 19), one can screen and identify ODFs with properties as desired. For example, dyes with elevated photostability can be identified (16). As a result of these properties, we expect that ODFs may have wide applications in investigating complex and dynamic biological systems in a multiplexed manner.
Materials and Methods
Synthesis of Alkyne-Functionalized ODFs.
The alkyne-functionalized ODFs (5′-SB, 5′-SSYYYY, 5′-SSEY, 5′-SSEYK, 5′-SSYKY, and 5′-SSYZY) were prepared on a DNA synthesizer from S, B, Y, E, K, and Z monomer deoxyriboside phosphoramidites and a commercial hexyne phosphoramidite (Glen Research). Details of synthesis and characterization are given in SI Text.
Synthesis of ODF-Conjugated Antibodies.
Antibodies were functionalized with azide groups with a commercial azide/NHS ester reagent (Invitrogen), and the six alkyne-functionalized ODFs were conjugated to various azido-antibodies via Huisgen–Sharpless cycloaddition chemistry. The resulting ODF-conjugated antibodies were purified by size exclusion chromatography and characterized by UV-visible spectrometry and fluorescence emission spectrometry, and the number of ODF labels on each antibody molecule was calculated. Details of conjugation and characterization methods and data are given in SI Text.
Cell Culture.
HeLa CCL-2 cells (ATCC), LS 174T cells (ATCC), A431 cells (ATCC), and mixed cell lines were maintained in DMEM supplemented with 10% fetal bovine serum, 100 U/mL penicillin, and 100 g/mL streptomycin (all reagents from Invitrogen) in a humidified atmosphere at 37 °C with 5% CO2. Cells were plated on chambered slides (0.2-mL medium/chamber) and allowed to reach 60% confluency in 1–2 d.
Cell Fixation.
Cultured HeLa CCL-2 cells were fixed with 4% formaldehyde at 37 °C for 15 min, permeabilized with 0.2% (vol/vol) Triton X-100 at room temperature for 15 min and subsequently blocked in 1× blocking buffer [1% (wt/vol) bovine serum albumin, 0.1% (vol/vol) Triton X-100, 10% (vol/vol) normal goat serum] at room temperature for 1 h.
Labeling of Microtubules.
Fixed and blocked HeLa CCL-2 cells were incubated with 5 μg/mL rat anti-α-tubulin (Novus) at room temperature for 1 h, followed by incubation in 10 μg/mL ODF labeled goat anti-rat IgG (Invitrogen) at room temperature for 1 h. Stained cells were mounted on slides in Cytoseal 60 (Thermo Scientific) with coverslips. Samples were imaged under a Nikon Eclipse E800 epifluorescence microscope equipped with 100× objective. Images were captured using a Spot RT (Real-Time) digital camera and Spot Advanced Imaging software with excitation 340–380 nm and emission > 420 nm. Contrast and brightness of all the real-color images shown in Fig. 3 A–F were adjusted simultaneously.
Multiplex Labeling of Nucleoli, Nuclei, Mitochondria, and Microtubules.
Fixed and blocked HeLa CCL-2 cells were incubated with 5 μg/mL mouse anti-OxPhos complex V inhibitor protein (Invitrogen) mixed with prediluted human antinuclear antigen antibody (Inova Diagnostics) at room temperature for 1 h, followed by incubation in 10 μg/mL 5′-SSEYK-labeled goat anti-mouse IgG (Invitrogen) mixed with 10 μg/mL 5′-SSYZY labeled goat anti-human IgG (Thermo Scientific) at room temperature for 1 h. Then the cells were rinsed and incubated sequentially with 1× blocking buffer at room temperature for 1 h, 5 μg/mL rat anti-α-tubulin at room temperature for 1 h, and 10 μg/mL 5′-SSEY labeled goat anti-rat IgG at room temperature for 1 h. Finally, the cells were rinsed and incubated sequentially with 1× blocking buffer at room temperature for 1 h, 5 μg/mL mouse antinucleolin antibody (Invitrogen) at room temperature for 1 h, and 10 μg/mL 5′-SB labeled goat anti-mouse IgG at room temperature for 1 h. Stained cells were mounted on slides in Cytoseal 60 (Thermo Scientific) with coverslips. Samples were imaged under a Nikon Eclipse E800 epifluorescence microscope equipped with 100× objective. Images were captured using a Spot RT digital camera and Spot Advanced Imaging software with excitation 340–380 nm and emission > 420 nm. Contrast and brightness of all the real-color images shown in Fig. 4 were adjusted simultaneously.
Detection of CEA on Tumor Cell Surfaces.
Cultured HeLa CCL-2 cells, LS 174T cells, and the mixed two cell lines were rinsed with PBS and were subsequently incubated with 5 μg/mL of 5′-SSEY conjugated goat anti-human CEA antibodies (BiosPacific) at 4 °C for 1 h. Then the cells were rinsed with PBS again before imaging, which was carried out using a Zeiss LSM 510 confocal laser scanning microscope through a 40× objective. The argon laser (458 nm) was used to excite 5′-SSEY (Fig. S9). Image acquisition was performed at the Cell Sciences Imaging Facility of Beckman Center for Molecular and Genetic Medicine, Stanford University Medical Center, Stanford, CA.
Detection and Differentiation of Live Tumor Cells.
Cultured A431 cells (ATCC), LS 174T cells (ATCC), and the mixed two cell lines were rinsed with PBS and were subsequently incubated with 5 μg/mL of 5′-SSYZY conjugated goat anti-integrin antibodies (Santa Cruz Biotechnology) and 5 μg/mL of 5′-SSEY conjugated goat anti- human CEA antibodies (BiosPacific) at 4 °C for 1 h. Then the cells were rinsed with PBS again before imaging, which was carried out using a Nikon Eclipse E800 epifluorescence microscope through a 20× objective. Images were captured using a Spot RT digital camera and Spot Advanced Imaging software with excitation 340–380 nm and emission > 420 nm. Contrast of all the real-color images shown in Fig. 5 was adjusted simultaneously.
Supplementary Material
Acknowledgments.
We thank the National Institutes of Health (GM0672901) and a Stanford Bio-X collaborative grant for support. Y.N.T. acknowledges an A-STAR fellowship.
Footnotes
The authors declare no conflict of interest.
*This Direct Submission article had a prearranged editor.
This article contains supporting information online at www.pnas.org/lookup/suppl/doi:10.1073/pnas.1017349108/-/DCSupplemental.
References
- 1.Stoll S, Delon J, Brotz TM, Germain RN. Dynamic imaging of T cell-dendritic cell interactions in lymph nodes. Science. 2002;296:1873–1876. doi: 10.1126/science.1071065. [DOI] [PubMed] [Google Scholar]
- 2.Gaietta G, et al. Multicolor and electron microscopic imaging of connexin trafficking. Science. 2002;296:503–507. doi: 10.1126/science.1068793. [DOI] [PubMed] [Google Scholar]
- 3.Laughlin ST, Baskin JM, Amacher SL, Bertozzi CR. In vivo imaging of membrane-associated glycans in developing zebrafish. Science. 2008;320:664–667. doi: 10.1126/science.1155106. [DOI] [PMC free article] [PubMed] [Google Scholar]
- 4.Laughlin ST, Bertozzi CR. Imaging the glycome. Proc Natl Acad Sci USA. 2009;106:12–17. doi: 10.1073/pnas.0811481106. [DOI] [PMC free article] [PubMed] [Google Scholar]
- 5.Bruchez JM, Moronne M, Gin P, Weiss S, Alivisatos AP. Semiconductor nanocrystals as fluorescent biological labels. Science. 1998;281:2013–2016. doi: 10.1126/science.281.5385.2013. [DOI] [PubMed] [Google Scholar]
- 6.Jaiswal JK, Mattoussi H, Mauro JM, Simon SM. Long-term multiple color imaging of live cells using quantum dot bioconjugates. Nat Biotechnol. 2002;21:47–51. doi: 10.1038/nbt767. [DOI] [PubMed] [Google Scholar]
- 7.Wu X, et al. Immunofluorescent labeling of cancer marker Her2 and other cellular targets with semiconductor quantum dots. Nat Biotechnol. 2002;21:41–46. doi: 10.1038/nbt764. [DOI] [PubMed] [Google Scholar]
- 8.Resch-Genger U, Grabolle M, Cavaliere-Jarico S, Nitschke R, Nann T. Quantum dots versus organic dyes as fluorescent labels. Nat Methods. 2008;5:763–775. doi: 10.1038/nmeth.1248. [DOI] [PubMed] [Google Scholar]
- 9.Smith AM, Nie S. Next-generation quantum dots. Nat Biotechnol. 2009;27:732–733. doi: 10.1038/nbt0809-732. [DOI] [PMC free article] [PubMed] [Google Scholar]
- 10.You C, et al. Self-controlled monofunctionalization of quantum dots for multiplexed protein tracking in live cells. Angew Chem Int Edit. 2010;49:4108–4112. doi: 10.1002/anie.200907032. [DOI] [PubMed] [Google Scholar]
- 11.Howarth M, et al. Monovalent, reduced-size quantum dots for imaging receptors on living cells. Nat Methods. 2008;5:397–399. doi: 10.1038/nmeth.1206. [DOI] [PMC free article] [PubMed] [Google Scholar]
- 12.Ju J, Ruan C, Fuller CW, Glazer AN, Mathies RA. Fluorescence energy transfer dye-labeled primers for DNA sequencing and analysis. Proc Natl Acad Sci USA. 1995;92:4347–4351. doi: 10.1073/pnas.92.10.4347. [DOI] [PMC free article] [PubMed] [Google Scholar]
- 13.Tong AK, Li Z, Jones GS, Russo JJ, Ju J. Combinatorial fluorescence energy transfer tags for multiplex biological assays. Nat Biotechnol. 2001;19:756–759. doi: 10.1038/90810. [DOI] [PubMed] [Google Scholar]
- 14.Ren RX, Chaudhuri NC, Paris PL, Rumney IS, Kool ET. Naphthalene, phenanthrene, and pyrene as DNA base analogues: synthesis, structure, and fluorescence in DNA. J Am Chem Soc. 1996;118:7671–7678. doi: 10.1021/ja9612763. [DOI] [PMC free article] [PubMed] [Google Scholar]
- 15.Gao J, Straessler C, Tahmassebi DC, Kool ET. Libraries of composite polyfluors built from fluorescent deoxyribosides. J Am Chem Soc. 2002;124:11590–11591. doi: 10.1021/ja027197a. [DOI] [PubMed] [Google Scholar]
- 16.Gao J, Watanabe S, Kool ET. Modified DNA analogues that sense light exposure with color changes. J Am Chem Soc. 2004;126:12748–12749. doi: 10.1021/ja046910o. [DOI] [PubMed] [Google Scholar]
- 17.Cuppoletti A, Cho Y, Park JS, Strassler C, Kool ET. Oligomeric fluorescent labels for DNA. Bioconjugate Chem. 2005;16:528–534. doi: 10.1021/bc0497766. [DOI] [PubMed] [Google Scholar]
- 18.Wilson JN, Gao J, Kool ET. Oligodeoxyfluorosides: Strong sequence dependence of fluorescence emission. Tetrahedron. 2007;63:3427–3433. doi: 10.1016/j.tet.2006.07.113. [DOI] [PMC free article] [PubMed] [Google Scholar]
- 19.Teo YN, Wilson JN, Kool ET. Polyfluores on a DNA backbone: a multicolor set of labels excited at one wavelength. J Am Chem Soc. 2009;131:3923–3933. doi: 10.1021/ja805502k. [DOI] [PMC free article] [PubMed] [Google Scholar]
- 20.Wilson JN, Teo YN, Kool ET. Efficient quenching of oligomeric fluorophores on a DNA backbone. J Am Chem Soc. 2007;129:15426–15427. doi: 10.1021/ja075968a. [DOI] [PMC free article] [PubMed] [Google Scholar]
- 21.Wilson JN, Cho Y, Tan S, Cuppoletti A, Kool ET. Quenching of fluorescent nucleobases by neigboring DNA: The “insulator” concept. ChemBioChem. 2008;9:279–285. doi: 10.1002/cbic.200700381. [DOI] [PubMed] [Google Scholar]
- 22.Teo YN, Wilson JN, Kool ET. Polyfluorophore labels on DNA: Dramatic sequence dependence of quenching. Chem-Eur J. 2009;15:11551–11558. doi: 10.1002/chem.200901607. [DOI] [PMC free article] [PubMed] [Google Scholar]
- 23.Dai N, Teo YN, Kool ET. DNA-polyfluorophore excimers as sensitive reporters for esterases and lipases. Chem Commun. 2010;46:1221–1223. doi: 10.1039/b926338a. [DOI] [PMC free article] [PubMed] [Google Scholar]
- 24.Corey DR, Schultz PG. Generation of a hybrid sequence-specific single-stranded deoxyribonuclease. Science. 1987;238:1401–1403. doi: 10.1126/science.3685986. [DOI] [PubMed] [Google Scholar]
- 25.Sano T, Smith CL, Cantor CR. Immuno-PCR: very sensitive antigen detection by means of specific antibody-DNA conjugates. Science. 1992;258:120–122. doi: 10.1126/science.1439758. [DOI] [PubMed] [Google Scholar]
- 26.Schweitzer B, et al. Immunoassays with rolling circle DNA amplification: A versatile platform for ultrasensitive antigen detection. Proc Natl Acad Sci USA. 2000;97:10113–10119. doi: 10.1073/pnas.170237197. [DOI] [PMC free article] [PubMed] [Google Scholar]
- 27.Humenik M, Huang Y, Wang Y, Sprinzl M. C-terminal incorporation of bio-orthogonal azide groups into a protein and preparation of protein-oligodeoxynucleotide conjugates by CuI-catalyzed cycloaddition. ChemBioChem. 2007;8:1103–1106. doi: 10.1002/cbic.200700070. [DOI] [PubMed] [Google Scholar]
- 28.Kolb HC, Finn MG, Sharpless KB. Click chemistry: Diverse chemical function from a few good reactions. Angew Chem Int Edit. 2001;40:2004–2021. doi: 10.1002/1521-3773(20010601)40:11<2004::AID-ANIE2004>3.0.CO;2-5. [DOI] [PubMed] [Google Scholar]
- 29.El-Sagheer AH, Brown T. Click chemistry with DNA. Chem Soc Rev. 2010;39:1388–1405. doi: 10.1039/b901971p. [DOI] [PubMed] [Google Scholar]
- 30.Mamidyala SK, Finn MG. In situ click chemistry: probing the binding landscapes of biological molecules. Chem Soc Rev. 2010;39:1252–1261. doi: 10.1039/b901969n. [DOI] [PubMed] [Google Scholar]
- 31.D’Souzaa AL, et al. A strategy for blood biomarker amplification and localization using ultrasound. Proc Natl Acad Sci USA. 2009;106:17152–17157. doi: 10.1073/pnas.0903437106. [DOI] [PMC free article] [PubMed] [Google Scholar]
Associated Data
This section collects any data citations, data availability statements, or supplementary materials included in this article.


