

Abstract
Trimethylation of histone 3 lysine 27 (H3K27me3) is a critical epigenetic mark for the maintenance of gene silencing. Additional accumulation of DNA methylation in target loci is thought to cooperatively support this epigenetic silencing during tumorigenesis. However, molecular mechanisms underlying the complex interplay between the two marks remain to be explored. Here we demonstrate that activation of PI3K/AKT signaling can be a trigger of this epigenetic processing at many downstream target genes. We also find that DNA methylation can be acquired at the same loci in cancer cells, thereby reinforcing permanent repression in those losing the H3K27me3 mark. Because of a link between PI3K/AKT signaling and epigenetic alterations, we conducted epigenetic therapies in conjunction with the signaling-targeted treatment. These combined treatments synergistically relieve gene silencing and suppress cancer cell growth in vitro and in xenografts. The new finding has important implications for improving targeted cancer therapies in the future.
Keywords: Epigenetic silencing, H3K27me3, DNA methylation, PI3K/AKT signaling, breast cancer
Introduction
Epigenetic silencing of tumor suppressor genes is one of common molecular alterations observed during tumorigenesis (1, 2). Although DNA methylation of promoter CpG islands is a well-known epigenetic mark, post-translational modifications of histone also have been found in cancer cells (3–5). Among many types of histone modifications, trimethylation of histone 3 lysine 27 (H3K27me3, a repressive mark) is critical for normal and aberrant differentiation of stem and progenitor cells (6). This lysine residue is tri-methylated by the histone methyltransferase EZH2, a key component of polycomb repressive complex 2 (PRC2) (7). The formation of PRC2 further recruits PRC1 to target loci, thereby causing transcription repression of developmental genes, such as homeobox families (8).
Studies have suggested that polycomb-mediated histone modifications may initiate epigenetic silencing of tumor suppressor genes in cancer cells (3, 4). Indeed, PRC2 targets marked by the enrichment of H3K27me3 in either embryonic stem cells or cancer-initiating cells are prone to undergo hypermethylation in cancer cells (9–13). Although DNA methyltransferases can be recruited to target loci for de novo methylation through polycomb-mediated H3K27me3 in an experimental model (14), the mechanism involved in this epigenetic process remains to be clearly defined. Nonetheless, progressive accumulation of DNA methylation in promoter CpG islands, or promoter hypermethylation, may render these loci to undergo long-term silencing. Therefore, the complex interplay between H3K27me3 and promoter hypermethylation is thought to be essential for establishing heritable silencing during neoplastic development. Interestingly, several studies observed that many hypermethylated CpG islands actually contain low levels of H3K27me3 in cancer cells (15, 16). On the other hand, genetic knock-down of EZH2 did not alter DNA methylation profiles of candidate CpG islands (17). As increasing evidence suggests that nucleosomes and chromatin modifications construct an indispensable context for DNA methylation (18), understanding this epigenetic mechanism may shed new insight into long-term control of gene silencing in cancer.
We previously reported that epigenetic silencing of the tumor suppressor gene CST6 is initiated in mammary epithelial cells exposed to tumor stromal fibroblasts (19). This aberrant microenvironment activates epithelial AKT1 kinase, resulting in the enrichment of H3K27me3 in the CST6 promoter region (19). AKT1 kinase is a key downstream effector of the phosphoinositide 3-kinase (PI3K) signaling pathway that regulates diverse cellular functions, including growth, proliferation, survival, metabolism, motility, angiogenesis and vesicle trafficking (20, 21). To determine whether genome-wide reprogramming of H3K27me3 is instructed by PI3K/AKT signaling, we performed chromatin immunoprecipitation combined with next-generation sequencing (ChIP-seq) and expression microarray analysis in an immortalized mammary epithelial cell line with forced expression of AKT1. By integrating ChIP-seq and expression microarray data, we identified 488 down-regulated loci with increased levels of H3K27me3 in transfected cells relative to vehicle control. We then narrowed the loci down to 180 with a high likelihood of epigenetic repression through activated PI3K/AKT signaling in breast cancer cells lines. The status of promoter hypermethylation was assessed in 40 candidate genes suppressed by activated PI3K/AKT signaling. While both H3K27me3 and promoter hypermethylation were present in selected CpG islands, these epigenetic marks could be mutually exclusive in other loci, suggesting that the two mechanisms complement each other for gene silencing. As we demonstrated a link between PI3K/AKT signaling and epigenetic silencing, the use of both PI3K/AKT inhibitors and epigenetic agents can be a novel therapeutic strategy. Indeed, our data showed that these combined treatments synergistically relieve epigenetic silencing of target genes and suppress cancer cell growth. Therefore, the experimental evidence presented in this study has important implications for improving targeted therapies currently used for cancer treatments.
Materials and Methods
Breast cancer cell lines
Breast cancer cell lines used in this study were selected from the NCI-ICBP-45 kit (ATCC 90-4500K) provided through the Integrative Cancer Biology Program (ICBP) at NCI in November 2008. All cell lines have been tested and authenticated by ATCC and maintained in our laboratory for less than 6 months during which all experiments were conducted.
Chromatin immunoprecipitation coupled with massively parallel DNA sequencing (ChIP-seq)
A rabbit polyclonal antibody against H3K27me3 (CS-069-100; Diagenode; Sparta, NJ) was used for the ChIP assay described previously (19). Immunoprecipitated DNA (5 ng) was subjected to size selection of fragments around 200-bp in length. Sequencing libraries were consequently constructed by adaptor ligation and PCR. Sequencing (4 lanes per sample) was performed by Illumina Genome Analyzer I system according to the manufacturer’s protocol. Raw sequencing reads, with length in 36-bp per read, were aligned to UCSC Human HG18 assembly and mapped on unique genomic locations. A computational program, bin-base enrichment thresholds (BELT) algorithm, was employed to identify genomic sites enriched with H3K27me3 (22). Briefly, BELT was used to determine enrichment values of top percentiles at all enriched regions and consequently to call peaks at each level of the top percentiles. False discovery rate (FDR<0.05) measuring the significance of H3K27me3 enrichment was estimated by a random permutation-based statistical method. Because of the linear distribution of data points in all samples, final normalization between AKT1 and vector samples was performed by subtracting the data intensity of control from that of AKT1 sample.
In silico expression analysis
The analysis was performed on published Affymetrix microarray data from 21 breast cancer cell lines and 4 normal breast epithelial cell samples (23). For each gene, t-test was performed to determine the significance of statistical difference between cancer cell lines and normal controls. The mean and standard deviation for cancer and normal samples, as well as fold changes and p values, were provided in Supplementary Table S7.
Methylated DNA immunoprecipitation (meDIP)- and ChIP-qPCR
MeDIP assay was conducted by following published protocol (24). Briefly, genomic DNA was sheared by sonication to a size range of 300 to 1000-bp. DNA fragments were denatured at 95°C for 10 min and then subjected to immunoprecipitation with a mouse monoclonal antibody against 5-methylcytosine (MAb-335MEC-500; Diagenode). ChIP assay for H3K27me3 was performed according to the previous description for ChIP-seq. Amounts of both input and pull-down DNA were measured by the NanoDrop 3300 Fluorospectrometer (Thermo Scientific; Waltham, MA). Multiple sets of PCR primers spanning CpG island regions of 40 loci were designed and tested in order to identify those primers (one pair per gene) with best amplification efficiency and specificity for each gene. Serial dilutions of input DNA were subjected to a SYBR-green real-time PCR assay in order to generate a standard curve for each primer pair. Equal amounts of input and pull-down from each sample were also subjected to PCR analysis. Relative quantification of DNA fragments for each locus was determined by plotting PCR Ct (cycle threshold) values on the standard curve. Fold-difference of pull-down over input DNA was calculated to indicate enrichment levels of a locus amplified by PCR. All assays were performed in two biological replicates.
AKT1 transfection and kinase activity assay
Either MyrAKT1 cDNA or pcDNA3 vehicle control were transfected to MCF10A cells as described previously (19). After drug selection, cells were pooled for further experiments. AKT kinase activities in 21 breast cancer cell lines and 8 normal mammary epithelial samples, as well as transfected MCF10A cells, were determined by the K-LISA kit (CBA019; Calbiochem) according to the manufacturer’s protocol.
MassARRAY analysis
MassARRAY (Seqenom, Inc.) assay was conducted following previous description (19). Briefly, bisulfite converted genomic DNA was subjected to PCR amplification and consequent amplicons were further analyzed by mass spectrometry for quantification of DNA methylation.
MBDCap-seq and identification of differentially methylated regions
Methylated DNA was eluted by the MethylMiner Methylated DNA Enrichment Kit (Invitrogen) according to the manufacturer’s instructions (25). MBDCap libraries for sequencing were prepared following standard protocols from Illumina (San Diego, CA). MBDCap-seq libraries were sequenced using the Illumina Genome Analyzer II (GA II) as per manufacturer's instructions. Sequencing was performed up to 36 cycles for mapping to the human genome reference sequence. Image analysis and base calling were performed with the standard Illumina pipeline. Differentially methylated regions were quantified for pairwise comparison by the difference of methylation values. The regions could be any length, but 4 kb was used in this study because the majority of CpG islands are within 2 kb windows of transcription start site (TSS).
Drug treatments and colony-forming assays
One µM 5-aza-2’-deoxycytidine (DAC; Catalog number 189825, EMD Chemicals Inc.), 0.2 µM trichostatin A (TSA; T8552, Sigma), and 5 µM LY294002 (Catalog number 440202, EMD Chemicals Inc.) were used to treat breast cancer cell lines following experimental conditions indicated in text. Dimethyl sulfoxide (DMSO) treatment served as control. Following treatment, cells were subjected to RNA extraction. RT-qPCR was conducted to detect the expression changes of 40 genes before and after these treatments. PCR primers are listed Supplementary Table S12.
The colony-forming assay was conducted by seeding ~50 cells of the T-47D breast cancer line per well of a 6-well culture plate. Cells were subsequently treated with drugs for four days and then kept three weeks in culture dishes without further treatment for colony formation. Cells were then fixed by 4% paraformaldehyde and stained by crystal violet for colony counting.
Xenograft experiment
Animal procedures were approved by the Institutional Animal Care and Use Committee (IACUC) at the Ohio State University. Female NOD SCID mice were obtained from Harlan Laboratories, Inc. (Indianapolis, IN) at 5–6 weeks of age. Each mouse was implanted with a pellet of 17beta-estradiol (0.72 mg, Innovative Research, FL). Five millions of T-47D cells in a total volume of 400µl, which includes 200µl cell suspension plus 200µl reduced growth factor Matrigel (Becton-Dickinson, Bedford, MA), were injected into flanks of experimental animals. Treatments were initiated until tumor size reached around 20 mm3. Drugs were loaded into PLGA particles (poly lactic-co-glycolic acid; Boehringer Ingelheim, Germany) (26). DAC (1mg/kg/week), LY294002 (5mg/kg/week), or same volume of PLGA vehicle were administered to experimental animals through intratumor injection. Tumors were monitored twice weekly for growth by measuring length (l) and width (w) with a digital caliper. Tumor size was calculated by the formula lwπ/4.
Ki-67 immunohistochemical study
Four-micrometer tissue section slides were deparaffinized and rehydrated, then were blocked for endogenous peroxidase in 3%H2O2 for 5 minutes. After antigen retrieval, the slides were incubated with a 1:150 dilution anti-Ki-67 monoclonal antibody (Clone MIB-1, Dako UK Ltd.) for 60 minutes at room temperature. After incubation with LSAB complex (Dako UK Ltd.) for 15 minutes, slides were stained and visualized by adding diaminobenzidine (DAB). Each stained section was evaluated by a minimum of 10 randomly selected X40 high-power fields. Ki-67 score was calculated as the percentage of positively stained cells to total cells.
Statistical analysis
The Student’s t-test was performed to analyze significance of data unless otherwise specified. A statistical significance was determined if p value is less than 0.05.
Results
Genome-wide alterations of H3K27me3 in AKT1-overexpressed breast epithelial cells
Non-cancerous MCF10A mammary epithelial cells were transfected with myrAKT1 — a constitutively active form of AKT1. The reason for choosing AKT1 is because it is a key effector of PI3K/AKT signaling pathway in breast cancer (27, 28). Elevated (3 to 5-fold) levels of AKT1 kinase were observed in MCF10A transfectants relative to vector control cells (Supplementary Fig. S1). ChIP-seq and expression microarray were then employed to determine altered profiles of H3K27me3 in AKT1 target genes in transfected versus control cells (Fig. 1A). A total of 67 million sequencing reads (total 8 lanes, 4 lanes per sample) were generated, with 15.6 and 11.8 million reads mapped to unique genomic locations in transfected and control samples, respectively (Supplementary Fig. S2 and Table S1). A ChIP-seq peak calling program, bin-base enrichment thresholds (BELT) algorithm (22), was used to identify H3K27me3-enriched targets in transfected MCF10A cells relative to control cells (Fig. 1B and Supplementary Tables S1 and S2). Consistent with a previously study (29), H3K27me3 was mostly enriched in gene desert (33%) and intragenic regions (30%) (Fig. 1C). While it is unclear how over-expressed AKT1 altered H3K27me3 profiles in these genomic regions, we observed enrichments in and around the 5′ transcription start sites of 1493 protein-coding genes in transfected MCF10A cells. Depletion of H3K27me3 was also seen in 1155 genes while the levels remained nearly the same for other 633 genes in both AKT1-transfected and control cells (data not shown). Microarray profiling further identified 1211 down-regulated and 940 up-regulated genes related to the AKT1 transfection. By integrating gene expression data with ChIP-seq results, we found that 488 down-regulated gene loci had higher enrichments of H3K27me3 in transfected MCF10A relative to control cells (Fig. 1D and E; Supplementary Table S3). Pathway analysis revealed that one third (n= 172) of these genes were associated with tumorigenic functions, while the other two sets exhibiting only H3K27me3 (n=1005) or AKT1-downregulation (n= 723) had significantly lower numbers of cancer-related genes (Fig. 1D and Supplementary Fig. S3 and Table S3, S4, and S5). In addition, 23% (n=113) of the 488 loci could be PRC targets in stem cells based on previous findings (Supplementary Table S3)(30, 31).
Figure 1.
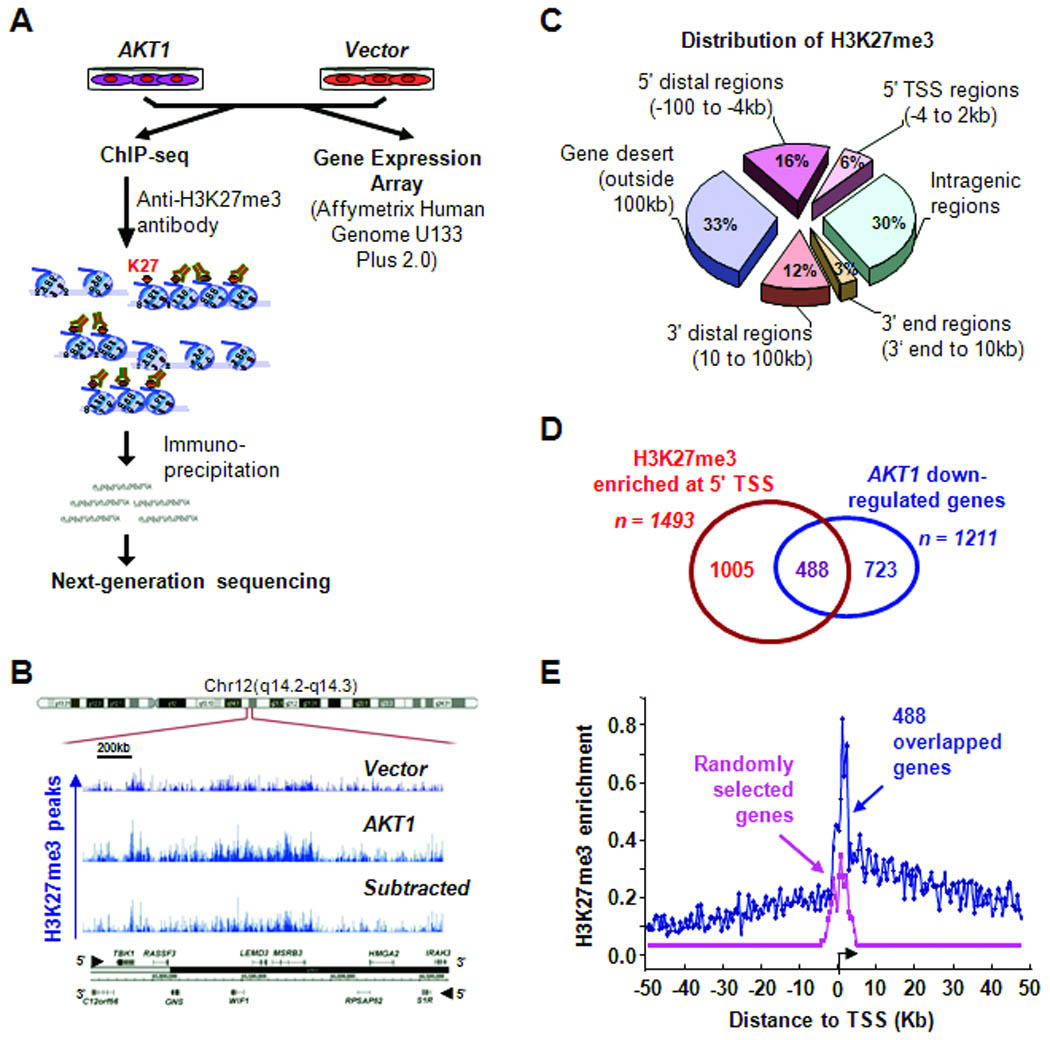
Genome-wide mapping of H3K27me3 in mammary epithelial cells. A, flow chart shows the experimental design. B, a screenshot represents H3K27me3 enrichment in a genomic region (2.5-Mb) on chromosome 12. C, pie chart demonstrates distribution of H3K27me3 enrichment across the mammary epithelial genome. D, Venn diagram illustrates that 488 loci were marked by H3K27me3 and downregulated by PI3K/AKT signaling. E, enriched peaks of H3K27me3 around 5′ TSS regions are significantly higher at 488 loci than those of randomly selected genes.
Because the silencing of these 488 loci was experimentally induced in AKT1-transfected breast epithelial cells, we determined whether this down-regulation could genuinely be observed in breast cancer cell lines. A step-wise approach was taken to narrow down a candidate list of epigenetically silenced loci (Fig. 2A). First, in silico analysis was conducted using a published microarray dataset of 21 breast cancer cell lines displaying higher kinase AKT1 activities (Fig. 2B and Supplementary Table S6) (23). From 325 available loci in this dataset, we performed t-test to determine the statistical significance of down-regulation in cancer cell lines relative to control cells. Although there were 145 loci not displaying consistent repression in these cancer cell lines, the remaining 180 loci showed significant reduction of expression across the majority of cancer lines (Fig. C and Supplementary Table S7).
Figure 2.
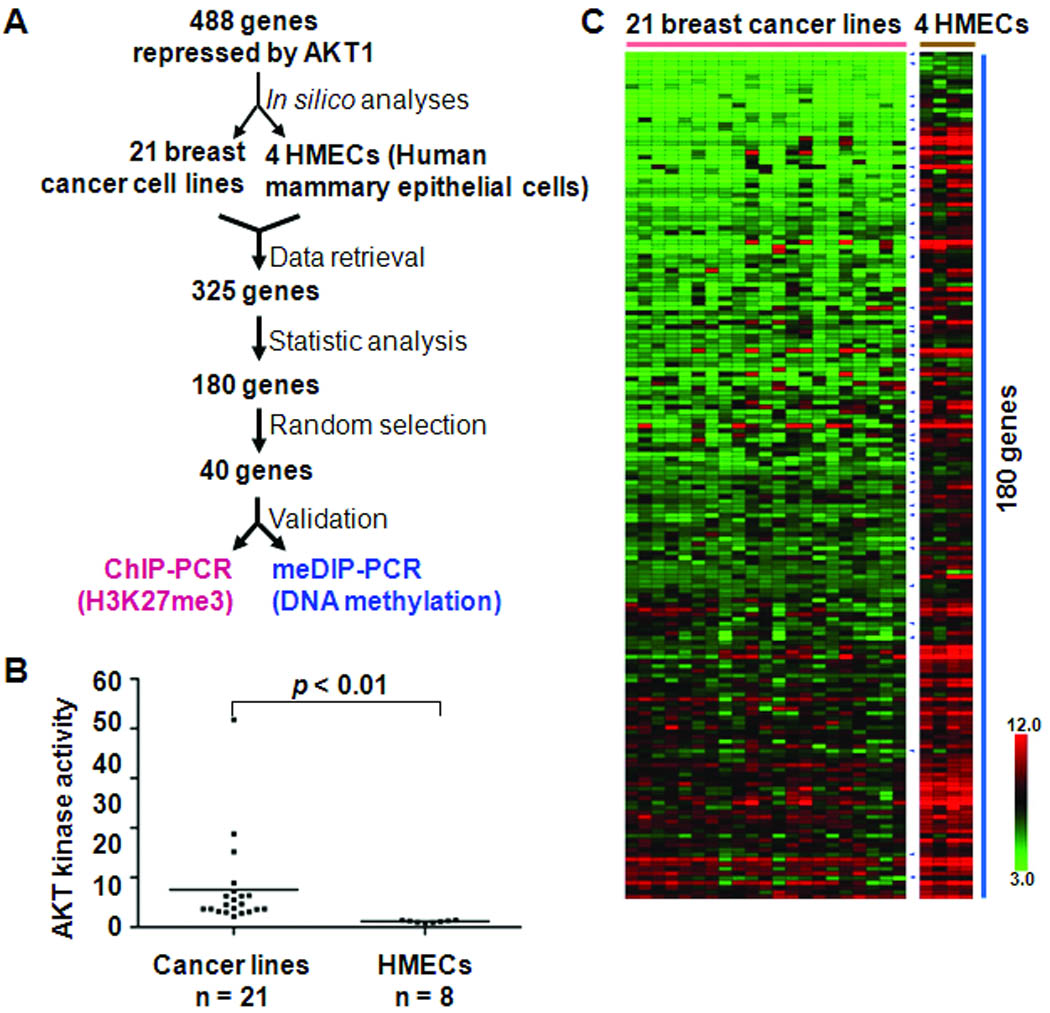
Identifying epigenetic silencing induced by PI3K/AKT signaling in breast cancer cells. A, step-wise flow chart shows the identification of genes suppressed by PI3K/AKT oncogenic signaling in breast cancer cells. B, AKT kinase activities were measured in 21 breast cancer cell lines and 8 normal breast epithelial cell samples. Normalized values were plotted in each category of figure. Non-parametric test was performed for statistical analysis. Representative data derived from two or three independent experiments are shown. C, heatmap shows decreased expression of 180 PI3K/AKT-repressed genes in 21 cancer lines, compared to four normal human mammary epithelial cells. Color bar indicates range of gene expression values in log2 scale. Small blue arrowheads point 40 genes randomly selected for validation experiments.
Epigenetic patterns of PI3K/AKT-repressed loci
To confirm whether these PI3K/AKT-regulated loci could be epigenetically silenced in breast cancer cells, we determined the status of H3K27me3 and DNA methylation in 40 randomly chosen loci by ChIP-qPCR and meDIP-qPCR, respectively. PCR primer pairs were designed for CpG island regions associated with these genes (Supplementary Fig. S4). Levels of H3K27me3 and DNA methylation are summarized in box plots for individual genes in 21 breast cancer cell lines examined (Fig. 3A). Complex distribution patterns of H3K27me3 and DNA methylation were found in these PI3K/AKT-repressed loci: 13 (group a) displayed both epigenetic marks, 6 (group b) predominantly for H3K27me3, and 7 (group c) for DNA methylation. However, fourteen (35%, group d) of these 40 loci had barely detectable epigenetic marks in these cancer cell lines. From this initial analysis, it is evident that differential patterns of epigenetic marks are present in subsets of these target genes in these cancer cell lines. We additionally examined distribution patterns of these two repressive marks in individual breast cancer cell lines. Levels of H3K27me3 and DNA methylation in 26 loci (groups a-c) that show detectable epigenetic marks are summarized in heatmaps (Fig. 3B). We found that these cell lines exhibited differential patterns of epigenetic silencing. For example, DNA methylation is the predominant mark in T-47D, BT-20, and MDA-MB-453 cell lines while H3K27me3 is the major mark for HCC70, ZR-75-1, and BT-474 cell lines. Both marks appeared deficient in SUM149PT cells. We next determined whether these differential epigenetic patterns are correlated with specific pathological and genetic types of the 21 breast cancer cell lines. No statistical association was observed between epigenetic patterns and cell types (i.e., luminal or basal), pathology, or hormone receptors.
Figure 3.

Differential levels of H3K27me3 and DNA methylation in PI3K/AKT-repressed loci. A, as shown in Fig. 2C, 40 genes were randomly selected from PI3K/AKT-suppressed loci and subjected to ChIP- and meDIP-qPCR in 21 cancer lines. Enrichment values of epigenetic marks were transformed by taking the square root and plotted in figures. Box-plot shows distribution of levels for H3K27me3 (upper) and DNA methylation (lower) across all samples. The bottom and top of the box, as well as the line in between, indicate the lower, upper and median quartiles of data, respectively. Representative data were derived from at least two independent experiments. B, heatmaps show H3K27me3 (pink) and DNA methylation (blue) of 26 genes in panel A.
To validate DNA methylation measured by meDIP-qPCR, we additionally conducted MassARRAY analysis on four genes (SFRP1, HOXA5, HOXA9, and SYNE2) in the same samples used in Fig. 3. Both quantitative methods were comparable for differentiating DNA methylation levels among multiple samples (Fig. 4 and Supplementary Fig. S5). The strongest correlation was found in SYNE2 where the same CpG island region was assayed by both meDIP-qPCR and MassARRAY (Supplementary Fig. S5).
Figure 4.

Validation of DNA methylation by MassARRAY. Methylation profiles of 4 genes, i.e., SFRP1, HOXA5, HOXA9, and SYNE2, were carefully measured in 20 breast cancer cell lines and 8 normal breast epithelial cell samples by MassARRAY analysis. For each gene, upper panel shows a genome map with locations of CpG sites (vertical bars), and lower panel illustrates DNA methylation at each CpG unit (circle) of different samples, with intensity of blue color indicating methylation level. N/A, not analyzable
Combined epigenetic and PI3K/AKT-targeted therapies relieve gene silencing and suppress tumor growth
As both PI3K/AKT signaling and epigenetic silencing represent important aspects of cancer development, therapies targeted on these components were previously investigated (32, 33). Because our data showed a link between activated PI3K/AKT signaling and epigenetic silencing, we treated breast cancer cell lines (n=10) individually with different combinations of 5-aza-2′-deoxycytidine (DAC, 1 µM, DNA demethylating agent), trichostatin A (TSA, 0.2 µM, histone deacetylase inhibitor), and/or LY294002 (5 µM, PI3K/AKT inhibitor) based on previously reported doses (Fig. 5A) (16, 34). Gene expressions assessed by quantitative reverse transcription (RT)-qPCR, are summarized in box plots (Fig. 5B). Increased levels of gene expression were consistently found in all treatment groups relative to control (DMSO) groups. Among these, the triple treatment combining both epigenetic drugs (DAC and TSA) and LY294002 dramatically relieved the silencing of these loci in almost all cancer cell lines examined (Fig. 5C).
Figure 5.
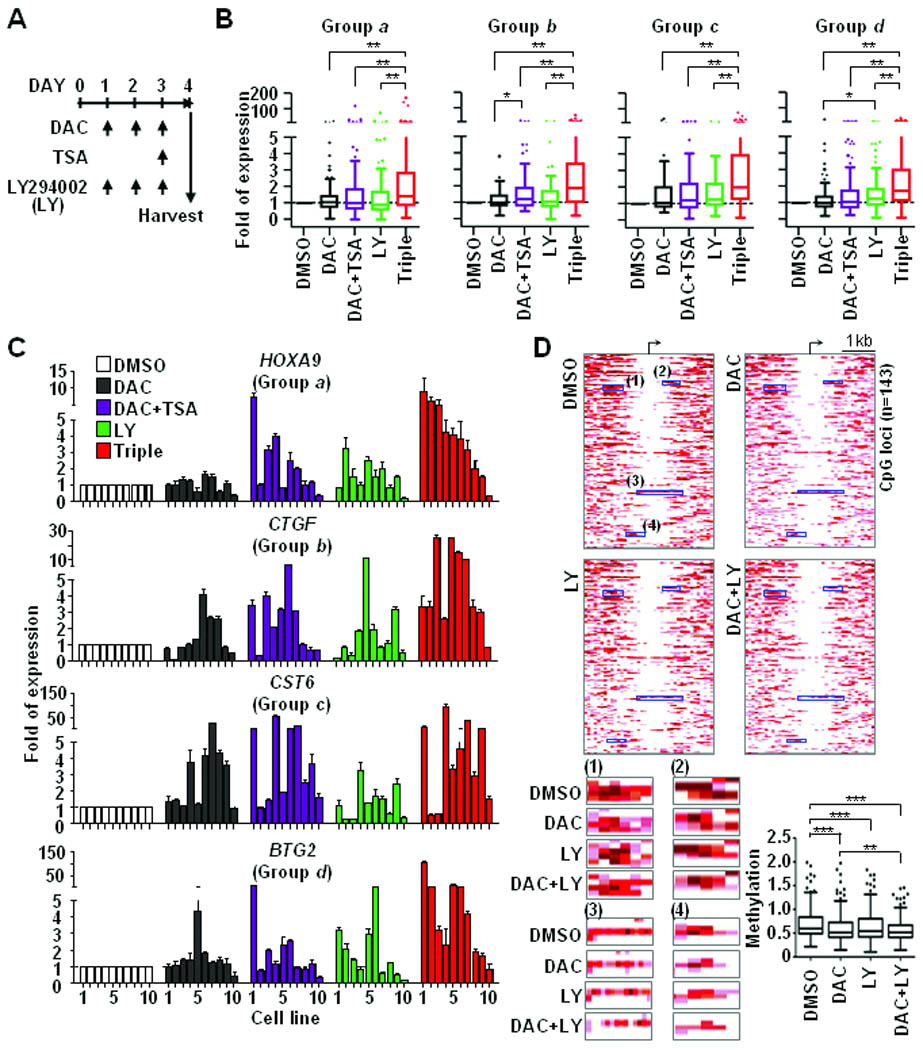
Combined PI3K/AKT-targeted epigenetic therapies synergistically relieve epigenetic repression. A, scheme chart illustrates drug treatment plan. A DNA demethylation reagent (DAC, 1 µM), an inhibitor of histone deacetylases (TSA, 0.2 µM) and a non-specific PI3K inhibitor (LY294002, 5 µM) were used to treat 10 breast cancer cell lines as indicated. B, RT-qPCR was conducted to measure expressions of 40 genes after drug treatments. Values of gene expression in each treatment were normalized by comparing those of DMSO control. Following categorization showed in Fig. 3, genes from groups a, b, c and d were summarized in four box-plots separately. Three independent experiments were conducted and representative data was shown in figures. C, expression changes of representative genes, i.e. HOXA9, CTGF, CST6, and BTG2, are shown. The order of cell lines: 1 MDA-MB-453; 2 MCF7; 3 ZR-75-1; 4 BT-549; 5 MDA-MB-468; 6 BT-474; 7 T-47D; 8 HCC1954; 9 Hs578T; 10 MDA-MB-231. D, global MBDCap-seq was conducted to analyze DNA methylation changes in drug-treated T-47D cancer cells. Enrichment levels of DNA methylation in promoter CpG islands were statistically normalized. Heatmaps, upper panel, show differential methylation patterns of 143 loci that were plotted in a 4-kb window (2-kb up- and down-stream from the transcription start site). The detail methylation changes in four representative regions in heatmaps are illustrated at lower panel (left), while box plots (right) summarize the overall methylation levels of 143 loci in four different treatment groups. Significance of differences among drug treatments was determined by Student’s t-test and One-way ANOVA test. *P<0.05, **P<0.01, and ***P<0.001.
The epigenomic changes in T-47D cancer cell line after drug treatments were further investigated through methyl-CpG binding domain-based capture coupled with massively parallel sequencing (MBDCap-seq). The reason for choosing MBDCap-seq is because this method was shown to be more sensitive to enrich CG-rich regions than the meDIP assay in genome-wide studies (25). As shown in Fig. 5D, significant decreases in DNA methylation were found in 143 promoter CpG islands in cancer cells after drug treatments, especially those treated with both DAC and LY294002. Further pathway analysis showed that many of these 143 genes, such as TSC1, TP53BP1, and HIF1A, were strongly associated with tumorigenic functions (Supplementary Table S15). Although only one (i.e., ARAP2) of these genes was found in the early list of 180 genes shown in Fig. 2., a moderate loss of DNA methylation at those original loci was also found following the treatment of DAC and LY294002 (Supplementary Fig. S6).
To determine treatment effects on growth suppression, T-47D cells were treated with DAC and/or LY294002 for a colony-forming assay (Fig. 6A). To further confirm anti-tumor effect in vivo, T-47D cells were inoculated into NOD SCID mice and followed by drug treatments (Fig. 6B and C). Both in vitro and in vivo experiments demonstrated that the combined treatment synergistically reduced the growth and survival of cancer cells while single treatments were less effective on this suppression. Taken together, these studies promisingly demonstrate the feasibility of combining both PI3K/AKT-targeted and epigenetic drugs for future cancer treatments.
Figure 6.
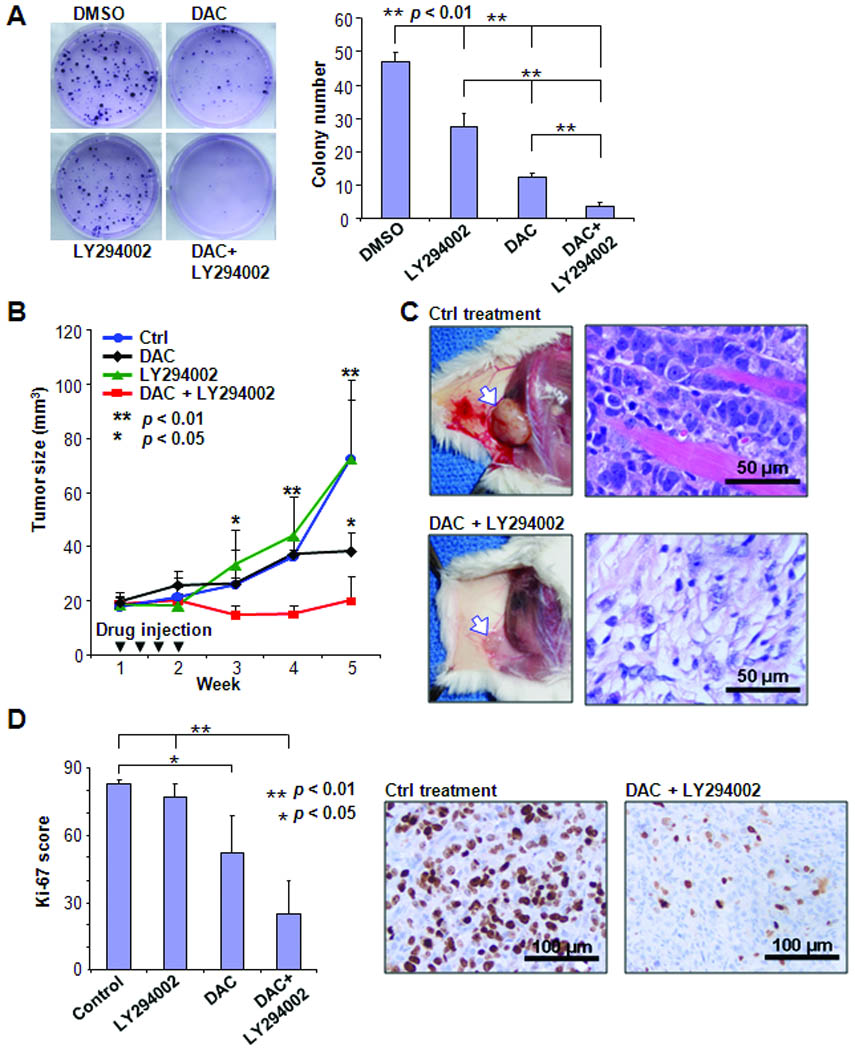
Combinatorial treatment suppresses tumor growth. A, T-47D cancer cells were treated with DAC or/and LY294002 and subjected to colony counting. Left, photos show representative from each treatment. Right, results were derived from three independent experiments. B, five million T-47D cancer cells were inoculated on flank of each female NOD SCID mouse. Each treatment was conducted on 5 experimental animals by intratumor injections of either drugs or vehicle control for totally four times during first two weeks of treatment. Tumor growth was carefully followed until 5 weeks after beginning of treatment. C, photos illustrate representative xengraft tumors in control (upper panel) and drug treated (lower panel) mice. Arrow indicates inoculated tumors. H&E stain shows that cancer cells invaded pink muscle-fibers in control xenograft tumor, while morphology of tumor cells was dramatically changed after drug treatment. D, Immunohistochemical analysis of Ki-67 was performed in xenograft tumor tissues. Left, Ki-67 scores measured from three tumors in each group were summarized in column figure. Right, representative Ki-67 immunohistochemical sections from tumor tissues treated with either vehicle control or drugs.
Discussion
Recent efforts have been undertaken to identify trans-regulatory factors that trigger epigenetic silencing in cancer cells. Deregulated signaling related to TGF-β and estrogen has been implicated in this initiation process during the differentiation of breast progenitor cells (35–39). In this study, we suggest that activated PI3K/AKT signaling is also a trigger of epigenetic silencing. This oncogenic signaling was previously found to be activated in mammary epithelial cells chronically exposed to inflammatory microenvironments and could induce epigenetic silencing of a tumor suppressor gene, CST6, in vitro (19). We further demonstrate that activation of this oncogenic signaling pathway causes global alterations of H3K27me3, thereby leading to epigenetic silencing of multiple loci. This new line of evidence reveals an interesting mechanism that oncogenic signaling can aberrantly transform differentiated epithelial cells through its epigenetic influence in the human breast.
In analogous to embryonic stem cells, differentiation-control genes in breast progenitor cells also possess a “bivalent” feature, consisting of an active mark, H3K4me2, and a repressive mark, H3K27me3 (5). Co-existence of these histone marks is to maintain progenitor cells in a “ready state” for lineage-specific development (12). In terminally differentiated cells, the bivalent loci retain either activating or repressive marks that are essential to specify specific lineage functions. This epigenetic programming, however, can be redirected by oncogenic signaling (38, 39). Interestingly, as demonstrated in this study, we uncovered that activated PI3K/AKT signaling can drive a subset of downstream loci to undergo epigenetic silencing in breast epithelial cells. Indeed, 28% (n=138) of the 488 genes identified through the integrative screening of ChIP-seq and expression microarray data encode putative cellular functions required for normal differentiation (Supplementary Fig S3 and Table S3). In our experimental model, these genes become transcriptionally silenced and display the repressive H3K27me3 mark in breast epithelial cells.
One of interesting findings in our study is that many of loci loss H3K27me3 but gain DNA methylation in cancer cells. These data seem to support the occurrence of an epigenetic switch between H3K27me3 mark and DNA methylation during tumor progression (15,16). This mutually exclusive silencing pattern also indicates that both repressive marks actually have an independent role in the maintenance of gene silencing in breast cancer cells. In this regard, Cha et al. (40) reported that AKT kinases can phosphorylate EZH2 and impair its trimethylation activity, resulting in a depletion of H3K27me3 in some cancer cell lines, such as MDA-MB-453 and T-47D. Interestingly, this finding is consistent with our present results that show loss of H3K27me3 and compensatory gain of DNA hypermethylation at same loci in those two cancer cell lines. Meanwhile, our preliminary data indicate that PI3K inhibitor LY294002 can dramatically decrease levels of DNA methyltransferase 3 in multiple breast cancer lines (data not shown). Another study has also suggested that activated PI3K/AKT signaling greatly stabilizes DNA methyltransferase 1 (DNMT1) by attenuating the ubiquitin-proteosome reaction in cancer cells (41). It is also worthy of note that one recent study demonstrated that estrogen receptor signaling can regulate methylation of H3K27 through the PI3K/AKT pathway (42).
While more than 20 PI3K-targeted inhibitors have recently been introduced in clinical trials, more work still needs to be done to improve treatment effectiveness in patients (32, 43, 44). One new strategy is to combine these inhibitors with epigenetic drugs, which have also been used as single agents for myelodysplastic syndrome and other malignancies (45, 46). As we demonstrated in this study, these combined approaches show promising results in breast cancer treatment. Furthermore, these combined agents can be administered in low-dose ranges (i.e., nanomolar concentrations), which are capable of evoking long-term reactivation of tumor suppressor genes and promote cellular reprogramming. Emerging evidence has shown that this low-dose treatment strategy is sufficient to suppress hematopoietic malignancies and at the same time avoids cytotoxicity (47, 48). Although this low-dose treatment was not used in this study, our future work will focus on identifying optimal doses in nanomolar concentrations that will not result in acute cytotoxic effects but rather induce sustained anti-tumor responses in vitro and in xenograft models.
Whereas PI3K/AKT signaling is well known to contribute multi-oncogenic functions, our present study has uncovered its unique role in epigenetic silencing. These data also support the notion that polycomb- and DNA hypermethylation-based mechanisms can compensate each other for the maintenance of gene silencing under different genetic backgrounds. As oncogenic signaling cascades can perturb epigenetic balance in cancer genomes, our experimental evidence therefore provides support for combinatorial PI3K/AKT-targeted and epigenetic therapies in future cancer treatment.
Supplementary Material
Acknowledgments
We thank Drs. Shuying Sun, Benjamin Rodriguez, Shili Lin, Kun Huang, Brian Kennedy, Joseph C. Liu and Lisa Asamoto for helpful discussions and technical assistance.
Grant Support
This work was supported by the Integrative Cancer Biology Program (U54 CA113001), the Gene and Environment Initiative (U01 ES015986), and R01CA069065 at the U.S. National Institutes of Health, the Department of Defense grant BC073892, the Susan G. Komen Breast Cancer Foundation grant KG081123, and by the Ohio State University Comprehensive Cancer Center.
Footnotes
Disclosure of Potential Conflicts of Interest
No potential conflicts of interest were disclosed.
References
- 1.Esteller M. Epigenetics in cancer. N Engl J Med. 2008;358:1148–1159. doi: 10.1056/NEJMra072067. [DOI] [PubMed] [Google Scholar]
- 2.Jones PA, Baylin SB. The epigenomics of cancer. Cell. 2007;128:683–692. doi: 10.1016/j.cell.2007.01.029. [DOI] [PMC free article] [PubMed] [Google Scholar]
- 3.Bracken AP, Helin K. Polycomb group proteins: navigators of lineage pathways led astray in cancer. Nat Rev Cancer. 2009;9:773–784. doi: 10.1038/nrc2736. [DOI] [PubMed] [Google Scholar]
- 4.Cedar H, Bergman Y. Linking DNA methylation and histone modification: patterns and paradigms. Nat Rev Genet. 2009;10:295–304. doi: 10.1038/nrg2540. [DOI] [PubMed] [Google Scholar]
- 5.Lo PK, Sukumar S. Epigenomics and breast cancer. Pharmacogenomics. 2008;9:1879–1902. doi: 10.2217/14622416.9.12.1879. [DOI] [PMC free article] [PubMed] [Google Scholar]
- 6.Simon JA, Kingston RE. Mechanisms of polycomb gene silencing: knowns and unknowns. Nat Rev Mol Cell Biol. 2009;10:697–708. doi: 10.1038/nrm2763. [DOI] [PubMed] [Google Scholar]
- 7.Sparmann A, van Lohuizen M. Polycomb silencers control cell fate, development and cancer. Nat Rev Cancer. 2006;6:846–856. doi: 10.1038/nrc1991. [DOI] [PubMed] [Google Scholar]
- 8.Cao R, Zhang Y. The functions of E(Z)/EZH2-mediated methylation of lysine 27 in histone H3. Curr Opin Genet Dev. 2004;14:155–164. doi: 10.1016/j.gde.2004.02.001. [DOI] [PubMed] [Google Scholar]
- 9.Ohm JE, McGarvey KM, Yu X, et al. A stem cell-like chromatin pattern may predispose tumor suppressor genes to DNA hypermethylation and heritable silencing. Nat Genet. 2007;39:237–242. doi: 10.1038/ng1972. [DOI] [PMC free article] [PubMed] [Google Scholar]
- 10.Schlesinger Y, Straussman R, Keshet I, et al. Polycomb-mediated methylation on Lys27 of histone H3 pre-marks genes for de novo methylation in cancer. Nat Genet. 2007;39:232–236. doi: 10.1038/ng1950. [DOI] [PubMed] [Google Scholar]
- 11.Widschwendter M, Fiegl H, Egle D, et al. Epigenetic stem cell signature in cancer. Nat Genet. 2007;39:157–158. doi: 10.1038/ng1941. [DOI] [PubMed] [Google Scholar]
- 12.Bloushtain-Qimron N, Yao J, Shipitsin M, Maruyama R, Polyak K. Epigenetic patterns of embryonic and adult stem cells. Cell Cycle. 2009;8:809–817. doi: 10.4161/cc.8.6.7938. [DOI] [PubMed] [Google Scholar]
- 13.McCabe MT, Lee EK, Vertino PM. A multifactorial signature of DNA sequence and polycomb binding predicts aberrant CpG island methylation. Cancer Res. 2009;69:282–291. doi: 10.1158/0008-5472.CAN-08-3274. [DOI] [PMC free article] [PubMed] [Google Scholar]
- 14.Vire E, Brenner C, Deplus R, et al. The Polycomb group protein EZH2 directly controls DNA methylation. Nature. 2006;439:871–874. doi: 10.1038/nature04431. [DOI] [PubMed] [Google Scholar]
- 15.Gal-Yam EN, Egger G, Iniguez L, et al. Frequent switching of Polycomb repressive marks and DNA hypermethylation in the PC3 prostate cancer cell line. Proc Natl Acad Sci U S A. 2008;105:12979–12984. doi: 10.1073/pnas.0806437105. [DOI] [PMC free article] [PubMed] [Google Scholar]
- 16.Kondo Y, Shen L, Cheng AS, et al. Gene silencing in cancer by histone H3 lysine 27 trimethylation independent of promoter DNA methylation. Nat Genet. 2008;40:741–750. doi: 10.1038/ng.159. [DOI] [PubMed] [Google Scholar]
- 17.McGarvey KM, Greene E, Fahrner JA, Jenuwein T, Baylin SB. DNA methylation and complete transcriptional silencing of cancer genes persist after depletion of EZH2. Cancer Res. 2007;67:5097–5102. doi: 10.1158/0008-5472.CAN-06-2029. [DOI] [PubMed] [Google Scholar]
- 18.Jones PA, Liang G. Rethinking how DNA methylation patterns are maintained. Nat Rev Genet. 2009;10:805–811. doi: 10.1038/nrg2651. [DOI] [PMC free article] [PubMed] [Google Scholar]
- 19.Lin HJ, Zuo T, Lin CH, et al. Breast cancer-associated fibroblasts confer AKT1-mediated epigenetic silencing of Cystatin M in epithelial cells. Cancer Res. 2008;68:10257–10266. doi: 10.1158/0008-5472.CAN-08-0288. [DOI] [PMC free article] [PubMed] [Google Scholar]
- 20.Manning BD, Cantley LC. AKT/PKB signaling: navigating downstream. Cell. 2007;129:1261–1274. doi: 10.1016/j.cell.2007.06.009. [DOI] [PMC free article] [PubMed] [Google Scholar]
- 21.Vivanco I, Sawyers CL. The phosphatidylinositol 3-Kinase AKT pathway in human cancer. Nat Rev Cancer. 2002;2:489–501. doi: 10.1038/nrc839. [DOI] [PubMed] [Google Scholar]
- 22.Frietze S, Lan X, Jin VX, Farnham PJ. Genomic targets of the KRAB and SCAN domain-containing zinc finger protein 263. J Biol Chem. 2010;285:1393–1403. doi: 10.1074/jbc.M109.063032. [DOI] [PMC free article] [PubMed] [Google Scholar]
- 23.Neve RM, Chin K, Fridlyand J, et al. A collection of breast cancer cell lines for the study of functionally distinct cancer subtypes. Cancer Cell. 2006;10:515–527. doi: 10.1016/j.ccr.2006.10.008. [DOI] [PMC free article] [PubMed] [Google Scholar]
- 24.Mohn F, Weber M, Schubeler D, Roloff TC. Methylated DNA immunoprecipitation (MeDIP) Methods Mol Biol. 2009;507:55–64. doi: 10.1007/978-1-59745-522-0_5. [DOI] [PubMed] [Google Scholar]
- 25.Robinson MD, Stirzaker C, Statham AL, et al. Evaluation of affinity-based genome-wide DNA methylation data: Effects of CpG density, amplification bias, and copy number variation. Genome Res. 2010;20:1719–1729. doi: 10.1101/gr.110601.110. [DOI] [PMC free article] [PubMed] [Google Scholar]
- 26.Xu JS, Huang J, Qin R, et al. Synthesizing and binding dual-mode poly (lactic-co-glycolic acid) (PLGA) nanobubbles for cancer targeting and imaging. Biomaterials. 2009;31:1716–1722. doi: 10.1016/j.biomaterials.2009.11.052. [DOI] [PubMed] [Google Scholar]
- 27.Brugge J, Hung MC, Mills GB. A new mutational AKTivation in the PI3K pathway. Cancer Cell. 2007;12:104–107. doi: 10.1016/j.ccr.2007.07.014. [DOI] [PubMed] [Google Scholar]
- 28.Maroulakou IG, Oemler W, Naber SP, Tsichlis PN. Akt1 ablation inhibits, whereas Akt2 ablation accelerates, the development of mammary adenocarcinomas in mouse mammary tumor virus (MMTV)-ErbB2/neu and MMTV-polyoma middle T transgenic mice. Cancer Res. 2007;67:167–177. doi: 10.1158/0008-5472.CAN-06-3782. [DOI] [PubMed] [Google Scholar]
- 29.Pauler FM, Sloane MA, Huang R, et al. H3K27me3 forms BLOCs over silent genes and intergenic regions and specifies a histone banding pattern on a mouse autosomal chromosome. Genome Res. 2009;19:221–233. doi: 10.1101/gr.080861.108. [DOI] [PMC free article] [PubMed] [Google Scholar]
- 30.Boyer LA, Plath K, Zeitlinger J, et al. Polycomb complexes repress developmental regulators in murine embryonic stem cells. Nature. 2006;441:349–353. doi: 10.1038/nature04733. [DOI] [PubMed] [Google Scholar]
- 31.Lee TI, Jenner RG, Boyer LA, et al. Control of developmental regulators by Polycomb in human embryonic stem cells. Cell. 2006;125:301–313. doi: 10.1016/j.cell.2006.02.043. [DOI] [PMC free article] [PubMed] [Google Scholar]
- 32.Engelman JA. Targeting PI3K signalling in cancer: opportunities, challenges and limitations. Nat Rev Cancer. 2009;9:550–562. doi: 10.1038/nrc2664. [DOI] [PubMed] [Google Scholar]
- 33.Oki Y, Issa JP. Review: recent clinical trials in epigenetic therapy. Rev Recent Clin Trials. 2006;1:169–182. doi: 10.2174/157488706776876490. [DOI] [PubMed] [Google Scholar]
- 34.Vlahos CJ, Matter WF, Hui KY, Brown RF. A specific inhibitor of phosphatidylinositol 3-kinase, 2-(4-morpholinyl)-8-phenyl-4H-1-benzopyran-4-one (LY294002) J Biol Chem. 1994;269:5241–5248. [PubMed] [Google Scholar]
- 35.Chan MW, Huang YW, Hartman-Frey C, et al. Aberrant transforming growth factor beta1 signaling and SMAD4 nuclear translocation confer epigenetic repression of ADAM19 in ovarian cancer. Neoplasia. 2008;10:908–919. doi: 10.1593/neo.08540. [DOI] [PMC free article] [PubMed] [Google Scholar]
- 36.Hinshelwood RA, Huschtscha LI, Melki J, et al. Concordant epigenetic silencing of transforming growth factor-beta signaling pathway genes occurs early in breast carcinogenesis. Cancer Res. 2007;67:11517–11527. doi: 10.1158/0008-5472.CAN-07-1284. [DOI] [PubMed] [Google Scholar]
- 37.Leu YW, Yan PS, Fan M, et al. Loss of estrogen receptor signaling triggers epigenetic silencing of downstream targets in breast cancer. Cancer Res. 2004;64:8184–8192. doi: 10.1158/0008-5472.CAN-04-2045. [DOI] [PubMed] [Google Scholar]
- 38.Cheng AS, Culhane AC, Chan MW, et al. Epithelial progeny of estrogen-exposed breast progenitor cells display a cancer-like methylome. Cancer Res. 2008;68:1786–1796. doi: 10.1158/0008-5472.CAN-07-5547. [DOI] [PMC free article] [PubMed] [Google Scholar]
- 39.Hsu PY, Deatherage DE, Rodriguez BA, et al. Xenoestrogen-induced epigenetic repression of microRNA-9-3 in breast epithelial cells. Cancer Res. 2009;69:5936–5945. doi: 10.1158/0008-5472.CAN-08-4914. [DOI] [PMC free article] [PubMed] [Google Scholar]
- 40.Cha TL, Zhou BP, Xia W, et al. Akt-mediated phosphorylation of EZH2 suppresses methylation of lysine 27 in histone H3. Science. 2005;310:306–310. doi: 10.1126/science.1118947. [DOI] [PubMed] [Google Scholar]
- 41.Sun L, Zhao H, Xu Z, et al. Phosphatidylinositol 3-kinase/protein kinase B pathway stabilizes DNA methyltransferase I protein and maintains DNA methylation. Cell Signal. 2007;19:2255–2263. doi: 10.1016/j.cellsig.2007.06.014. [DOI] [PubMed] [Google Scholar]
- 42.Bredfeldt TG, Greathouse KL, Safe SH, Hung M-C, Bedford MT, Walker CL. Xenoestrogen-induced regulation of EZH2 and histone methylation via estrogen receptor signaling to PI3K/AKT. Mol Endocrinol. 2010;24:993–1006. doi: 10.1210/me.2009-0438. [DOI] [PMC free article] [PubMed] [Google Scholar]
- 43.Hennessy BT, Smith DL, Ram PT, Lu Y, Mills GB. Exploiting the PI3K/AKT pathway for cancer drug discovery. Nat Rev Drug Discov. 2005;4:988–1004. doi: 10.1038/nrd1902. [DOI] [PubMed] [Google Scholar]
- 44.Liu P, Cheng H, Roberts TM, Zhao JJ. Targeting the phosphoinositide 3-kinase pathway in cancer. Nat Rev Drug Discov. 2009;8:627–644. doi: 10.1038/nrd2926. [DOI] [PMC free article] [PubMed] [Google Scholar]
- 45.Issa JP, Kantarjian HM. Targeting DNA methylation. Clin Cancer Res. 2009;15:3938–3946. doi: 10.1158/1078-0432.CCR-08-2783. [DOI] [PMC free article] [PubMed] [Google Scholar]
- 46.Silverman LR, Demakos EP, Peterson BL, et al. Randomized controlled trial of azacitidine in patients with the myelodysplastic syndrome: a study of the cancer and leukemia group B. J Clin Oncol. 2002;20:2429–2440. doi: 10.1200/JCO.2002.04.117. [DOI] [PubMed] [Google Scholar]
- 47.Kagey JD, Kapoor-Vazirani P, McCabe MT, Powell DR, Vertino PM. Long-term stability of demethylation after transient exposure to 5-aza-2'-deoxycytidine correlates with sustained RNA polymerase II occupancy. Mol Cancer Res. 2010;8:1048–1059. doi: 10.1158/1541-7786.MCR-10-0189. [DOI] [PMC free article] [PubMed] [Google Scholar]
- 48.Oki Y, Jelinek J, Shen L, Kantarjian HM, Issa JP. Induction of hypomethylation and molecular response after decitabine therapy in patients with chronic myelomonocytic leukemia. Blood. 2008;111:2382–2384. doi: 10.1182/blood-2007-07-103960. [DOI] [PMC free article] [PubMed] [Google Scholar]
Associated Data
This section collects any data citations, data availability statements, or supplementary materials included in this article.