Abstract
There are discrepancy between MR findings and clinical presentations. The compressed cervical cord in patients of the spondylotic myelopathy may be normal on conventional MRI when it is at the earlier stage or even if patients had severe symptoms. Therefore, it is necessary to take a developed MR technique—diffusion tensor imaging (DTI)—to detect the intramedullary lesions. Prospective MR and DTI were performed in 53 patients with cervical compressive myelopathy and twenty healthy volunteers. DTI was performed along six non-collinear directions with single-shot spin echo echo-planar imaging (EPI) sequence. Intramedullary apparent diffusion coefficient (ADC) and fractional anisotropy (FA) values were measured in four segments (C2/3, C3/4, C4/5, C5/6) for volunteers, in lesions (or the compressed cord) and normal cord for patients. DTI original images were processed to produce color DTI maps. In the volunteers’ group, cervical cord exhibited blue on the color DTI map. FA values between four segments had a significant difference (P < 0.01), with the highest FA value (0.85 ± 0.03) at C2/3 level. However, ADC value between them had no significant difference (P > 0.05). For patients, only 24 cases showed hyperintense on T2-weighted image, while 39 cases shown patchy green signal on color DTI maps. ADC and FA values between lesions or the compressed cord and normal spinal cord of patients had a significant difference (both P < 0.01). FA value at C2/3 cord is the highest of other segments and it gradually decreases towards the caudal direction. Using single-shot spin echo EPI sequence and six non-collinear diffusion directions with b value of 400 s mm−2, DTI can clearly show the intramedullary microstructure and more lesions than conventional MRI.
Keywords: MR, Diffusion tensor imaging (DTI), Cervical myelopathy, Apparent diffusion coefficient (ADC), Fractional anisotropy (FA)
Introduction
Cervical spondylosis is a very common degenerative disease of the spine in the elderly [2, 9]. Conventional MR examination has played an important role in the diagnosis of cervical spondylosis, appearing intervertebral disk hernia, osteophytosis, and cervical canal stenosis, etc. [12]. All these conditions could result in cervical compressive myelopathy [3, 13, 17, 21]. Spondylotic compressive myelopathy developed progressively for years because of long-standing segmental compression of the spinal cord [8]. Moreover,in some severe cases with obvious clinical symptoms such as extremity numbness and motion dysfunction, there were no abnormal signal intensity on conventional MR imaging. How to explain the difference between the clinical manifestations and the MR findings became very difficult for radiologists and orthopedists due to the primary disadvantage of routine MR imaging is unable to display the microstructures of the lesion at the early stage. The earlier treatment yields to better effectiveness. Therefore, it is very important to diagnose the lesion at the earlier stage.
Diffusion tensor imaging (DTI), a magnetic resonance technique that is sensitive to the diffusion of water molecules, can diagnose the acute cerebral stroke which can not be demonstrated on conventional MR examinations [20]. Although DTI has been used widely in the brain [15, 18], it was seldom used in the spinal cord because the quality of the images was degraded by artifacts of susceptibility, pulsation of cerebrospinal fluid (CSF), and heart motion or respiration motion [4, 6]. Additionally, the signal–noise ratio and resolution of images of DTI in human spinal cord was inferior to that of the brain because of the small size of the spinal cord. The purpose of this study was to elucidate the usage of DTI in analyzing the early findings of the compressive cervical spinal cord and in depicting the diffusion characteristics of cervical cord in healthy volunteers of Chinese. We optimized the scanning parameters and sequences to study the clinical application value of DTI in the human cervical spinal cord by selecting the patients with spondylotic compressive myelopathy and healthy volunteers.
Materials and methods
Study subjects
Fifty-three consecutive patients with cervical compressive myelopathy were prospectively studied from May 2006 to June 2008. There were 28 males, 25 females, and the mean age 56 years (range 47–71 years). All patients were diagnosed to be the cervical compressive myelopathy based on the clinical manifestations(neck pain, extremity numbness, walking difficulty, etc.) and imaging modalities findings. All patients had the cervical spondylotic myelopathy, with calcification or thickening of the ligamentum flavum in 30 patients, ossification or thickening of the posterior longitudinal ligament in 16 patients, cervical disc herniation in 50 patients, and cervical canal stenosis in 42 patients. The evaluation of myelopathy was performed according to the Japanese Orthopedic Association (JOA) score for cervical myelopathy [21]. Patients with cerebral palsy, rheumatoid arthritis, or other spinal diseases, and those who needed spinal surgery due to kyphotic deformity or severity instability were excluded from this study.
Twenty healthy volunteers (11 males and 9 females, mean age 55 years, age range 46–67 years) without neurological deficits and any clinical symptoms were selected to be control group. The protocol followed ethical rules and was approved by our institutional review board, and all patients were informed and gave their consent before study initiation. Both patients and volunteers in control group were followed up for 6 months.
MR protocol
All imaging was performed using a 1.5 T scanner (Gyroscan NT Intera, Philips Medical Systems, the Netherlands) equipped with actively shielded magnetic field gradients of up to 23mT/m, a slew rate of 150 mT/m/ms, and a multi-channel all-spine coil. For conventional sequences, scanning orientations were sagittal T1-weighted image, sagittal T2-weighted image and transverse T2-weighted image. The images were obtained with a field of view (FOV) of 250 mm for sagittal scanning and 230 mm for transverse scanning, and an image matrix 256 × 256. The conventional MRI sequences were spin-echo T1-weighted image (TR/TE = 500 ms/15 ms) and fast spin-echo T2-weighted image (TR/TE = 4,800 ms/120 ms). Slice thickness was 3 mm, and slice gap 0.3 mm and numbers of acquisition 3.
Single-shot fast spin-echo echo-planar imaging (EPI) was used for DTI acquisition. Parameters for current diffusion tensor imaging were obtained as followed: using sagittal plane, slice thickness = 3 mm, slice gap = 0 mm, acquisition matrix = 128 × 128, FOV = 230 mm, numbers of acquisition = 4. Diffusion was measured along six non-collinear directions with two b values (0, 400 s mm−2).
Data and images postprocessing and analysis
The diffusion tensor images were transferred to workstation using a software written in interactive data language (IDL version 5.6) and were analyzed off-line by two experienced neuroradiologists (W.J.C, T.F.D) who were blinded to patients’ clinical data. Disagreements were resolved via discussion until decisions were reached by consensus. The evaluation focused on the DTI and conventional MR images analysis, combined with the radiographical findings.
The ADC and FA values were measured using regions of interest (ROIs, size 50 pixels) technique in cervical spinal cord at four different level segments, C2/3, C3/4, C4/5, C5/6 for healthy volunteers, in lesions (or the compressive cord) and normal segments for patients, respectively. The intramedullary lesions were defined as the hyperintensity on T2-weighted image or the compressive cervical cord. The normal cord segment for patients was defined as the segments 1.5 cm distant from the lesion. DTI original images were automatically processed using IDL software to produce color DTI maps. The anisotropic diffusion in the craniocaudal direction was shown in blue. The diffusion in anterioposterior direction and right-left direction was displayed in red and green, respectively.
Statistics analysis
A standard SPSS12.0 for windows (SPSS Institute, Chicago, IL) software package was adopted for the statistical analysis. Data were expressed with mean ± stand deviation  . Paired t test, χ2 test and one-way ANOVA (analysis of variance) analysis was used. P < 0.05 was considered statistically significant.
Results
DTI manifestations of cervical spinal cord in healthy volunteers
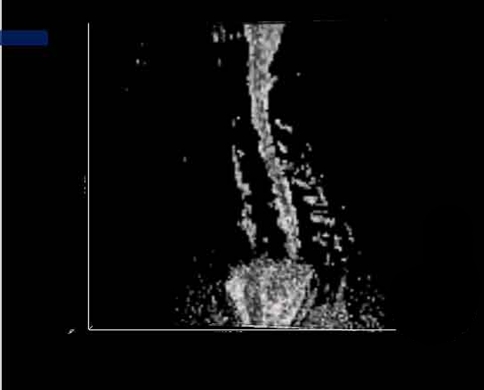
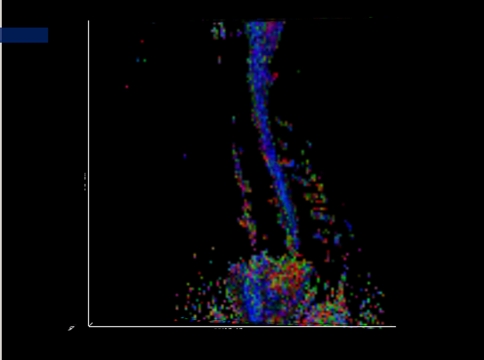
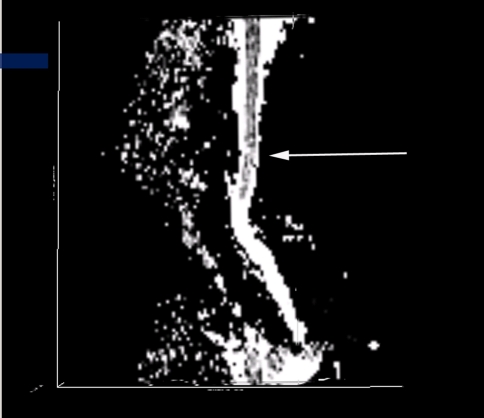
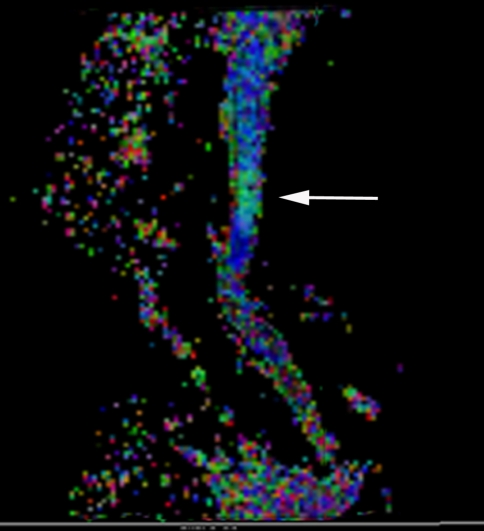
CSF appeared hyperintense on the ADC map and hypointense on FA map (Fig. 1). Cervical spinal cord showed intermediated- intense on the ADC map and hyperintense on FA map. Cervical spinal cord showed a very uniform ADC value on ADC map. On the color DTI map (Fig. 2), spinal cord showed blue. Four different level segments of cervical spinal cord, C2/3, C3/4, C4/5, C5/6, were analyzed and found that FA value between them had a significant difference using one-way ANOVA, F = 159.24, P < 0.01, with the highest FA value (0.85 ± 0.03) of spinal cord segment at C2/3 level. However, ADC values between four segments had no significant difference (F = 2.08, P > 0.05). (Table 1).
Fig. 1.
Sagittal FA map of cervical spinal cord in a healthy volunteer demonstrating the homogeneous signal intensity of cervical spinal cord
Fig. 2.
Sagittal color diffusion tensor imaging (DTI) map showing that cervical cord is blue (b = 400 s mm−2), the same volunteer as in the Fig. 1
Table 1.
Comparisons of ADC and FA values of cervical cord in 20 volunteers
| Mean ADC value ± SD (× 10−6mm2 s−1) | Mean FA value ± SD | |
|---|---|---|
| C2/3 level | 715.35 ± 96.76 | 0.85 ± 0.03 |
| C3/4 level | 713.27 ± 86.38 | 0.81 ± 0.02 |
| C4/5 level | 728.46 ± 95.69 | 0.78 ± 0.02 |
| C5/6 level | 734.42 ± 64.59 | 0.66 ± 0.04 |
MRI and DTI manifestations of cervical spinal cord in patients
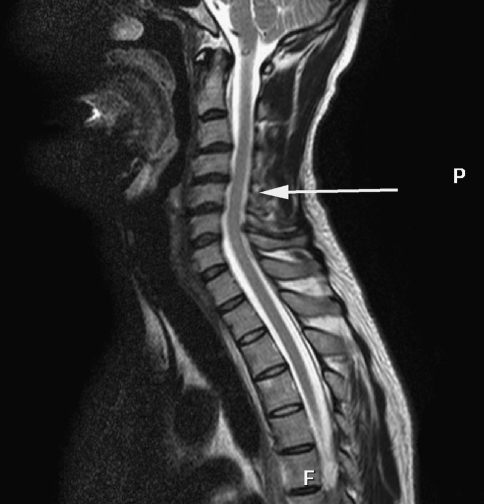
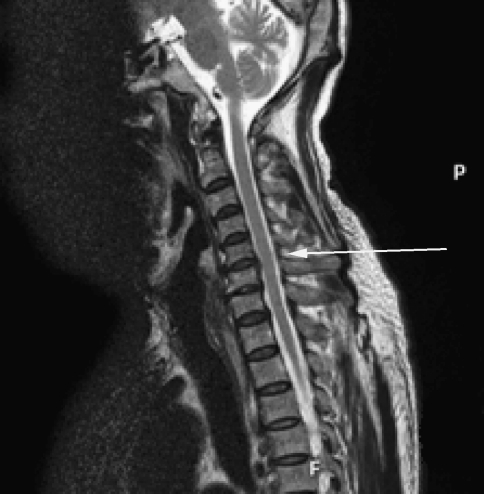
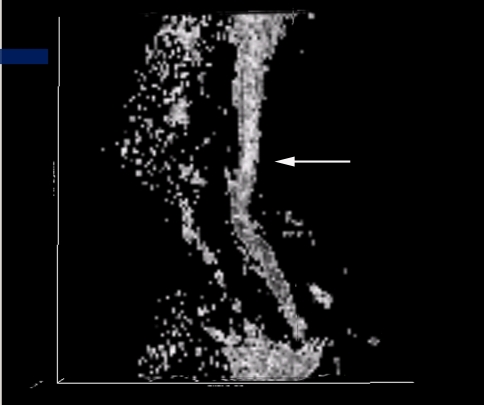
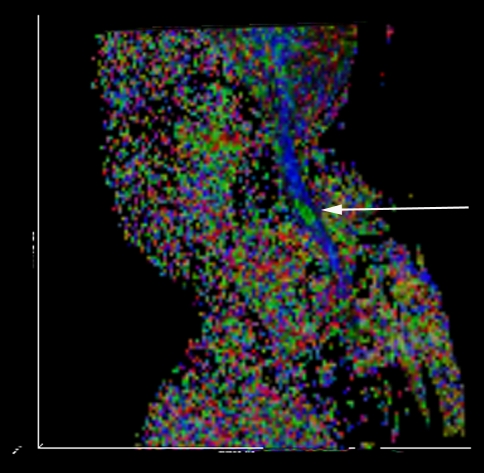
Conventional T2-weighted images showed high signal intensity within the cervical cord only in 24 cases, without abnormal signal in 26 cases (Figs. 3, 7).1,2 The remaining three cases were excluded from the further analysis because of the poor image quality produced by the motion artifacts. On DTI maps, 39 cases were found abnormal signal within the cervical spinal cord as follows: high signal intensity on ADC maps (Fig. 4), low signal intensity on FA maps (Fig. 5) and patchy yellow signal on color DTI maps (Figs. 6, 8) appearing on otherwise normal blue spinal cord. We found color diffusion tensor images can show more lesions than routine MR images (χ2 = 9.65, P < 0.01). Also, ADC and FA values between lesions (or the compressive cord) and the non-compressive spinal cord had significant difference (Table 2, paired t test, for ADC, t = 2.88, P < 0.01, for FA, t = 2.62, P < 0.01).
Fig. 3.
Sagittal MR T2WI demonstrating C4/5 intervertebral disc herniation and thickness of the ligamentum flavum but without abnormal signal intensity in the cervical spinal cord
Fig. 7.
The routine MR T2WI image demonstrating C5/6 intervertebral disc herniation and thickness of the posterior longitudinal ligament but without abnormal signal intensity in the cervical spinal cord
Fig. 4.
ADC map of the same patient showing no abnormal signal intensity in the cervical spinal cord
Fig. 5.
FA map of the same patient showing slight hyperintensity in the cervical spinal cord
Fig. 6.
The color DTI map of the same patient showing abnormal green signal intensity in the blue background of normal cervical spinal cord
Fig. 8.
Sagittal color DTI map of the same patient showing intramedullary the pathy green signal at C5/6 level
Table 2.
Comparisons of ADC and FA values of the compressed or compromised cord and non-compressed cord in 50 patients with cervical spondylotic myelopathy
| Lesions (or the compressive cord) | Non-compressed cord | t | P | |
|---|---|---|---|---|
| Mean ADC value | 836.57 ± 161.65 | 733.34 ± 82.85 | t = 2.88 | P < 0.01 |
| Mean FA value | 736.29 ± 84.25 | 775.95 ± 67.31 | t = 2.62 | P < 0.01 |
These volunteers and patients underwent follow-up MR and DTI examination within 6 months after the first check-up. No abnormal changes were revealed on the imaging appearances and clinical presentations in volunteers. The patients with minor symptoms without obvious evidence of pathologic reflexes or gait disturbance warrant follow-up observation or non-operative treatment. Operative intervention was performed in the patients with severe symptoms, including anterior or posterior approach. These patients took the postoperative MR and DTI examination to evaluate the curative effect, such as decompression of cervical canal, decrease of lesion area.
Discussion
MR imaging, owing to its high soft-tissue resolution, has played an important role in the analyzing the spinal cord’s gross structure and in the diagnosing lesions of spinal cord. However, the conventional MR imaging could not disclose the microstructure of the spinal cord, such as fiber tract of the white matter. With the development of diffusion-weighted imaging, especially the diffusion tensor imaging, it becomes possible by analyzing the water molecule diffusion motion in vivo. Compared with conventional MR imaging, DTI is a promising technique which was used gradually in clinical [6].
Unlike free water, water molecule diffusion in human was hindered by cell alignment pattern, cell membranes, and other intracellular and extracellular structures, showing the anisotropy [6]. Moseley et al. [15] reported that diffusion-weighted MR imaging can clearly show the ischemic lesions in the rat brain as early as the 45 min after the occlusion of middle cerebral artery. ADC maps were proved to be sensitive for detecting the early structural changes in the cervical compressive cord [1]. We utilized the DTI technique to observe the compressed spinal cord in the cervical spondylosis and canal stenosis. The highly ordered arrangement of axons in the white matter of cervical spinal cord makes its diffusion highly anisotropic. Water molecules, due to the limitation of the myelin sheath, moved rapidly along the white matter fiber tract but slowly along other directions. Diffusion anisotropy in the white matter of spinal cord was also confirmed in vivo by animal experiments in many literatures [5, 7, 10, 11].
In human in vivo, DTI of spinal cord began in 1999, Clark et al. [5] first reported that water diffusion in spinal cord in human is anisotropic. In 2002, Ries reported the cervical spondylosis and found lesions on DTI map but not showed on conventional MRI [16]. However, how to select the regions of interest became a dilemmatic challenge to radiologists as the cord diffusion anisotropy was measured in sagittal plane, although with a better coverage of lesions, probably including both white matter and gray matter. Notwithstanding it may be easy to discriminate the white matter from the gray matter in transverse plane, the less resolution and poor image quality made the cord anisotropy measured inaccurately. In current study, we still used the sagittal orientation to produce the DTI maps combined with the improved parameters, and the good quality image and cord anisotropy measurement can as well be obtained.
Routine MR imaging could show the cervical canal stenosis, protrusion of intervertebral disk, thickening of the ligamentum flavum and the posterior longitudinal ligament, etc. In this study, abnormal signal intensity was shown only for 24 patients in T2-weighted imaging, but 39 patients in DTI colored tensor images, on which green or red signals were seen on normal blue spinal cord. Demir et al. [8] reported the MR study of a group of cervical spondylosis in which 17 cases showed injuries on MR ADC maps, while only 13 cases in routine MR T2-weighted images. On the contrary, there were no abnormal findings on volunteers’ DTI maps. For another 26 patients without abnormal signal on all sequences of routine MR, however, the ADC and FA values in the segments of the compressive spinal cord differed obviously with the other segments of non-compressed spinal cord. There was no pathological confirmation of intramedullary lesions as it is impossible to get the specimens of human spinal cord in vivo. Nevertheless, those areas showed on DTI maps were correlated well with locations proved by clinical data.
The cause for the increased ADC values in the compressed cord is still uncertain. Tsuchiya et al. [19] explained it was possible that the elevated ADC values indicated the cystic necrosis, syrinx and atrophy were caused by myelomalacia. On our opinions, hyperostosis, intervertebral disk herniation and canal stenosis compressing the spinal cord could cause decreasing perfusion which might lead to ischemia and anoxemia and cellular membrane injury that could increase cellular membrane penetrability. And long-term compression to spinal cord may cause CSF to flow turbulently and to penetrate into spinal cord and to form intramedullary microcysts which cannot be displayed on conventional MR examination [8,14].
The decreased FA values were attributed to the restricted diffusion of water molecule in the compressed cord. The intramedullary edema resulted in destroyed balance between intra- and extra-cellular spaces and the combination of water molecule and protein could also cause the decreased diffusivity [14].
The anatomical structure and lesion can be displayed clearly on DTI images with single-shot spin-echo EPI sequence which could reduce the motion artifacts, and six-noncollinear directions using b value of 400 s mm−2. FA value in spinal cord of Chinese is higher at C2/3 level than other levels, the lower FA value at C5/6 level. This phenomenon, as Wheeler-Kingshott et al. [20] described, may be correlated with the ratio of the white matter to the gray matter. More caudally, the gray matter and the brachial plexus nerve root which cause directional changes of fibers gradually increased, resulting in FA value decreased. Colored-DTI maps can demonstrate lesions not seen on routine MR images.
Although clinicians can thoroughly and neurologically check patients even if without abnormal conventional MR manifestations, they seldom accurately localized the lesion and quantitatively analyzed the lesion. Indeed,once the abnormal signal occurred on the DTI, prophylactic treatment may be taken for severe cases to prevent clinical symptoms deteriorated. There are many conservative treatments, e.g., applying the cervical orthosis which is so feasible that patients can sit up and become ambulatory. Surgery is an alternative option for those patients who fail to achieve recovery after conservative treatment.
In conclusion, DTI can display the earlier alterations of the water molecule within the lesions due to its sensitivity to the movement of water molecule and can explain the discrepancy between conventional MRI findings and the clinical manifestations. However, resolution and image quality of DTI of spinal cord is also slightly inferior to that of brain. How to improve the image quality is the main problem in our further study.
Acknowledgments
The manuscript submitted was supported by the Medical Science Foundation of the Department of Health of Guangdong Province (No.A2006529), the Medical Science Foundation of the Bureau of Health of Guangzhou city (No.2005-YB-040), and Doctoral Scientific Research Start-up Foundation of Guangzhou Medical College (No. 2006GD081). No benefits in any form have been or will be received from a commercial party related directly or indirectly to the subject of this manuscript.
Footnotes
References
- 1.Aota Y, Niwa T, Uesugi M, Yamashita T, Inoue T, Saito T. The correlation of diffusion-weighted magnetic resonance imaging in cervical compression myelopathy with neurologic and radiologic severity. Spine. 2008;33:814–820. doi: 10.1097/BRS.0b013e318169505e. [DOI] [PubMed] [Google Scholar]
- 2.Baptiste DC, Fehlings MG. Pathophysiology of cervical myelopathy. Spine J. 2006;6(6 Suppl):190S–197S. doi: 10.1016/j.spinee.2006.04.024. [DOI] [PubMed] [Google Scholar]
- 3.Baron EM, Young WF. Cervical spondylotic myelopathy: a brief review of its pathophysiology, clinical course, and diagnosis. Neurosurgery. 2007;60(1suppl 1):35–41. doi: 10.1227/01.NEU.0000215383.64386.82. [DOI] [PubMed] [Google Scholar]
- 4.Cercignani M, Horsefield MA, Agosta F, Filippi M. Sensitivity-encoded diffusion tensor MR imaging of the cervical cord. AJNR. 2003;24:1254–1256. [PMC free article] [PubMed] [Google Scholar]
- 5.Clark CA, Barker GJ, Tofts PS. Magnetic resonance diffusion imaging of the human cervical spinal cord in vivo. Magn Reson Med. 1999;41:1269–1273. doi: 10.1002/(SICI)1522-2594(199906)41:6<1269::AID-MRM26>3.0.CO;2-2. [DOI] [PubMed] [Google Scholar]
- 6.Clark CA, Werring DJ. Diffusion tensor imaging in spinal cord: methods and applications—a review. NMR Biomed. 2002;15:578–586. doi: 10.1002/nbm.788. [DOI] [PubMed] [Google Scholar]
- 7.Clark CA, Werring DJ, Miller DH. Diffusion imaging of the spinal cord in vivo: estimation of the principal diffusivities and application to multiple sclerosis. Magn Reson Med. 2000;43:133–138. doi: 10.1002/(SICI)1522-2594(200001)43:1<133::AID-MRM16>3.0.CO;2-X. [DOI] [PubMed] [Google Scholar]
- 8.Demir A, Ries M, Moonen CT, Vital JM, Dehais J, Arne P, Caillé JM, Dousset V. Diffusion-weighted MR Imaging with apparent diffusion coefficient and apparent diffusion tensor maps in cervical spondylotic myelopathy. Radiology. 2003;229:37–43. doi: 10.1148/radiol.2291020658. [DOI] [PubMed] [Google Scholar]
- 9.Fehlings MG, Skaf G. A review of the pathophysiology of cervical spondylotic myelopathy with insights for potential novel mechanisms drawn from traumatic spinal cord injury. Spine. 1998;23:2730–2737. doi: 10.1097/00007632-199812150-00012. [DOI] [PubMed] [Google Scholar]
- 10.Franconi F, Lemaire L, Marescaux L, Jallet P, Le Jeune JJ. In vivo quantitative micro imaging of rat spinal cord at 7T. Magn Reson Med. 2000;44:893–898. doi: 10.1002/1522-2594(200012)44:6<893::AID-MRM10>3.0.CO;2-G. [DOI] [PubMed] [Google Scholar]
- 11.Gulani V, Webb AG, Duncan ID, Lauterbur PC. Apparent diffusion tensor measurements in myelin-deficient rat spinal cords. Magn Reson Med. 2001;45:191–195. doi: 10.1002/1522-2594(200102)45:2<191::AID-MRM1025>3.0.CO;2-9. [DOI] [PubMed] [Google Scholar]
- 12.Kaiser JA, Holland BA. Imaging of the cervical spine. Spine. 1998;23:2701–2712. doi: 10.1097/00007632-199812150-00009. [DOI] [PubMed] [Google Scholar]
- 13.LaRocca H. Cervical spondylotic myelopathy: natural history. Spine. 1988;13:854–855. doi: 10.1097/00007632-198807000-00028. [DOI] [PubMed] [Google Scholar]
- 14.Mamata H, Jolesz FA, Maier SE. Characterization of central nervous system structures by magnetic resonance diffusion anisotropy. Neurochem Int. 2004;45:553–560. doi: 10.1016/j.neuint.2003.11.014. [DOI] [PubMed] [Google Scholar]
- 15.Moseley ME, Kucharczyk J, Mintorovitch J, Cohen Y, Kurhanewicz J, Derugin N, Asgari H, Norman D. Diffusion-weighted MR imaging of acute stroke: correlation with T2-weighted and magnetic susceptibility-enhanced MR imaging in cats. AJNR. 1990;11:423–429. [PMC free article] [PubMed] [Google Scholar]
- 16.Ries M, Jones RA, Dousset V, Moonen CT. Diffusion tensor MRI of the spinal cord. Magn Reson Med. 2000;44:884–992. doi: 10.1002/1522-2594(200012)44:6<884::AID-MRM9>3.0.CO;2-Q. [DOI] [PubMed] [Google Scholar]
- 17.Sampath P, Bendebba M, Davis JD, Ducker TB. Outcome of patients treated for cervical myelopathy: a prospective, multicenter study with independent clinical review. Spine. 2000;25:670–676. doi: 10.1097/00007632-200003150-00004. [DOI] [PubMed] [Google Scholar]
- 18.Sinha S, Bastin ME, Whittle IR, Wardlaw JM. Diffusion tensor MR imaging of high-grade cerebral gliomas. AJNR. 2002;23:520–527. [PMC free article] [PubMed] [Google Scholar]
- 19.Tsuchiya K, Katase S, Fujikawa A, Hachiya J, Kanazawa H, Yodo K. Diffusion-weighted MRI of the cervical spinal cord using a single-shot fast spin-echo technique: findings in normal subjects and in myelomalacia. Neuroradiology. 2003;45:90–94. doi: 10.1007/s00234-002-0898-4. [DOI] [PubMed] [Google Scholar]
- 20.Wheeler-Kingshott CA, Hickman SJ, Parker GJ, Ciccarelli O, Symms MR, Miller DH, Barker GJ. Investigating cervical spinal cord structure using axial diffusion tensor imaging. Neuroimage. 2002;16:93–102. doi: 10.1006/nimg.2001.1022. [DOI] [PubMed] [Google Scholar]
- 21.Yukawa Y, Kato F, Yoshihara H, Yanase M, Ito K. MR T2 image classification in cervical compression myelopathy: predictor of surgical outcomes. Spine. 2007;32:1675–1678. doi: 10.1097/BRS.0b013e318074d62e. [DOI] [PubMed] [Google Scholar]


