

Abstract
Repeat proteins comprise tandem arrays of a small structural motif. Their structure is defined and stabilized by interactions between residues that are close in the primary sequence. Several studies have investigated whether their structural modularity translates into modular thermodynamic properties. Tetratricopeptide repeat proteins (TPRs) are a class in which the repeated unit is a 34 amino acid helix-turn-helix motif. In this work, we use differential scanning calorimetry (DSC) to study the equilibrium stability of a series of TPR proteins with different numbers of an identical consensus repeat, from 2 to 20, CTPRa2 to CTPRa20. The DSC data provides direct evidence that the folding/unfolding transition of CTPR proteins does not fit a two-state folding model. Our results confirm and expand earlier studies on TPR proteins, which showed that apparent two-state unfolding curves are better fit by linear statistical mechanics models: 1D Ising models in which each repeat is treated as an independent folding unit.
Keywords: repeat protein, tetratricopeptide repeat (TPR), protein design, differential scanning calorimetry (DSC), protein folding, Ising model, thermodynamic analysis, thermal denaturation
Introduction
Repeat proteins contain tandem arrays of a small structural motif, which differ in length (typically 18-47 amino acids) and in structure (alpha, beta, or alpha/beta) depending on the particular family of repeat protein. Their architecture is sustained by contacts between residues close in the primary sequence, with no long-range interactions. Because of their regular modular structure, repeat proteins represent a simple model system in which to study the physical basis of protein folding and stability.1–3 As an exemplar of this class, we focus on the tetratricopeptide repeat (TPR) protein family,4,5 in which the repeated unit is a 34 amino acid sequence that adopts a helix-turn-helix structure (Fig. 1).6,7 We have previously described the construction and characterization of a set of TPR proteins comprised of different numbers of tandem repeats of an identical consensus TPR unit—CTPRa2 to CTPRa20.8–10 We have studied the folding and stability of these CTPR proteins using a variety of biophysical methods.8,9,11,12 Individual equilibrium chemical or thermal denaturation curves display a cooperative single transition, indistinguishable from the characteristic denaturation curves of small globular proteins, which exhibit a two-state folding/unfolding transition.8,9,11 However, the denaturation curves of a family of proteins of different lengths are better described, and the experimental data are well-fit, by a 1D-Ising-model.11,13,14 In this application of a 1D Ising model, CTPR proteins are treated as linear polymers in which each repeat or helix is considered as the equivalent of an Ising spin, which can exist in one of two states: folded or unfolded. The Ising model predicts that a significant population of partially folded species will be populated at equilibrium close to the transition midpoint, and that such partially unfolded forms will have mostly the N- and/or C-terminal repeats unfolded.11,15 By contrast, in two-state folding/unfolding only fully folded and fully unfolded species are populated.
Figure. 1.

DSC thermograms of the proteins CTPRa2 to CTPRa20. The excess heat capacity is plotted versus temperature for CTPRa2 (green), CTPRa3 (yellow), CTPRa4 (magenta), CTPRa6 (cyan), CTPRa8 (blue), CTPRa10 (light green), and CTPRa20 (red). The curves are baseline-subtracted using a progressive baseline function and normalized to the molar protein concentration. Ribbon representations of the structures of three CTPR proteins within the series (CTPRa2, CTPRa4, and CTPRa20) are shown. Thermograms were recorded at a protein concentration of 0.5 mg/mL in 150 mM NaCl, 50 mM phosphate pH 6.8 buffer using a Micro Cal VP-Capillary DSC System (Micro Cal Llc, Northampton, MA), at a scan rate of 60°C/h.
Evidence that the TPR proteins do ‘fray from the ends’ comes from NMR hydrogen exchange (HX) studies of CTPR2 and CTPR3: The centermost helices are significantly more protected from exchange than the outer helices.16 In addition, native state HX (NHX) experiments on CTPR2 and CTPR3, corroborate and expand the results of the initial HX experiments. Each helix has a different subglobal stability, which match those predicted by the Ising model.15
Here we present a differential scanning calorimetry (DSC) study of the thermodynamics of the unfolding transition of the complete series of CTPRa proteins (2–20 repeats).17–19 The DSC data clearly show that these proteins exhibit non–two state unfolding behavior.
Results and Discussion
We performed a DSC study of all the proteins in the series: CTPRa2 to CTPRa20. The DSC thermograms show the following three characteristics (See Fig. 1 and Table I):
Table I.
Thermodynamic Parameters for CTPRs Unfolding by DSC and CD
| DSCa | |||||
|---|---|---|---|---|---|
| Tm (°C) | ΔT1/2 | ΔHcal (kcal mol−1) | ΔCp (kcal mol−1 deg−1) | CDbApparent ΔHVH (kcal mol−1) | |
| CTPRa2 | 57.9 | 15.9 | 47.1 | 0.7 | 46.5 |
| CTPRa3 | 68.3 | 11.0 | 78.2 | 0.9 | 63.2 |
| CTPRa4 | 72.7 | 8.9 | 102.6 | 0.9 | 76.3 |
| CTPRa6 | 77.1 | 6.2 | 191.9 | 1.9 | 115.4 |
| CTPRa8 | 78.9 | 5.1 | 257.0 | 2.7 | 118.2 |
| CTPRa10 | 80.1 | 4.3 | 334.9 | 2.8 | n.d.c |
The thermodynamic data has been calculated from the DSC thermograms using a model free analysis in microcal origin. A progress baseline was used to setup the baseline before using the integration function to calculate ΔHcal, Tm, and ΔT1/1. A step baseline was applied to calculate approximate ΔCp values. The apparent ΔHVH was calculated from the CD data assuming a two state model with linear extrapolated baselines for the native and unfolded states.
The apparent ΔHVH is the slope of the linear fit to the Van't Hoff plot (In K vs. 1/T).
n.d. not determined.
The greater the number of repeats, the higher the value of Tm. This behavior is consistent with the thermal denaturation data obtained by circular dichroism (CD).9,11
The greater the number of repeats, the sharper the denaturation peak, that is, the width at half height of the denaturation peak (ΔT1/2) decreases as the number of repeats increases. This behavior is in agreement with the observation from the CD data that the unfolding curves become sharper (the m-value increases) as the number of identical repeats within the CTPR array increases.9,11
The greater the number of repeats, the greater the area under the endothermic peak (i.e., the unfolding enthalpy).
To properly analyze such denaturation curves, it is essential to establish that the transition is reversible. To this end, the protein samples were rescanned under identical conditions after reaching the temperature of denaturation. The first and successive rescans for each CTPR protein are superimposable, clearly indicating that the unfolding transitions are reversible (Supporting Information Fig. 1A,B).
Calorimetric test for two-state behavior: van't Hoff versus calorimetric enthalpy
Whether or not an unfolding transition is two-state can be readily tested in a DSC experiment. The DCS thermogram can be fit to the van't Hoff equation for a two-state process, and the van't Hoff enthalpy (ΔHVH) of the unfolding process calculated.20 In addition, the area beneath the peak in the DSC endotherm can be used to calculate calorimetric enthalpy (ΔHcal), which is independent of any model assumptions. If both ΔHVH and ΔHcal are the same, the denaturation may be considered to be a two state process. Extensive calorimetric studies on small globular domains have demonstrated that these proteins typically show ideal two-state behavior: van't Hoff enthalpy equals calorimetric enthalphy.17,21 If the van't Hoff enthalpy is smaller than the calorimetric enthalpy it is likely that the unfolding process includes the formation of unfolding intermediates. We applied a simple two-state model (Microcal Origin) to fit the thermograms for the CTPR series (Fig. 2) and thus calculate ΔHVH for each protein. The DSC thermograms of CTPRs longer than 3 repeats could not be well fit by such a two-state model. As the number of repeats increases the quality of the two-state model fit to the data progressively decreases (Fig. 2). This result is by itself a clear indication that CTPR unfolding does not follow a simple two-state model. Because the DSC data fit so poorly to a two state model, we did not pursue this method of calculating ΔHVH. Instead, we estimated ΔHVH from the thermal denaturation data measured by CD. All such denaturation curves for the CTPR series, even though they are better described by a 1D-Ising model, can also be fit to a two-state model, and an “apparent ΔHVH” thus estimated. We compared such estimates of ΔHVH with the model free ΔHcal values measured by DSC. For all the CTPRs in the series (2–20 repeats) we observed that ΔHVH is smaller than ΔHcal, and that the difference between them increases as the number of repeats in the protein increases (Table I).
Figure. 2.

Attempting to fit the DSC thermograms of CTPRa3 (A), CTPRa6 (B) and CTPRa20 (C) to a two-state model. Solid black lines are the data, dotted lines show the best fit of the data to a two-state unfolding model (MicroCal Origin software package). It is clear that the quality of the fit to a two state model becomes worse as the number of tandem repeats in the protein increases. Chi-square values for the fit are 6.4 × 10+3 for CTPRa3, 6.3 × 10+5 for CTPRa6, and 1.2 × 10+8 for CTPRa20.
Origin of the asymmetry of the thermograms
It is also clear that the thermograms are not symmetric, and that the asymmetry becomes increasingly pronounced as the number of repeats in the protein increases (Fig. 2). A possible explanation for the asymmetry could be the contribution of kinetically determined irreversible processes. If such processes play a significant role, the shape of the thermograms should depend on the scan rate. To investigate this possibility, we acquired data using two different scan rates 60°C/h and 30°C/h. The DSC thermograms were unaffected by the change in the scan rate (Supporting Information Figure 1C), thus effectively ruling out this possible artifactual origin of the asymmetry.
The asymmetry observed in the DSC thermograms is evident for all proteins in the series, and becomes more pronounced for longer arrays. The DSC unfolding peaks are skewed at temperatures below the transition midpoint (Tm), where the transition is less sharp and deviates more from the two-state fit (Fig. 2). This observation can be explained by the existence of partially unfolded species before and around the transition mid-point but not after it.2,15,22
Heat capacity change for unfolding
Another important thermodynamic parameter that can be extracted from the thermograms is the heat capacity change, ΔCp, associated with the denaturation transition, that is, the difference in the heat capacity of the native and denatured states (Table I) (Fig. 3A). Direct calculation of the heat capacity from a single DSC scan depends on the quality of the DSC data and baseline stability. We consider the DSC data we present to be of sufficient quality (Fig. 3A) to allow the direct calculation of accurate ΔCp values in this fashion. We present the standard error obtained from two independent experiments (Fig. 3B) to lend additional support to this view. We found that the value of ΔCp increases linearly with the number of residues in the protein (Fig. 3B). It is widely accepted that the value of ΔCp is linearly dependent on the change in solvent-accessible nonpolar surface area upon unfolding (ΔASA), which is directly proportional to the number of residues in a protein.24 Such data has been assembled for a variety of globular proteins, and the slope of the plot of ΔCp versus number of residues is 0.016 kcal mol−1 deg−1 residues−1. Interestingly, the slope of a plot of ΔCp versus number of residues for the set of CTPR proteins is 0.010 kcal mol−1 deg−1 residues−1, significantly smaller than for globular proteins (Fig. 3B).23,24 This observation implies that the surface area exposed upon unfolding of a CTPR protein is smaller than expected from the number of residues in the protein. It can be rationalized by two unusual features of CTPR proteins: (1) their unfolded state is more compact than predicted by the typical self avoiding random walk treatment of the denatured state,25 and (2) their elongated native state results in a greater surface area to volume ratio than for a globular protein.9 Both these effects will contribute to the observed deviation from the behavior of globular proteins. The change in accessible surface area in going from folded to compact unfolded is less than that in going from folded to extended unfolded. Similarly, the change in going from extended folded to unfolded is less than in going from compact folded to unfolded. We cannot estimate the possible contribution of a more compact unfolded state, because we do not have a detailed structural characterization of the thermally denatured unfolded state. We can, however, estimate the contribution of the extended folded state by calculating the ASAN from the crystals structures of the CTPR proteins using the program GETAREA (http://curie.utmb.edu/getarea.html). We can then compare these calculated ASAN to the ASA of globular proteins. We observe a small deviation for CTPR proteins with 20 or fewer repeats (Supporting Information Figure 2). We therefore conclude that the predominant cause of the deviation in the ΔCp values is the nature of the unfolded state.
Figure. 3.
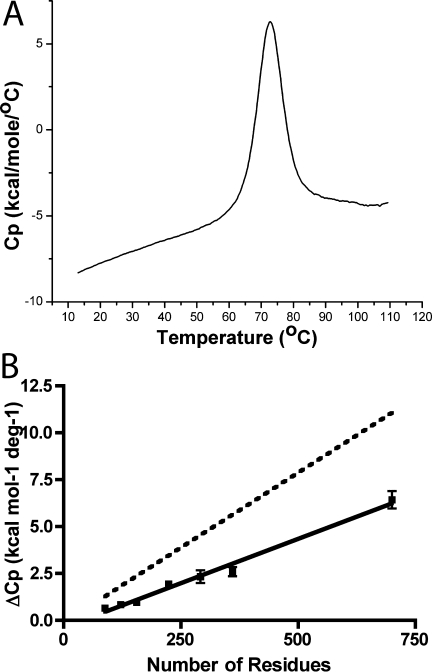
Heat capacity change for CTPR unfolding (A) Representative thermogram of CTPR to show the data quality for the ΔCp calculations. Thermogram of CTPRa4 protein normalized to the protein concentration and from which the buffer-buffer thermogram baseline has been subtracted. (B) Linear relationship between ΔCp and the number of residues in the protein. ΔCp is plotted versus number of residues for the proteins CTPRa2 to CTPRa20 (solid symbols). Data are average of two independent experiments. Error bars are the standard deviation, when not visible are smaller than the symbols of the average ΔCp value. The solid black line is linear fit of these data, giving a slope of 0.010 kcal mol−1 deg−1 residues−1. The dotted line shows the data for ΔCp versus number of residues for many globular proteins.23 The slope of this line is 0.016 kcal mol−1 deg−1 residues−1.
Conclusions
Here we present direct experimental evidence for the non–two state unfolding behavior of modular designed proteins (CTPRs). The DSC thermograms for CTPR proteins cannot be fit to a two state model, which clearly shows that the CTPR proteins do not unfold by a two-state mechanism. In addition, the estimated van't Hoff enthalpy does not equal the calorimetric enthalpy, the van't Hoff enthalpy is lower.
Interestingly, different conclusions were reached from DSC studies on a different class of repeat protein, the Notch ankyrin repeat domain (Nank). Zweifel and Barrick studied the thermal denaturation of Nank1-7 (the first 7 ank repeats of the Notch Ank domain) and Nank1-6 (first 6 repeats), note that these repeats are not identical to each other.26 For Nank1-7 a ratio of ΔHVH to ΔHcal of 0.99 was determined, consistent with two-state unfolding/folding.26,27 The unfolding transition of Nank1-6 was much broader making quantitative analysis problematic, and preventing the definitive interpretation of the data as indicative of two-state or multistate unfolding. The reason for the difference in behavior of the TPR versus Ank proteins in the DSC experiments is not clear, because other studies on the Nank proteins clearly indicate non–two state “Ising-like” behavior.28
In conclusion, the DSC thermograms of CTPR proteins and thermodynamic parameters calculated from them, clearly show how the modularity of these TPR proteins confers on them features that are readily distinguishable from those of globular proteins. The modular structure of TPR proteins translates into modular thermodynamics.
Acknowledgments
The authors thank the members of the Regan Lab: Tijana Z. Grove, Robielyn Ilagan, Daniel Schlingman, and Alice Q. Zhou for their comments on the manuscript. They thank G. I. Makhatadze and Simon G. J. Mochrie for insightful suggestions. This work was supported, in part, by the Human Frontier Science Program and by NIH (Grant R01GM080515). DSC experiments were acquired using a Micro Cal VP-Capillary DSC System (Micro Cal Llc, Northampton, MA) at the Yale Chemical Instrumentation Center.
References
- 1.Main E, Lowe A, Mochrie S, Jackson S, Regan L. A recurring theme in protein engineering: the design, stability and folding of repeat proteins. Curr Opin Struc Biol. 2005;15:464–471. doi: 10.1016/j.sbi.2005.07.003. [DOI] [PubMed] [Google Scholar]
- 2.Cortajarena AL, Regan L. The folding of repeat proteins. Oxford: Elsevier Science; 2010. [Google Scholar]
- 3.Kloss E, Courtemanchea N, Barrick D. Repeat-protein folding: New insights into origins of cooperativity, stability, and topology. Arch Biochem Biophys. 2008;469:83–99. doi: 10.1016/j.abb.2007.08.034. [DOI] [PMC free article] [PubMed] [Google Scholar]
- 4.Schultz J, Marshall-Carlson L, Carlson M. The N-terminal TPR region is the functional domain of SSN6, a nuclear phosphoprotein of Saccharomyces cerevisiae. Mol Cell Biol. 1990;10:4744–4756. doi: 10.1128/mcb.10.9.4744. [DOI] [PMC free article] [PubMed] [Google Scholar]
- 5.Lamb JR, Tugendreich S, Hieter P. Tetratrico peptide repeat interactions: to TPR or not to TPR? Trends Biochem Sci. 1995;20:257–259. doi: 10.1016/s0968-0004(00)89037-4. [DOI] [PubMed] [Google Scholar]
- 6.D'Andrea L, Regan L. TPR proteins: the versatile helix. Trends Biochem Sci. 2003;28:655–662. doi: 10.1016/j.tibs.2003.10.007. [DOI] [PubMed] [Google Scholar]
- 7.Main ERG, Jackson SE, Regan L. The folding and design of repeat proteins: reaching a consensus. Curr Opin Struct Biol. 2003;13:482–489. doi: 10.1016/s0959-440x(03)00105-2. [DOI] [PubMed] [Google Scholar]
- 8.Main ERG, Xiong Y, Cocco MJ, D'Andrea L, Regan L. Design of stable alpha-helical arrays from an idealized TPR motif. Structure. 2003;11:497–508. doi: 10.1016/s0969-2126(03)00076-5. [DOI] [PubMed] [Google Scholar]
- 9.Kajander T, Cortajarena AL, Mochrie SG, Regan L. Structure and stability of a consensus TPR superhelix. Acta Cryst. 2007;D63:800–811. doi: 10.1107/S0907444907024353. [DOI] [PubMed] [Google Scholar]
- 10.Kajander T, Cortajarena AL, Regan L. Consensus design as a tool for engineering repeat proteins. Methods Mol Biol. 2006;340:151–170. doi: 10.1385/1-59745-116-9:151. [DOI] [PubMed] [Google Scholar]
- 11.Kajander T, Cortajarena AL, Main ER, Mochrie SG, Regan L. A new folding paradigm for repeat proteins. J Am Chem Soc. 2005;127:10188–10190. doi: 10.1021/ja0524494. [DOI] [PubMed] [Google Scholar]
- 12.Cheng CY, Jarymowycz VA, Cortajarena AL, Regan L, Stone MJ. Repeat motions and backbone flexibility in designed proteins with different numbers of identical consensus tetratricopeptide repeats. Biochemistry. 2006;45:12175–12183. doi: 10.1021/bi060819a. [DOI] [PubMed] [Google Scholar]
- 13.Zimm BH, Bragg JK. Theory of the phase transition between helix and random coil in polypeptide chains. J Chem Phys. 1959;31:526–535. [Google Scholar]
- 14.Ising E. Beitrag zur Theorie des Ferromagnetismus. Z Phys. 1925;31:253–258. [Google Scholar]
- 15.Cortajarena AL, Mochrie SG, Regan L. Mapping the energy landscape of repeat proteins using NMR-detected hydrogen exchange. J Mol Biol. 2008;379:617–626. doi: 10.1016/j.jmb.2008.02.046. [DOI] [PMC free article] [PubMed] [Google Scholar]
- 16.Main ER, Stott K, SEJ, Regan L. Local and long-range stability in tandemly arrayed tetratricopeptide repeats. Proc Natl Acad Sci USA. 2005;102:5721–5726. doi: 10.1073/pnas.0404530102. [DOI] [PMC free article] [PubMed] [Google Scholar]
- 17.Freire E. Differential scanning calorimetry. Methods Mol Biol. 1995;40:191–218. doi: 10.1385/0-89603-301-5:191. [DOI] [PubMed] [Google Scholar]
- 18.Sanchez-Ruiz J. Differential scanning calorimetry of proteins. Subcell Biochem. 1995;24:133–176. doi: 10.1007/978-1-4899-1727-0_6. [DOI] [PubMed] [Google Scholar]
- 19.Makhatadze G, Privalov P. Energetics of protein structure. Adv Prot Chem. 1995;47:307–425. doi: 10.1016/s0065-3233(08)60548-3. [DOI] [PubMed] [Google Scholar]
- 20.Privalov PL, Khechinashvili NN. A thermodynamic approach to the problem of stabilization of globular protein structure: a calorimetric study. J Mol Biol. 1974;86:665–684. doi: 10.1016/0022-2836(74)90188-0. [DOI] [PubMed] [Google Scholar]
- 21.Privalov PL. Stability of proteins: small globular proteins. Adv Prot Chem. 1979;33:167–241. doi: 10.1016/s0065-3233(08)60460-x. [DOI] [PubMed] [Google Scholar]
- 22.Cziepluch C, Kordes E, Poirey R, Grewenig A, Rommelaere J, Jauniaux J. Identification of a novel cellular TPR-containing protein, SGT, that interacts with the nonstructural protein NS1 of parvovirus H-1. J Virol. 1998;72:4149–4159. doi: 10.1128/jvi.72.5.4149-4156.1998. [DOI] [PMC free article] [PubMed] [Google Scholar]
- 23.Geierhaas CD, Nickson AA, Lindorff-Larsen K, Clarke J, Vendruscolo M. BPPred: a Web-based computational tool for predicting biophysical parameters of proteins. Protein Sci. 2007;16:125–134. doi: 10.1110/ps.062383807. [DOI] [PMC free article] [PubMed] [Google Scholar]
- 24.Myers JK, Pace CN, Scholtz JM. Denaturant m values and heat capacity changes: relation to changes in accessible surface areas of protein unfolding. Protein Sci. 1995;4:2138–2148. doi: 10.1002/pro.5560041020. [DOI] [PMC free article] [PubMed] [Google Scholar]
- 25.Cortajarena AL, Lois G, Sherman E, O'Hern CS, Regan L, Haran G. Extensive non-native polyproline II secondary structure induces compaction of a protein's denatured state. J Mol Biol. 2008;382:203–212. doi: 10.1016/j.jmb.2008.07.005. [DOI] [PMC free article] [PubMed] [Google Scholar]
- 26.Zweifel ME, Barrick D. Studies of the ankyrin repeats of the Drosophila melanogaster notch receptor. 2. Solution stability and cooperativity of unfolding. Biochemistry. 2001;40:14357–14367. doi: 10.1021/bi011436+. [DOI] [PubMed] [Google Scholar]
- 27.Bradley CM, Barrick D. Limits of cooperativity in a structurally modular proteresponse of the Notch ankyrin domain to analogous alanine substitutions in each repeat. J Mol Biol. 2002;324:373–386. doi: 10.1016/s0022-2836(02)00945-2. [DOI] [PubMed] [Google Scholar]
- 28.Mello CC, Barrick D. An experimentally determined protein folding energy landscape. Proc Natl Acad Sci USA. 2004;101:14102–14107. doi: 10.1073/pnas.0403386101. [DOI] [PMC free article] [PubMed] [Google Scholar]