Abstract
Introduction: In late 2008, the Ohio Permanente Medical Group (OPMG) faced severe staffing shortages in its primary care physician group. In addition, the local market for recruitment did not look promising. As a result, many OPMG primary care physicians had very large patient panels, resulting in physician burnout and the Region faced member dissatisfaction in getting appointments. One solution explored was to hire nurse practitioners (NPs) to fill the staffing gap. To do this, Kaiser Permanente Ohio needed to understand what its model of care would look like with NPs. How would the group use the NPs to support its primary care physicians, and which physicians needed the additional support?
Methods: In addition to looking at panel size, the group also wanted to know which physicians needed additional support with disease management. Their demand model estimated the number of each physician's office visits; however, it was important to consider the disease component (disease burden) of a physician's patient panel. With the recent implementation of the Permanente Online Interactive Network Tool (POINT), the group planned to use data from the tool to determine the disease burden of each physician's panel. By identifying six chronic diseases from the POINT data and attaching a value, they determined both the disease burden of a physician's panel and the necessary level of support needed from the NPs. This created a new delivery structure that partnered one or two physicians on a team with an NP.
Results: This process resulted in a recommendation to hire 4.5 to 5.5 total NP full-time equivalents to fill the gap identified in capacity and correctly identified the physicians who needed NP support. In 2010, OPMG had 10 NPs, compared with 4 in 2008. The majority of these NPs are working in small teams and successfully supporting physicians with large panels and/or high disease burdens.
Conclusion: On the Patient Satisfaction Survey, patients' satisfaction with the time elapsed between scheduling an appointment and date of the visit went from 68% at the end of 2008 to 77% in the first quarter of 2010; the average days elapsed went from 33 in December 2008 to 23 in May 2010. Additionally, staffing shortages of 2008 have all been resolved, and the Region's clinician-retention rate has improved. Physician feedback has been very positive.
Introduction
Primary care physician shortages are occurring throughout the US and are affecting the delivery of primary care services.1,2 In late 2008, this problem was adversely affecting the model of care in the Kaiser Permanente (KP) Ohio Region as the group faced both the loss of primary care physicians and the reduction of primary care physician sources to recruit from. Because KP Ohio represents a very small segment of the insured population and there are many big-name competitors in Northeast Ohio, recruitment for physicians was already challenging without the additional decrease in the number of graduating primary care physicians. For the remaining Ohio Permanente Medical Group (OPMG) primary care physicians, consisting of 37 internists and 8 family practice specialists, this shortage meant larger panel sizes. The average panel size at the time was 2650 members per physician full-time equivalent (FTE; range, 1061–4627 adult patients). These larger panels resulted in more appointments, more phone calls, and more work overall to provide care for panels, which was causing clinician burnout and work dissatisfaction, which in turn caused additional physicians to leave the group. For KP patients, this was causing an increase in wait time to get an appointment, increases in wait time at the medical site, and delays in getting other needs met.
Senior leadership charged the Primary Care Access Team with developing a new primary care delivery model that would provide high-quality care, be quick to implement (by early 2009), and incorporate nurse practitioners (NPs). The model must accurately project the number of NPs to hire, by Medical Center, and match them with the physicians who most needed their assistance. The area market indicated that NPs could be hired, but the Primary Care Access Team had to understand how to use them and where. KP Ohio had long used a demand model that projected the number of office visits and determined the ideal panel size for each physician on the basis of those data and FTE level. This model was detailed, including age and sex adjustments, yet it used an outdated disease burden model that was based on pharmacy use data for patients by physician panel, last updated in 2001 and no longer available. The team proposed using the newly implemented Permanente Online Interactive Network Tool (POINT), its more sophisticated database, and availability of updated information to develop a panel showing disease burden by physician.
Methodology
Disease Burden
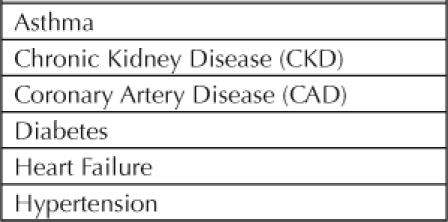
After careful analysis and discussion, six chronic diagnoses from POINT were chosen to be included in this model. These diagnoses were selected according to the following criteria: whether they were critical Healthcare Effectiveness Data and Information Set (HEDIS) measures, whether they were one of the diseases being tracked in POINT, and whether they had the highest frequency of occurrence for chronic disease among KP Ohio patients. It was thought that other diseases, although potentially burdensome, did not have a high enough occurrence rate to be counted. The selected diseases are listed in Table 1.
Table 1.
Chronic disease burden: diseases
Data was extracted from POINT listing all KP patients who had any of these six chronic diagnoses and their associated risk category. The POINT risk categories are low, moderate, high, and very high. The committee then decided to assign relative values to these categories: 1, low; 3, moderate; 5, high; and 7, very high (Table 2). A patient could have multiple chronic diseases and consequently be counted more than once. The total of these values for the six risk categories was summed for each physician, and then an average disease score was calculated. This number was then divided by the panel size to get an average disease burden for the Ohio Region (Table 3). For diabetes, for example, the sample physician's panel had patients with diabetes with the following risk-category distribution: 389 moderate, 5 high, and 5 very high. The calculation for disease burden score for that physician would be as follows:
 |
Table 2.
Chronic disease burden: risk categories and values
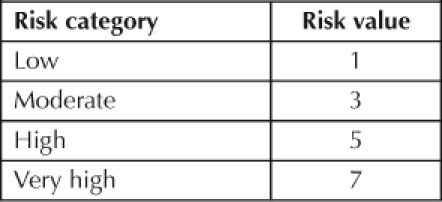
Table 3.
Sample physician panel: number of patients in each risk category for the six chronic diseases

The remaining calculations were made for all of the chronic diseases for that physician, for a total disease burden score of 3934. These calculations were then completed for every primary care physician, to get to a total regional score of 121,514, with the median score equaling 3016 for the physician group. Both internists and family practice specialists scored above and below the median. The regional score was divided by the total number of adult OPMG members (80,090) to get an average disease burden score of 1.52 per member (Table 4).
Table 4.
Regional average disease burden score calculation

Using Disease Burden to Adjust Panel Size
Once the regional average disease burden score of 1.52 was calculated, a disease score factor was computed by dividing the average disease score per member by the regional average (Table 5). A minimum disease score factor of 0.79 was established, but no maximum value was considered. The minimum value, which was one standard deviation from the average, was used as the lowest possible factor to allow for the possibility that there were other risk categories that were not included that could potentially affect demand. This factor was then applied to the “projected patient visits” of the physician's panel to calculate the “adjusted patient visit projection,” as shown in Table 6. The adjusted patient visit projection was then compared to the calculated capacity to determine if a variance or gap existed between the projected visits and the capacity to meet that visit demand (Table 7).
Table 5.
Disease burden score—disease factor calculation
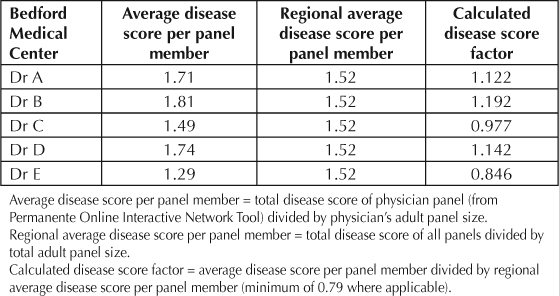
Table 6.
Use of disease score factor to adjust patient visit projections
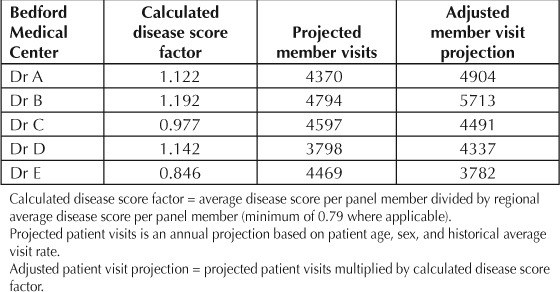
Table 7.
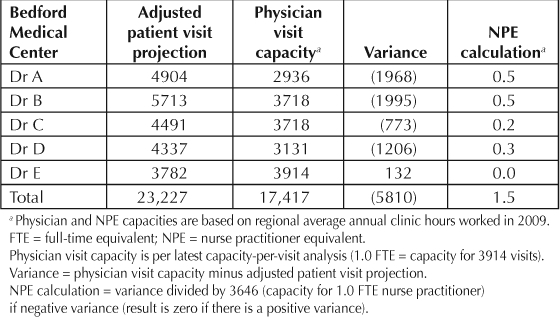
Nurse practitioner staffing support calculation
… physicians get acknowledgment, adjustment of a patient panel with a heavy disease load, and the needed support from an NP on their team.
Using Adjusted Panel Size, Demand, and Capacity to Determine the Nurse Practitioner Support Model
To help decrease its shortage of primary care physicians, the KP Ohio Region needed to know how many NPs to hire and to determine which physicians the NPs would be teamed with. The belief was that potentially one NP could provide support to two physicians, and these three clinicians would act as a small team for their assigned patients. (Note: NPs do not have their own panels of patients in Ohio.) With this staffing plan in mind, the group then conducted an analysis to determine what level of NP support would be needed to eliminate the gap for each physician's panel. The variance, based on the calculated capacity of 3646 annual appointments for an NP, was divided by the NP capacity to determine the NP FTE level necessary to support the physician(s) on the team. Table 7 shows several examples of this. For instance, Dr A would require 0.5 NP FTE to support her panel of patients. If a physician did not have a gap in capacity to meet anticipated office-visit demand (such as Dr E in Table 7), the calculated NP FTE need was not reduced for the team.
After the projected number of office visits for each physician's panel was compared with that physician's capacity to meet the demand, it was determined what each team's total FTE needs were for NPs. In Table 7, the team needed 1.5 NP FTEs to manage the office-visit demand, with Drs A and B each needing 0.5 NP, Drs C and D together needing 0.5 NP, and Dr E needing no additional support.
Results
As a result of the analysis process, KP Ohio hired a recommended 4.5 to 5.5 total NP FTEs to fill the gap in primary care clinician capacity. In addition, the process also identified the appropriate physicians by panel size and disease burden to receive NP support. Before implementation of this model, the NPs were not linked to any specific clinician or patient panel. Small teams were formed on which typically two physicians and one NP work together, with the NP seeing patients from both physicians' panels as needed, creating better access and linkage for patients and increasing patient satisfaction. On the Patient Satisfaction Survey, patients' satisfaction with the time elapsed between scheduling an appointment and date of the visit went from 68% at the end of 2008 to 77% in the first quarter of 2010. Another critical measurement that showed significant improvement was the number of days to the third next available future appointment, a standard measure used in health care to represent the average wait time to a future appointment. In December 2008, the average wait length was 33 days; in May 2010, this had shortened to 23 days, reflecting a 30% decrease. Additionally, the staffing shortages of 2008 have all been resolved, and the Region's clinician-retention rate has stabilized. Physician feedback to this approach and the staffing model has been very positive, especially regarding the fact that physicians get acknowledgment, adjustment of a patient panel with a heavy disease load, and the needed support from an NP on their team.
Discussion
Although this model is simple to implement, the Region has not analyzed the diseases used in calculating the need for NPs, whether additional diseases should be included, or whether the minimum factor of 0.79 should be adjusted. KP Ohio will investigate these areas in the future. In addition, successful incorporation of NPs into clinician teams depends on the ability of the partnering physicians to both use NPs' skills to their fullest and to market them to their patients as part of their team. This practice model is a work in process for KP Ohio. Updating and reviewing disease statistics and disease scores every six months is currently the only ongoing maintenance that this model requires. The model is very easy to implement, and the KP Ohio Region is committed to helping any Region interested in using it. We believe that this model is generically valid and applicable to any primary care clinician practice as an equitable and sensible way to arrange and forecast staffing and as an alternate way to staff a primary care clinic.
Disclosure Statement
The author(s) have no conflicts of interest to disclose.
Acknowledgments
Katharine O'Moore-Klopf, ELS, of KOK Edit provided editorial assistance.
References
- Villegas A. Doctor shortages fuels nurse practitioners' push for bigger role [serial on the Internet] Washington, DC: McClatchy; [about 2 p]; 2010 Feb 22. [cited 2010 Oct 3]. Available from: www.mcclatchydc.com/2010/02/22/87397/md-shortage-fuels-nurse-practitioners.html. [Google Scholar]
- Halsey A., III. Primary-care doctor shortage may undermine health care reform efforts. Washington Post. 2009 Jun 20. Available from: www.washingtonpost.com/wp-dyn/content/article/2009/06/19/AR2009061903583.html.
Suggested Reading
- Loviglio J. Nurse practitioners filling care void. Washington Post. 2006 Jun 25. Available from: www.washingtonpost.com/wpdyn/content/article/2006/06/25/AR2006062500282.html.
- One in 4 primary care MDs worry about care of sickest patients [monograph on the Internet] New York: Reuters Health; 1999 Dec 12. [cited 2010 Oct 3]. Available from: www.rescuehealthcareday.com/1in4.htm. Password protected. [Google Scholar]
- Tantau & Associates. Panel and panel equity [monograph on the Internet] Seattle, WA: Improving Chronic Illness Care; © 2006–2010 [cited 2010 Oct 3]. Available from: www.improvingchroniccare.org/downloads/3.2_pan-els_and_panel_equity.pdf. [Google Scholar]


