

Abstract
The melanocortin system in the hypothalamus controls food intake and energy expenditure. Its disruption causes severe obesity in mice and humans. cAMP-response element-binding protein 1 (CREB1) has been postulated to play an important role downstream of the melanocortin-4 receptor (MC4R), but this hypothesis has never been confirmed in vivo. To test this, we generated mice that lack CREB1 in SIM1-expressing neurons, of the paraventricular nucleus (PVN), which are known to be MC4R-positive. Interestingly, CREB1ΔSIM1 mice developed obesity as a result of decreased energy expenditure and impairment in maintaining their core body temperature and not because of hyperphagia, defining a new role for CREB1 in the PVN. In addition, the lack of CREB1 in the PVN caused a reduction in vasopressin expression but did not affect adrenal or thyroid function. Surprisingly, MC4R function tested pharmacologically was normal in CREB1ΔSIM1 mice, suggesting that CREB1 is not required for intact MC4R signaling. Thus CREB1 may affect other pathways that are implicated in the regulation of body weight.
Keywords: CREB, Metabolism, Neurobiology, Obesity, Transcription Factors
Introduction
The melanocortin 4 receptor (MC4R)2 is widely expressed in the central nervous system, including a number of sites that contribute to coordinated control of body weight (1–3). The essential role of the MC4R is evident from the presence of severe obesity in both MC4R knock-out mice and in humans with naturally occurring mutations (4, 5). These mutations cause increased food intake and decreased energy expenditure (4, 6, 7). One key site of MC4R expression is the paraventricular nucleus of the hypothalamus (PVN) (1–3). The PVN is an area that regulates several neuroendocrine, behavioral, and autonomic functions, especially food intake and energy expenditure (8–11). It has been implicated in the regulation of body weight as re-expression of MC4R in the PVN of mice on a null background rescues the obese phenotype (12). Mutations in the SIM1 (single-minded 1) gene, a transcription factor that controls development of the PVN, lead to the development of obesity in humans and mice, further implicating the PVN as a key regulator of body weight (13–17).
The MC4R is known to signal through Gsα, which in turn activates adenylyl cyclase, leading to increased intracellular levels of cAMP (1, 3, 18). Elevated cAMP levels induce phosphorylation and activation of the transcription factor cAMP-response element-binding protein (CREB1) through increased activity of protein kinase A, or PKA (19–22). The importance of this pathway in body weight regulation in vivo is highlighted by the fact that constitutive activation of PKA is associated with leanness (23). The phosphorylation of CREB1 leads to the activation of CREB target gene expression (24, 25). CREB signaling is complicated by the fact that a number of related transcription factors including cAMP-response element modulator (CREM) and activating transcription factor 1 are also phosphorylated by PKA and can compensate for CREB1 in its absence. Although activating transcription factor 1 is not thought to be expressed in the murine brain, CREM is known to be up-regulated when CREB1 is deleted. It is likely that both CREB1 and CREM have overlapping yet distinct roles in regulating target gene expression (26–31).
Once phosphorylated, CREB1 recruits a coactivator complex that includes CREB-binding protein and p300 to induce gene expression (21). Recently, CREB1 has been shown to require another specific family of coactivator proteins termed CRTCs (CREB-regulated transcriptional coactivators) (32). Interestingly CRTC1 KO mice develop obesity, whereas CRTC2 is implicated in glucose homeostasis (33, 34).
Activation of MC4R has been shown to phosphorylate CREB1 in vitro (35, 36). Thus CREB1 is postulated to mediate the genomic actions of MC4R in vivo (37), but this has not been previously tested. To do this, we used the Cre/loxP system and were able to delete CREB1 specifically in the PVN, the supra optic nucleus (SON), the nucleus of the lateral olfactory tract (NLOT), and the medial amygdala (MeAD) by using mice that express the Cre-recombinase in SIM1 expressing neurons (SIM1Cre mice). Our data demonstrate that CREB1ΔSIM1 mice develop obesity on both chow and high fat diets. This appears to be mediated by a decrease in energy expenditure and an impairment in maintaining their core body temperature, despite the increase in CREM expression in hypothalamic areas where CREB1 is absent. Surprisingly, MC4R signaling is not impaired in these animals. The global function of the hypothalamic-pituitary-thyroid and hypothalamic-pituitary-adrenal axes are also unchanged. However, vasopressin expression is decreased in the PVN of CREB1ΔSIM1 mice. Taken together these data suggest that CREB1 plays a specific role in body weight regulation via modulation of energy expenditure through downstream genomic targets.
EXPERIMENTAL PROCEDURES
Generation of CREB1ΔSIM1 Mice
To generate specific CREB1 knock-out (CREB1ΔSIM1) mice, mice harboring the CREB1loxP/+ allele (C57BL6, a gift of Dr. G. Schutz) were crossed with SIM1Cre transgenic mice (mixed C57Bl6, 129Sv, and FVB background) that express Cre-recombinase specifically in the PVN, medial amygdala, the SON, and the NLOT (12, 28, 38). The CREB1loxP/+ × SIM1Cre mice obtained from this first breeding were crossed with the CREB1loxP/+mice to obtain a second generation containing control mice (WT, CREB1loxP/loxP, and SIM1Cre littermates) and CREB1ΔSIM1 mice. Cre-mediated recombination of the CREB1loxP/loxP exon 10 allele leads to a null allele that encodes a truncated unstable protein devoid of DNA-binding and dimerization domains. Thus the result is the loss of CREB1 (12, 28). To obtain the second cohort of mice maintained at 18 °C, the same breeding scheme was used. Analysis of variance testing in both cohorts across different parameters has shown no differences between the three groups of controls: wild-type, SIM1Cre, and CREB1loPx/loxP (littermates). For the third cohort we used the following breeding scheme CREB1loxP/loxP × CREB1ΔSIM1 to obtain CREB1loxP/loxP littermates and CREB1 ΔSIM1 mice.
Analysis of CREB1ΔSIM1 Mice
A first cohort of mice (WT, CREB1loxP/loxP, SIM1Cre, and CREB1ΔSIM1) were housed individually at 22–24 °C using a 12 h of light/12 h of dark cycle with chow food (Harlan Teklad) and water provided ad libitum. A second cohort of mice (CREB1loxP/loxP and CREB1ΔSIM) was housed individually at 18 °C (long mild-cold exposure) with the same diet conditions as above. Finally, a third cohort (CREB1loxP/loxP and CREB1ΔSIM) of mice was housed under the same conditions above at 22–24 °C on a high fat diet (60% kCal fat, #D12492i; Research Diets). Body weight and food intake were recorded weekly. The mice were euthanized by decapitation to measure serum corticosterone level or by CO2 inhalation. All of the experiments were approved by the Institutional Animal Care and Use Committee of Beth Israel Deaconess Medical Center.
Immunohistochemistry
The brains were cut in coronal 30-μm sections. Sections containing the PVN were from bregma −0.58 to −1.22 mm. Immunohistochemistry methods have been described previously (39). The following primary antibodies were used: polyclonal total anti-CREB1 (1:200; Cell Signaling Technology), polyclonal anti-CREM (1:50; Santa Cruz Biotechnology), anti-oxytocin (OXT) and anti-[Arg8]-vasopressin (AVP; 1:500, Peninsula Laboratories). Secondary antibody rabbit IgG and diaminobenzidine kits were used (Vector Laboratories, Inc.). Immunohistochemistry analysis and quantification methods have been established previously (40). Specifically, this technique has been used to quantify neuropeptides including OXT and AVP (41–43).
Nissl Staining
The sections were delipidated in 1:1 alcohol/chloroform overnight and then rehydrated with decreasing concentrations (100–95, 60, and 30%) of ethanol to distilled water. The sections were stained in 0.1% cresyl violet solution for 3–5 min and destained with a solution containing 44 ml of 95% of alcohol, 66 ml of chloroform, and nine drops of glacial acetic acid. They were then dehydrated through increasing concentrations (30, 60, and 95–100%) ethanol for 3 min each and cleared with xylene for 3 min (44).
Body and Blood Composition
Body Composition
To determine the body composition of mice two different methods were used: 1) magnetic resonance imaging with EchoMRITM (Echo Medical System) and 2) PIXImus dual-energy x-ray absorptiometer with software version 1.2 (GE Healthcare).
Blood Tests
Fed mice were euthanized between 8 and 10 a.m., and blood and tissue were collected. Serum was extracted and assayed for insulin (Crystal Chem.), leptin (R & D Systems Inc.), and corticosterone levels (Immunodiagnostic Systems Ltd.). Radioimmunoassay was used for total T4 and total T3 measurements (Coat-A-Count, Siemens). Blood glucose was assessed by One Touch Ultra glucometer (LifeScan, Inc.).
Thyrotropin-releasing Hormone (TRH) In Situ Hybridization
To determine the expression of TRH mRNA in situ hybridization was performed as described previously (39, 45). Briefly, the images were acquired on Zeiss Axioimager. A1 with Axiovision 4.8 software (Oberkochen, Germany). Dark-field digital images of each hypothalamic region of the brain were taken with the same exposure time, brightness, and contrast. The images were quantified using ImageJ (Public Domain, Developed at the National Institute of Mental Health, Bethesda, MD). The same threshold was used for comparison sets. The total number of positive pixels/unit area (pixel density) was calculated subtracting background from areas not expressing TRH mRNA. Pixel density in each region of the hypothalamus was averaged from a minimum of three matching sections of the PVN. The data represent the average pixel density ± S.E.
Analysis of the MC4R Pathway
Expression of MC4R mRNA by In Situ Hybridization
In situ hybridization for mouse MC4R mRNA was performed as described above (1, 12).
MC4R Signaling
To test the functionality of the MC4R pathway, we performed two tests using the MC3/4-R agonist melanotan II (MT II) and the MC4R-specific agonist Ro27-3225. Briefly, on day 1, single-caged mice were fasted for 12 h. 30 min prior to the start of the dark cycle, the food was returned, and the mice were injected intraperitoneally with 200 μl of saline (0.9% sodium chloride injection; USP, Hospira Inc.). Food intake was measured for 3.5 h following the injection. On day 2, the same mice were fasted for 12 h. 30 min prior to the start of the dark cycle, the food was returned, and the mice were injected with 100 μg of MT II (H-3902; Bachem)/mouse in 200 μl of saline 30 min before the start of the dark cycle. Again, food intake was measured for 3.5 h (6, 12). The same protocol was used to test Ro27-3225 (Sigma) at 6.6 mg/kg. As each mouse served as its own control, a paired t test was used to analyze these data (6, 12, 46).
Energy Expenditure and Core Body Temperature (CBT)
Indirect Calorimetry
The metabolic rates were measured by indirect calorimetry in 12–14-week-old female CREB1ΔSIM1 and control mice (from the mice housed at 18 °C) by using the 16-chamber open-circuit Oxymax system of the comprehensive laboratory animal monitoring system; Columbus Instruments) and following a previously published protocol (12, 47).
Cold Exposure and CBT
The same group of mice used for indirect calorimetry was then used for the cold challenge. To determine the normal CBT of mice, we used a rectal probe (Physitemp Instruments Thermalert Model TH-8, Inc.). CBT readings were taken twice daily (8:00 a.m. and 8:00 p.m.) for three consecutive days. The mean for each animal per time point was averaged from the three days. The results are displayed as the means ± S.E. per genotype per time point. During the cold challenge at 4 °C, the CBT of each animal was monitored every hour over a 7-h period. Body weight and the food intake were recorded at the beginning and end of the experiment.
Intraperitoneal Glucose Tolerance Test (GTT) and Insulin Tolerance Test (ITT)
GTT
Male and female CREB1ΔSIM1 and control mice were fasted for 16 h prior to the start of the intraperitoneal GTT. After a sample of fasted blood (time 0) was collected, the animals were given glucose (1 g/kg of body weight, 20% dextrose; Baxter) intraperitoneally. Blood glucose readings were then taken at 15, 30, 60, 120, and 180 min.
ITT
For the ITT, the same mice were fasted for 6 h. After a sample of fasted blood was collected (time 0), the animals were injected intraperitoneal with Humulin R (Eli Lilly and Co.). Blood glucose readings were then taken after 15, 30, 60, 120, and 180 min using the One Touch Ultra (LifeScan, Inc.).
Real Time Quantitative PCR
Total mRNA was extracted from brown adipose tissue with the RNA-STAT-60 kit and quantified with the NanoDrop®-ND1000 (Thermo Scientific). cDNA was obtained by using the Advantage® RT-for-PCR kit (Clontech Laboratories Inc.). To quantify UCP1 (uncoupling protein 1), PGC1α (peroxisome proliferator-activated receptors γ coactivator 1), DIO2 (deiodinase 2), ADRB1 (β-adrenergic receptor), ACC1 (acety-CoA carboxylase 1), and GMPr (guanosine monophosphate receptor) gene expressions, TaqMan® assays were used (Mm00494069_m1, Mm01208835_m1, Mm00515664_m1, Mm00431701_s1, Mm01304277_m1, and Mm00499395_m1, respectively) (Applied Biosystems). Cyclophilin was used as a control. Quantitative PCR was run using the Stratagene® MX3000P® (Agilent Technologies). The gene to cyclophilin ratio was calculated for each sample based on the arbitrary value of copies determined by the standard curve for each gene.
Western Blotting
50 mg of brown adipose tissue from mice was homogenized in 1 ml of lysis buffer (Cell Signaling Technology) containing protease and phosphatase inhibitors using a TissueLyser (Qiagen) for 1 min at 30 Hz. The homogenates were centrifuged at 16,000 × g for 20 min at 4 °C, and the supernatant was transferred to a fresh tube. The proteins were resolved using 10% NuPAGE bis-tris gels (Invitrogen) and transferred to nitrocellulose membranes. The blots were probed for UCP1 (anti-UCP1, 1:200; Santa Cruz Biotechnology Inc.) and visualized using the ECL-Plus kit (Amersham BiosciencesTM GE Healthcare). For actin, the blots used to detect UCP1 were stripped and reprobed for actin (anti-actin, 1:1000; Sigma).
Plasmid Construction
To construct pGL3-avp-luc, −2009 to +27 of the putative mouse avp promoter was PCR-amplified from BAC RP24–388N9 (forward primer, CTCTGGTGGACATGCCACTC; reverse primer, GCAGCAGCTAGCCGTAGTGTTGAGCATCCTGGC; an added NheI restriction enzyme site is shown in bold type) and cloned into pGL3-basic (Promega) using KpnI-NheI sites and sequenced.
Cell Culture and Transient Transfection
293T cells were transfected in six-well plates with 10 ng of a CMV-β-galactosidase expression vector and 50 ng of a pGL3-avp-luc or pGL3 alone to determine the response to cAMP. To determine the response to CREB and CREM, 293T cells were transfected with the above reporters and 50 ng of either pKCR2-CREB (35, 36), pKCR2-CREMα, or pCDNA3.1-CREMτ2 (CREM plasmids are a generous gift from Dr. P. Sassone-Corsi) as indicated. pGL3-avp-luc was also cotransfected with pKCR2 and pCDNA3.1 alone. All of the transfections were performed with LipofectamineTM 2000 (Invitrogen) in serum-free OptiMem medium (Invitrogen). Sixteen hours after transfection, the cells were treated with or without 8-bromo-cAMP (250 μm) for 8 h. The cells were lysed and assayed for luciferase and β-galactosidase activity, respectively. All of the transfections described were performed in triplicate. The data shown are the means ± S.E. of at least three separate experiments.
Statistical Methods
All of the data are presented as the means ± S.E. To test for differences between groups of mice an analysis of variance test was run followed by a post hoc test Bonferonni adjustment. The data sets were analyzed using a two-tailed unpaired Student's t test. For the MT II and Ro27-3225 tests and the cold challenge experiments, a two-tailed paired Student's t test was run as each mouse served as its own control. Type one error α was set at 5% for all of our statistical analysis.
RESULTS
Generation of Mice Lacking CREB1 in the Paraventricular Nucleus
To generate mice that lack CREB1 in the PVN, we crossed transgenic mice expressing Cre-recombinase under the control of SIM1 regulatory elements with mice possessing a conditional CREB1 allele (12, 28). As shown in Fig. 1A, CREB1ΔSIM1 mice do not express CREB1 in the PVN. The CREB1ΔSIM1 mice also lack expression of CREB1 in other areas known to express SIM1 including the NLOT (Fig. 1B), SON (Fig. 1B), and MeAD (Fig. 1B). Because the deletion of the members of the CREB family can induce neuronal apoptosis, we verified the integrity of the areas that lack CREB1, using Nissl staining and did not see evidence of neuronal loss (Fig. 1C). CREM, a member of the CREB family, can compensate for CREB1 in its absence. Therefore, we examined CREM expression by immunohistochemistry and found it to be up-regulated in areas where CREB1 is deleted (Fig. 1, D and E), further confirming the integrity of these neurons. Thus mice lacking CREB1 in SIM1 neurons (27) are a viable model to examine the role of CREB1 in vivo.
FIGURE 1.

CREB1ΔSIM1 mice overexpress CREM in the PVN, SON (arrows), NLOT, and MeAD. A and B, immunohistochemistry against CREB1 in CREB1lox/lox and CREB1ΔSIM1 mice detailing the PVN and third ventricle (3V) (A) and detailing the SON, NOLT, and MeAD (black boxes) (B). In B, panels 1, 3, 5, and 7 are at 5× magnification. The highlighted areas, shown in panels 2, 4, 6, and 8 are at 10× magnification. C, Nissl staining was performed in the same mice. D and E, immunohistochemistry against CREM was performed in the same mice as detailing the PVN and third ventricle and detailing the SON (arrow), NLOT, and MeAD (E). SCh, suprachiasmatic nucleus. Bar scale, 100 μm. Shown are representative images from a total of four animals/group.
The Lack of CREB1 Leads to Obesity
To test the role of CREB1 in vivo, we followed the body weight of male and female CREB1ΔSIM1 mice and their respective controls on chow diet in the first cohort housed at 22 °C. As is shown in Fig. 2A, the body weights of male and female CREB1ΔSIM1 mice are increased beginning at 22 weeks and 16 weeks of age, respectively, and this is associated with a significant increase in body fat content and serum leptin levels (Fig. 2, B and C). We also looked for indications of glucose intolerance in male and female CREB1ΔSIM1 mice. Once the mice were obese, we found evidence of glucose intolerance in male CREB1ΔSIM1 mice but not in female mice as demonstrated by a GTT (supplemental Fig. S1A). Also, male CREB1ΔSIM1 mice have a significant increase in serum insulin in the fed state (supplemental Fig. S1C), with no change in blood glucose (supplemental Fig. S1D). However, the ITT is normal in both male and female CREB1ΔSIM1 mice compared with controls (supplemental Fig. S1B). ITTs and GTTs were also performed in the same group of mice on a chow diet at 8–10 and 16–18 weeks of age. No difference was observed between the control groups and the CREB1ΔSIM1 mice (data not shown).
FIGURE 2.

CREB1ΔSIM1 mice have an increase in body weight, fat mass, and serum leptin levels on a chow diet. A, body weight in females and males. B, body composition by magnetic resonance imaging (percentage of lean and fat mass) in females and males. C, serum leptin levels in females and males. The data are represented as the means ± S.E. *, <p = 0.05. For n = males/females: WT, n = 10/8; CREB1lox/lox, n = 12/12; SIM1Cre, n = 6 females; CREB1ΔSIM1, n = 11/13. The mice were housed at 22 °C.
A second group of male and female CREB1ΔSIM1 mice on a HFD also became obese (Fig. 3A). There was no difference in food intake in male and female CREB1ΔSIM1 mice on the HFD (Fig. 3B), suggesting that the development of obesity is secondary to decreased energy expenditure. Lean and fat mass were measured in these mice at 33 weeks of age, and male and female CREB1ΔSIM1 mice have similar lean mass (Fig. 3C) but increased fat mass (Fig. 3C) compared with control mice. Despite the development of obesity in CREB1ΔSIM1 mice on a HFD, both GTTs and ITTs at 28–29 weeks of age (and earlier time points) are not different from controls (supplemental Fig. S2).
FIGURE 3.

CREB1ΔSIM1 mice develop obesity on a HFD. A, body weight in control and CREB1ΔSIM1 mice. B, food intake in control and CREB1ΔSIM1 mice. C, body composition (dual-energy X-ray absorptiometer) in control and CREB1ΔSIM1mice. The mice were 33 weeks old. A group of male and female mice was fed with high fat diet and held at 22 °C. For n = males/females: CREB1lox/lox, n = 14/10; CREB1ΔSIM1, n = 10/15. *, p < 0.05; **, p < 0.01.
CREB1ΔSIM1 Mice Have Lower Energy Expenditure and Are Cold-intolerant
Mice lacking CREB1 in the PVN, SON, NLOT, and MeAD develop obesity on chow and HFD, with normal food intake indicative of decreased energy expenditure. However, we next noticed that when genetically identical kindred were housed at a lower temperature of 18 °C, male and female CREB1ΔSIM1 mice are significantly leaner than controls early in life (Fig. 4A) but then converge to controls by 11 weeks of age for males and 18 weeks of age for females. When transferred to a warmer environment (22 °C) for comprehensive laboratory animal monitoring system analysis, these mice demonstrated decreased oxygen consumption and significantly lower respiratory exchange ratio and heat production (Fig. 4B), indicating a decrease in energy expenditure and heat production consistent with what we found previously.
FIGURE 4.

CREB1ΔSIM1 mice housed at 18 °C have decreased body weight. A, body weight of mice fed a normal chow diet and housed at 18 °C (second cohort). For n = males/females: CREB1lox/lox, n = 8/8; CREB1ΔSIM1, n = 8/9. B, comprehensive laboratory animals measurement system was performed in the female CREB1lox/lox and CREB1ΔSIM1 mice (14 weeks old; n = 8/group) housed at 18 °C. The comprehensive laboratory animal monitoring system room was maintained at 22 °C. R.E.R., respiratory exchange ratio = VO2/VCO2. C, core body temperature in CREB1lox/lox and CREB1ΔSIM1 mice at room temperature (18 °C) in the morning (8:00 a.m.) and the evening (7:00 p.m.). D, core body temperature for 7 h at room temperature on day 1 (18 °C) and during cold exposure on day 2 (4 °C). *, p = 0.03. The data are represented as the means ± S.E. *, p < 0.05. At room temperature 18 °C, n = 8 mice/group; during cold exposure 4 °C; n = 7–8 mice/group. As each mouse is its own control, a paired t test was used to analyze these data. *, p < 0.05.
To further explore this discrepancy in body weight phenotype as a result of housing temperature, we measured the CBT of CREB1ΔSIM1 and control mice. CREB1ΔSIM1 mice have a significantly lower CBT compared with controls, especially in the evening (Fig. 4C). To further confirm this, we performed a cold challenge test in which CBT, body weight, and food intake were monitored for 7 h at 4 °C. CREB1ΔSIM1 mice have a lower CBT during the first 3 h of cold exposure (CE) compared with controls (Fig. 4D). After 3 h of cold exposure, CREB1ΔSIM1 mice recover their body temperature, which remains normal until the end of the experiment. Whereas both CREB1ΔSIM1 and control mice increase their food intake during cold exposure (supplemental Fig. S3A), only CREB1ΔSIM1 mice lose significant weight, indicating the increased energy cost of maintaining body temperature (supplemental Fig. S3B).
Taken together, these data demonstrate that CREB1ΔSIM1 mice at 22 °C have decreased energy expenditure, explaining the development of obesity on chow and high fat diets. At lower temperatures, CREB1ΔSIM1 mice must expend more energy to maintain their normal CBT, which induces weight loss.
CREB1ΔSIM1 Mice Have a Defect in Brown Adipose Tissue
To further determine how differences in temperature homeostasis may occur, we examined UCP1 mRNA and protein expression as an indicator of brown adipose tissue (BAT) activation. UCP1 mRNA was equally increased in both control and CREB1ΔSIM1 mice in response to CE (Fig. 5A). However, UCP1 protein expression is more abundant in CREB1ΔSIM1 mice at baseline and does not respond further to the CE, suggesting that CREB1ΔSIM1 mice cannot activate BAT in response to severe CE (Fig. 5B).
FIGURE 5.

Impaired BAT activation in CREB1ΔSIM1 mice. A, uncoupling protein 1 (UCP1) relative mRNA expression at room temperature (18 °C) or after 7 h of CE at 4 °C. B, Western analysis and its quantification of UCP1 and actin at room temperature (RT, 18 °C) or after 7 h of CE at 4 °C. +, positive control; BAT from control mice after cold exposure. C–F, β-adrenergic 1 receptor (ADRB1) (C), DIO2 (D), PGC1α (E), GMPr (F) relative mRNA expression, at room temperature (18 °C) or after 7 h of CE at 4 °C. The data are represented as the means ± S.E. At room temperature 18 °C, n = 8 mice/group; during cold exposure 4 °C, n = 7–8 mice/group. *, p < 0.05; **, p < 0.005.
We next examined the expression of a number of genes involved in BAT function including ACC1, DIO2, PGC1α, GMPr, and ADRB1. As expected, both control and CREB1ΔSIM1 mice had increased expression of ADRB1 consistent with sympathetic activation of BAT after CE (Fig. 5C). No change in ADRB3 expression was observed (data not shown). However, expression of DIO2 and PGC1α was significantly decreased in CREB1ΔSIM1 mice after CE, whereas GMPr gene expression was enhanced after CE (Fig. 5, D–F) (48). UCP2 gene expression did not change between control and CREB1ΔSIM1 mice after CE (data not shown). Importantly, creb1 mRNA expression in BAT is not modified in CREB1ΔSIM1 mice (data not shown). Thus CREB1ΔSIM1 mice have a defect in responding to CE despite enhanced sympathetic stimulation.
The impaired ability of the sympathetic nervous system in CREB1ΔSIM1 to stimulate BAT mice is supported by the gene expression patterns of these mice on HFD. Here, CREB1ΔSIM1 mice showed slightly increased Adrb1 expression (supplemental Fig. S4A) and significantly decreased GMPr expression (supplemental Fig. S4B), suggesting impaired sympathetic activation. This is supported by increased ACC1 expression (supplemental Fig. S4C), which is a marker of fatty acid synthesis. The exact mechanism underlying the defect remains to be fully characterized because UCP1, DIO2, and PGC1α are all equally expressed in control and CREB1ΔSIM1 mice on HFD (supplemental Fig. S4, D–F).
Disruption of CREB1 Does Not Impair the MC4R Pathway
Because the MC4R is expressed in SIM1-positive neurons and CREB1 has been hypothesized to be phosphorylated in MC4R-positive neurons in the PVN (37), we analyzed the MC4R pathway in CREB1ΔSIM1 mice. In situ hybridization of MC4R mRNA shows similar expression in control and CREB1ΔSIM1 mice, demonstrating that CREB1 is not required for MC4R expression (Fig. 6A). In addition, we pharmacologically tested the melanocortin pathway in CREB1ΔSIM1 lean mice by using two different analogues of α-MSH, the first specific to MC3/4Rs, MT II, and the second specific only to the MC4R, Ro27-3225. Compared with saline, both male and female control and CREB1ΔSIM1 mice showed a similar decline in food intake 3.5 h after injection of either MT II or Ro27-3225 (Fig. 6, B and C). Thus MC4R signaling as it relates to food intake appears to be normal in CREB1ΔSIM1 mice, which is consistent with the lack of hyperphagia seen in obese CREB1ΔSIM1 mice.
FIGURE 6.

The MC4R pathway is not affected by the lack of CREB1. A, in situ hybridization of MC4R mRNA expression (dark field) and thionin staining (inset). Bar scale, 100 μm. Representative images from a total of three animals/group. B, MT II test. After 12 h of fasting, saline (day 1) or MT II (day 2) was injected, and food intake was measured over a 3.5-h period. For n = males/females: WT, n = 8/8; CREB1lox/lox, n = 8/8; SIM1Cre, n = 6/8; CREB1ΔSIM1 n = 8/9. C, Ro27-3225 Test. After 12 h of fasting, saline (day 1) or Ro27-3225 (day 2) was injected, and food intake was measured over a 3.5-h period. The data are represented as the means ± S.E. For n = males/females: CREB1lox/lox, n = 5/7; CREB1ΔSIM1, n = 8/8. *, p < 0.05.
The Hypothalamic-Pituitary-Thyroid and -Adrenal Axes Are Normal in CREB1ΔSIM1 Mice
To evaluate the function of neuroendocrine circuits emanating from the PVN, we first looked at TRH mRNA expression in control and CREB1ΔSIM1 mice. TRH mRNA expression is enhanced in CREB1ΔSIM1 mice compared with control mice (Fig. 7A). In contrast, serum T4 levels were similar in control and CREB1ΔSIM1 mice fed a chow diet at 22 °C (Fig. 7B). Because thyroid hormone can participate in the maintenance of CBT, we also assessed the total T4 and total T3 serum levels in control and CREB1ΔSIM1 mice after 7 h of cold exposure (4 °C) and again saw no difference (Fig. 7, C and D). We also did not see differences in serum corticosterone levels in control and CREB1ΔSIM1 mice fed a chow diet at 22 °C (Fig. 7E). These data suggest that the decrease in energy expenditure and CBT observed in CREB1ΔSIM1 mice is not due to global alterations in the hypothalamic-pituitary-thyroid and hypothalamic-pituitary-adrenal axes.
FIGURE 7.
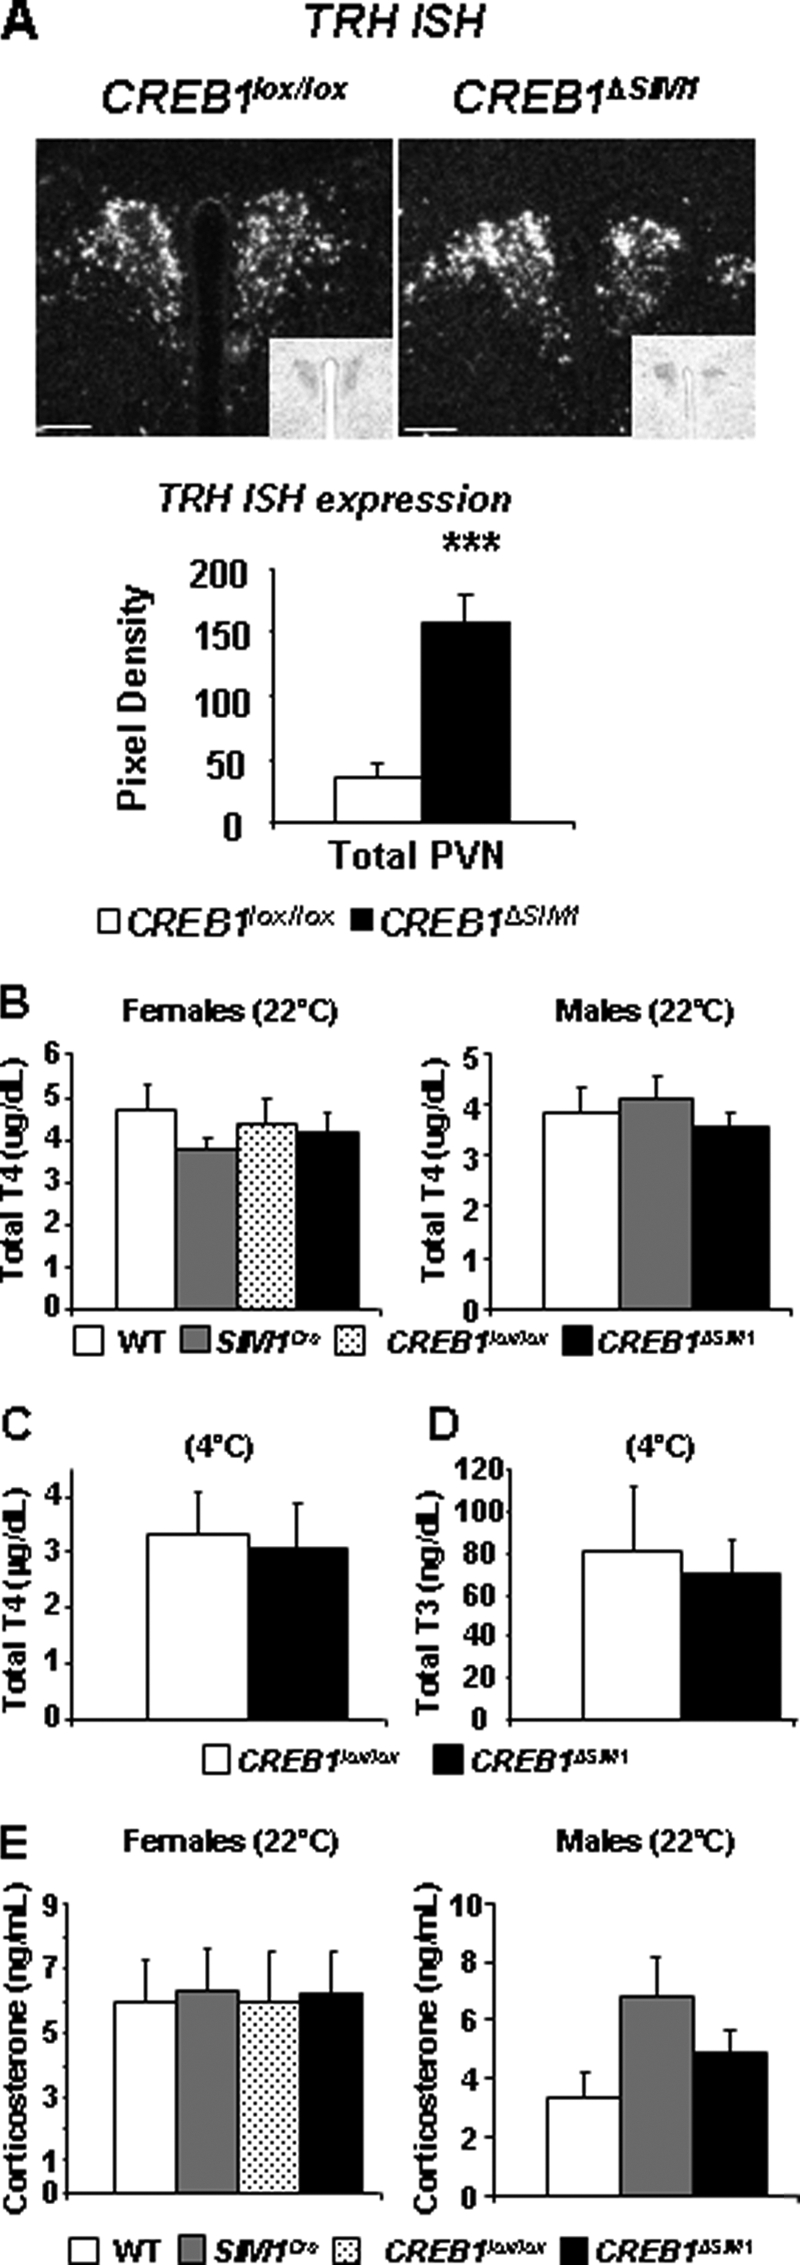
CREB1ΔSIM1 mice have normal endocrine function. A, in situ hybridization for TRH was performed in CREB1lox/lox and CREB1ΔSIM1 mice and subsequently quantified (n = 5). B, total T4 at 22 °C. C and D, total T4 (C) and total T3 (D) after 7 h at 4 °C (n = 8/group). E, corticosterone serum levels in male and female mice at 33 weeks of age on a chow diet. The data are represented as the means ± S.E. For n = males/females: WT, n = 10/8, CREB1lox/lox, n = 12/12, SIM1Cre, n = 6 males; CREB1ΔSIM1, n = 11/13.
CREB1ΔSIM1 Mice Have a Decrease of AVP but Not OXT in the PVN
Although both the thyroid and adrenal axis appeared normal, we next examined the expression of OXT and AVP, which are produced in MC4R- and SIM1-positive neurons in the PVN. OXT and AVP have been hypothesized to play a protective role in the prevention of obesity (14, 15). To accomplish, this we used quantitative immunohistochemistry to determine their abundance in the PVN. Whereas OXT levels were similar in control and CREB1ΔSIM1 mice (Fig. 8, A and B), AVP production was significantly reduced in the PVN (Fig. 8C). A more careful analysis of the different subpopulations of neurons in the PVN (Fig. 8D) demonstrates that the anterior parvicellular, medial magnocellular, and medial parvicellular nuclei are most affected. Because OXT and AVP are also expressed in the SON, we quantified their expression in this area and observed no difference between control and CREB1ΔSIM1 mice (supplemental Fig. S5, A–D).
FIGURE 8.

CREB1ΔSIM1 mice have decreased in AVP expression. A, immunohistochemistry for OXT in CREB1lox/lox and CREB1ΔSIM1 mice. B, quantification of OXT immunohistochemistry in CREB1lox/lox and CREB1ΔSIM1 mice. C, immunohistochemistry for AVP in CREB1lox/lox and CREB1ΔSIM1 mice. D, quantification of AVP expression in CREB1lox/lox and CREB1ΔSIM1 brains. The data represent the pixel density in whole PVN and in the different subnuclei of the PVN and are expressed as the means ± S.E. *, p < 0.05. The mice were 33 weeks old, fed with chow diet, and housed at 22 °C (n = 4/group). PaAP, paraventricular hypothalamic nucleus, anterior parvicellular part; PaDC, paraventricular hypothalamic nucleus, dorsal cap; PaLM, paraventricular hypothalamic nucleus, lateral magnocellular part; PaMM, paraventricular hypothalamic nucleus, medial magnocellular part; PaMP, paraventricular hypothalamic nucleus, medial parvicellular part; PaPo, paraventricular hypothalamic nucleus, posterior part; PaV, paraventricular hypothalamic nucleus, ventral part; 3V, third ventricle. Bar scale, 100 μm. E, 293T cells were transfected with either pGL3 AVP-luc or pGL3-luc alone and a CMV-β galactosidase control. *, p < 0.05. F, 293T-cells were cotransfected with AVP-Luc, a CMV-β galactosidase control, and either pKCR2-CREB, pKCR2-CREMα, or pCDNA3.1-CREMτ2 in the presence or absence of 250 μm 8-bromo-cAMP (8-Br-cAMP).
To confirm that AVP expression could be influenced by the cAMP-CREB pathway, we cloned the murine AVP promoter upstream of luciferase and tested its activity in 293T cells. Indeed, 8-bromo-cAMP was able to stimulate expression of luciferase, consistent with what has been described previously with the AVP rat promoter (Fig. 8E) (49). Interestingly, when we cotransfected two isoforms of CREM, we observed a significant repression of luciferase activity when compared with cotransfected CREB1 (Fig. 8F). The cotransfection of CREM isoforms or CREB1 did not affect cAMP stimulation (Fig. 8F).
DISCUSSION
CREB1 is a transcription factor that can drive the expression of numerous genes (27, 50) implicated in the regulation of food intake and energy expenditure including TRH, CRH, OXT, and AVP (14, 15, 51–53). In addition, CREB1 has been postulated to play a key role downstream of the MC4R in the PVN (37). Thus to test the role of CREB1 in body weight regulation and MC4R signaling, we chose to delete CREB1 from SIM1-positive neurons in the PVN using a conditional targeting strategy. Indeed, all MC4R neurons in the PVN express SIM1 (16). However, because SIM1 is also expressed in other neuronal groups, we deleted CREB1 in the NLOT, SON, and MeAD. A PVN-only specific Cre currently does not exist, making this the best available strategy to test the role of CREB1 in a unique set of neurons known to regulate body weight.
Importantly, we have established that the deletion of CREB1 from the PVN does not impair the integrity of these neurons. Lack of CREB1, CREM, or both can induce apoptosis and neurodegeneration as described previously (26, 28–30). However, by deleting CREB1, we have clearly up-regulated CREM expression, which could potentially compensate for the lack of CREB1. Thus this model may under-represent the importance of the CREB family in body weight regulation. The third member of the CREB family, activating transcription factor 1 does not appear to be expressed in the murine brain (54).
By deleting CREB1 in neurons where SIM1 is expressed, we found that obesity was induced provided the animals were housed at warmer temperatures (22 °C). Surprisingly, this obesity was not the result of increased food intake but was secondary to decreased energy expenditure. Furthermore, glucose intolerance in these mice was relatively mild despite the development of obesity. Mice that lack Gsα in the brain develop a similar phenotype (55). Indeed, Gsα lies immediately downstream of the MC4R and is proximal to CREB1. Disruption of the maternal (but not paternal) Gsα allele in the brain leads to the development of obesity, insulin resistance, and diabetes associated with reduced sympathetic nervous system activity and energy expenditure (56). This appears to be primarily due to a lack of Gsα in the PVN. Similar to our model, these animals had no evidence of hyperphagia. These data suggest that the PKA-CREB1 pathway may be important in the regulation of energy expenditure by the MC4R. In contrast, our pharmacologic data clearly show that CREB1 is not required for the regulation of food intake by the MC4R. Thus it remains possible that MC4R is able to signal through other non-PKA/CREB pathways such as the MAPK pathway or through the EPACs (exchange proteins directly activated by cAMP). These pathways have been linked to both the MC4R and cAMP signaling (57–59).
Another striking finding in CREB1ΔSIM1 mice is that development of obesity is prevented when they are housed at colder temperatures. Because CREB1ΔSIM1 mice have a defect in BAT-mediated adaptive thermogenesis, they must evoke other thermogenic mechanisms that are less efficient and therefore lead to an increase in energy expenditure when housed in the cold. Previous work has demonstrated that the MC4R plays a critical role in energy homeostasis and regulation of adaptive thermogenesis by activating UCP1 in BAT through the sympathetic nervous system (7, 60, 61). Consistent with this, CREB1ΔSIM1 mice are unable to further activate UCP1 protein levels in response to a cold challenge indicative of a deficit in BAT activation. Impairment of PGC1α and DIO2 induction in BAT of CREB1ΔSIM1 mice during a cold challenge despite their enhanced sympathetic stimulation further supports this hypothesis. Indeed, the PVN, which contains SIM1 and AVP immunoreactive positive neurons, projects to the dorsal vagal complex, as well as to sympathetic centers located in the spinal cord (62–66). Because AVP expression is decreased in our mouse model, this could explain why sympathetic nervous system function is altered. Taken together, the data suggest that CREB signaling in the PVN regulates body weight by altering energy expenditure potentially through the sympathetic nervous system and possibly the MC4R, which has been shown to affect this pathway when activated.
Finally, our work demonstrates that obese CREB1ΔSIM1 mice have altered AVP protein expression in the PVN but not in the SON, implicating AVP in the phenotype of CREB1ΔSIM1 mice. Indeed, the AVP promoter contains two CRE sites (49, 67) and responds to cAMP in our transfection system. Additionally, down-regulation of AVP is associated with the development of obesity (11, 14, 42, 68). Essentially, AVP appears to be specifically targeted in CREB1ΔSIM1 mice because the regulation of other key PVN-specific neuropeptides and the pathways they control are unaffected. Further work will be required to determine the role of AVP in the phenotype seen in CREB1ΔSIM1 mice.
In summary, we demonstrate that disruption of CREB1 in SIM1-positive neurons led to an obese phenotype similar to that of the PVN-specific Gsα knock-out mice. Our findings clearly underline the value of the PKA-CREB1 pathway in the regulation of body weight. However, the phenotype of both CREB1ΔSIM1 mice and Gsα knock-out mice is milder and distinct from both the MC4R knock-out mouse and the SIM1 haploinsufficient mouse. This suggests that the MC4R may only partially signal through the PKA-CREB1 pathway in the PVN to mediate its effects.
Supplementary Material
Acknowledgments
CREBlox/lox mice and SIM1Cre mice were a generous gift from Dr. Gunther Schutz from Deutsches Krebsforschungszentrum (DKFZ) and Dr. Brad Lowell from Beth Israel Deaconess Medical Center (BIDMC), respectively. pKCR2-CREMα and pCDNA3.1-τ2 plasmids were a gift from Dr. P. Sassone-Corsi (University of California, Irvine).
This work was supported by the Smith Family Pinnacle Award from the American Diabetes Association (to A. N. H.), NIH Grant R01 DK078090 (to A. N. H.), and a research grant from Takeda Pharmaceuticals. The comprehensive laboratory animal monitoring system is a part of the Physiological Core (Dr. Maratos-Flier, Beth Israel Deaconess Medical Center), supported by NIH Grant (NIH/5P01DK056116-10).

The on-line version of this article (available at http://www.jbc.org) contains supplemental Figs. S1–S5.
- MC4R
- melanocortin-4 receptor
- ACC1
- acety-CoA carboxylase 1
- ADRB1
- β-adrenergic receptor 1
- AVP
- [Arg8]-vasopressin
- BAT
- brown adipose tissue
- CBT
- core body temperature
- CE
- cold exposure
- CREB1
- cAMP-response element binding protein
- CREM
- cAMP-response element modulator
- DIO2
- deiodinase 2
- GTT
- glucose tolerance test
- GMPr
- guanosine monophosphate receptor
- HFD
- high fat diet
- ITT
- insulin tolerance test
- MeAD
- medial amygdale
- MT II
- melanotan II
- NLOT
- nucleus of the lateral olfactory tract
- OXT
- oxytocin
- PGC1
- peroxisome proliferator-activated receptors gamma coactivator 1
- PKA
- protein kinase A
- PVN
- paraventricular nucleus of the hypothalamus
- SON
- supra optic nucleus
- TRH
- thyrotropin-releasing hormone
- UCP1
- uncoupling protein 1
- WT
- wild-type.
REFERENCES
- 1. Kishi T., Aschkenasi C. J., Lee C. E., Mountjoy K. G., Saper C. B., Elmquist J. K. (2003) J. Comp. Neurol. 457, 213–235 [DOI] [PubMed] [Google Scholar]
- 2. Liu H., Kishi T., Roseberry A. G., Cai X., Lee C. E., Montez J. M., Friedman J. M., Elmquist J. K. (2003) J. Neurosci. 23, 7143–7154 [DOI] [PMC free article] [PubMed] [Google Scholar]
- 3. Mountjoy K. G., Mortrud M. T., Low M. J., Simerly R. B., Cone R. D. (1994) Mol. Endocrinol. 8, 1298–1308 [DOI] [PubMed] [Google Scholar]
- 4. Huszar D., Lynch C. A., Fairchild-Huntress V., Dunmore J. H., Fang Q., Berkemeier L. R., Gu W., Kesterson R. A., Boston B. A., Cone R. D., Smith F. J., Campfield L. A., Burn P., Lee F. (1997) Cell 88, 131–141 [DOI] [PubMed] [Google Scholar]
- 5. Yeo G. S., Farooqi I. S., Challis B. G., Jackson R. S., O'Rahilly S. (2000) Q. J. Med. 93, 7–14 [DOI] [PubMed] [Google Scholar]
- 6. Chen A. S., Metzger J. M., Trumbauer M. E., Guan X. M., Yu H., Frazier E. G., Marsh D. J., Forrest M. J., Gopal-Truter S., Fisher J., Camacho R. E., Strack A. M., Mellin T. N., MacIntyre D. E., Chen H. Y., Van der Ploeg L. H. (2000) Transgenic Res. 9, 145–154 [DOI] [PubMed] [Google Scholar]
- 7. Ste Marie L., Miura G. I., Marsh D. J., Yagaloff K., Palmiter R. D. (2000) Proc. Natl. Acad. Sci. U.S.A. 97, 12339–12344 [DOI] [PMC free article] [PubMed] [Google Scholar]
- 8. Balthasar N. (2006) Obesity 14, (Suppl. 5) 222S–227S [DOI] [PubMed] [Google Scholar]
- 9. Hollenberg A. N. (2008) Thyroid 18, 131–139 [DOI] [PubMed] [Google Scholar]
- 10. Lechan R. M., Fekete C. (2006) Peptides 27, 310–325 [DOI] [PubMed] [Google Scholar]
- 11. Valassi E., Scacchi M., Cavagnini F. (2008) Nutr. Metab. Cardiovasc. Dis. 18, 158–168 [DOI] [PubMed] [Google Scholar]
- 12. Balthasar N., Dalgaard L. T., Lee C. E., Yu J., Funahashi H., Williams T., Ferreira M., Tang V., McGovern R. A., Kenny C. D., Christiansen L. M., Edelstein E., Choi B., Boss O., Aschkenasi C., Zhang C. Y., Mountjoy K., Kishi T., Elmquist J. K., Lowell B. B. (2005) Cell 123, 493–505 [DOI] [PubMed] [Google Scholar]
- 13. Holder J. L., Jr., Butte N. F., Zinn A. R. (2000) Hum. Mol. Genet. 9, 101–108 [DOI] [PubMed] [Google Scholar]
- 14. Kublaoui B. M., Gemelli T., Tolson K. P., Wang Y., Zinn A. R. (2008) Mol. Endocrinol. 22, 1723–1734 [DOI] [PMC free article] [PubMed] [Google Scholar]
- 15. Kublaoui B. M., Holder J. L., Jr., Gemelli T., Zinn A. R. (2006) Mol. Endocrinol. 20, 2483–2492 [DOI] [PubMed] [Google Scholar]
- 16. Michaud J. L., Boucher F., Melnyk A., Gauthier F., Goshu E., Lévy E., Mitchell G. A., Himms-Hagen J., Fan C. M. (2001) Hum. Mol. Genet. 10, 1465–1473 [DOI] [PubMed] [Google Scholar]
- 17. Yang C., Gagnon D., Vachon P., Tremblay A., Levy E., Massie B., Michaud J. L. (2006) J. Neurosci. 26, 7116–7120 [DOI] [PMC free article] [PubMed] [Google Scholar]
- 18. Lee E. J., Lee S. H., Jung J. W., Lee W., Kim B. J., Park K. W., Lim S. K., Yoon C. J., Baik J. H. (2001) Eur. J. Biochem. 268, 582–591 [DOI] [PubMed] [Google Scholar]
- 19. Haus-Seuffert P., Meisterernst M. (2000) Mol. Cell Biochem. 212, 5–9 [PubMed] [Google Scholar]
- 20. Johannessen M., Delghandi M. P., Moens U. (2004) Cell Signal 16, 1211–1227 [DOI] [PubMed] [Google Scholar]
- 21. Mayr B., Montminy M. (2001) Nat. Rev. Mol. Cell Biol. 2, 599–609 [DOI] [PubMed] [Google Scholar]
- 22. Sassone-Corsi P. (1998) Int. J. Biochem. Cell Biol. 30, 27–38 [DOI] [PubMed] [Google Scholar]
- 23. Czyzyk T. A., Sikorski M. A., Yang L., McKnight G. S. (2008) Proc. Natl. Acad. Sci. U.S.A. 105, 276–281 [DOI] [PMC free article] [PubMed] [Google Scholar]
- 24. Impey S., McCorkle S. R., Cha-Molstad H., Dwyer J. M., Yochum G. S., Boss J. M., McWeeney S., Dunn J. J., Mandel G., Goodman R. H. (2004) Cell 119, 1041–1054 [DOI] [PubMed] [Google Scholar]
- 25. Lonze B. E., Ginty D. D. (2002) Neuron 35, 605–623 [DOI] [PubMed] [Google Scholar]
- 26. Bleckmann S. C., Blendy J. A., Rudolph D., Monaghan A. P., Schmid W., Schütz G. (2002) Mol. Cell. Biol. 22, 1919–1925 [DOI] [PMC free article] [PubMed] [Google Scholar]
- 27. Blendy J. A., Kaestner K. H., Schmid W., Gass P., Schutz G. (1996) EMBO J. 15, 1098–1106 [PMC free article] [PubMed] [Google Scholar]
- 28. Mantamadiotis T., Lemberger T., Bleckmann S. C., Kern H., Kretz O., Martin Villalba A., Tronche F., Kellendonk C., Gau D., Kapfhammer J., Otto C., Schmid W., Schütz G. (2002) Nat. Genet. 31, 47–54 [DOI] [PubMed] [Google Scholar]
- 29. Parlato R., Otto C., Begus Y., Stotz S., Schütz G. (2007) Development 134, 1663–1670 [DOI] [PubMed] [Google Scholar]
- 30. Parlato R., Rieker C., Turiault M., Tronche F., Schütz G. (2006) Genesis 44, 454–464 [DOI] [PubMed] [Google Scholar]
- 31. Ruppert S., Cole T. J., Boshart M., Schmid E., Schütz G. (1992) EMBO J. 11, 1503–1512 [DOI] [PMC free article] [PubMed] [Google Scholar]
- 32. Conkright M. D., Canettieri G., Screaton R., Guzman E., Miraglia L., Hogenesch J. B., Montminy M. (2003) Mol. Cell 12, 413–423 [DOI] [PubMed] [Google Scholar]
- 33. Lerner R. G., Depatie C., Rutter G. A., Screaton R. A., Balthasar N. (2009) EMBO Rep. 10, 1175–1181 [DOI] [PMC free article] [PubMed] [Google Scholar]
- 34. Altarejos J. Y., Goebel N., Conkright M. D., Inoue H., Xie J., Arias C. M., Sawchenko P. E., Montminy M. (2008) Nat. Med. 14, 1112–1117 [DOI] [PMC free article] [PubMed] [Google Scholar]
- 35. Harris M., Aschkenasi C., Elias C. F., Chandrankunnel A., Nillni E. A., Bjøorbaek C., Elmquist J. K., Flier J. S., Hollenberg A. N. (2001) J. Clin. Invest. 107, 111–120 [DOI] [PMC free article] [PubMed] [Google Scholar]
- 36. Selkirk J. V., Nottebaum L. M., Ford I. C., Santos M., Malany S., Foster A. C., Lechner S. M. (2006) J. Biomol. Screen 11, 351–358 [DOI] [PubMed] [Google Scholar]
- 37. Sarkar S., Légrádi G., Lechan R. M. (2002) Brain Res. 945, 50–59 [DOI] [PubMed] [Google Scholar]
- 38. Mantamadiotis T., Kretz O., Ridder S., Bleckmann S. C., Bock D., Gröne H. J., Malaterre J., Dworkin S., Ramsay R. G., Schütz G. (2006) Mol. Endocrinol. 20, 204–211 [DOI] [PubMed] [Google Scholar]
- 39. Sugrue M. L., Vella K. R., Morales C., Lopez M. E., Hollenberg A. N. (2009) Endocrinology 151, 793–801 [DOI] [PMC free article] [PubMed] [Google Scholar]
- 40. Gross D. S., Rothfeld J. M. (1985) J. Histochem. Cytochem. 33, 11–20 [DOI] [PubMed] [Google Scholar]
- 41. Itoi K., Jiang Y. Q., Iwasaki Y., Watson S. J. (2004) J. Neuroendocrinol. 16, 348–355 [DOI] [PubMed] [Google Scholar]
- 42. Kiss J. Z., Mezey E., Skirboll L. (1984) Proc. Natl. Acad. Sci. U.S.A. 81, 1854–1858 [DOI] [PMC free article] [PubMed] [Google Scholar]
- 43. Kovács K. J., Sawchenko P. E. (1996) J. Neurosci. 16, 262–273 [DOI] [PMC free article] [PubMed] [Google Scholar]
- 44. Kublaoui B. M., Holder J. L., Jr., Tolson K. P., Gemelli T., Zinn A. R. (2006) Endocrinology 147, 4542–4549 [DOI] [PubMed] [Google Scholar]
- 45. Vella K. R., Burnside A. S., Brennan K. M., Good D. J. (2007) J. Neuroendocrinol. 19, 499–510 [DOI] [PMC free article] [PubMed] [Google Scholar]
- 46. Benoit S. C., Schwartz M. W., Lachey J. L., Hagan M. M., Rushing P. A., Blake K. A., Yagaloff K. A., Kurylko G., Franco L., Danhoo W., Seeley R. J. (2000) J. Neurosci. 20, 3442–3448 [DOI] [PMC free article] [PubMed] [Google Scholar]
- 47. Segal-Lieberman G., Bradley R. L., Kokkotou E., Carlson M., Trombly D. J., Wang X., Bates S., Myers M. G., Jr., Flier J. S., Maratos-Flier E. (2003) Proc. Natl. Acad. Sci. U.S.A. 100, 10085–10090 [DOI] [PMC free article] [PubMed] [Google Scholar]
- 48. Christoffolete M. A., Linardi C. C., de Jesus L., Ebina K. N., Carvalho S. D., Ribeiro M. O., Rabelo R., Curcio C., Martins L., Kimura E. T., Bianco A. C. (2004) Diabetes 53, 577–584 [DOI] [PubMed] [Google Scholar]
- 49. Iwasaki Y., Oiso Y., Saito H., Majzoub J. A. (1997) Endocrinology 138, 5266–5274 [DOI] [PubMed] [Google Scholar]
- 50. Cha-Molstad H., Keller D. M., Yochum G. S., Impey S., Goodman R. H. (2004) Proc. Natl. Acad. Sci. U.S.A. 101, 13572–13577 [DOI] [PMC free article] [PubMed] [Google Scholar]
- 51. Lechan R. M., Fekete C. (2006) Prog. Brain Res. 153, 209–235 [DOI] [PubMed] [Google Scholar]
- 52. Nieuwenhuizen A. G., Rutters F. (2008) Physiol. Behav. 94, 169–177 [DOI] [PubMed] [Google Scholar]
- 53. Duan J., Choi Y. H., Hartzell D., Della-Fera M. A., Hamrick M., Baile C. A. (2007) Obesity 15, 2624–2633 [DOI] [PubMed] [Google Scholar]
- 54. Hummler E., Cole T. J., Blendy J. A., Ganss R., Aguzzi A., Schmid W., Beermann F., Schütz G. (1994) Proc. Natl. Acad. Sci. U.S.A. 91, 5647–5651 [DOI] [PMC free article] [PubMed] [Google Scholar]
- 55. Chen M., Wang J., Dickerson K. E., Kelleher J., Xie T., Gupta D., Lai E. W., Pacak K., Gavrilova O., Weinstein L. S. (2009) Cell Metab. 9, 548–555 [DOI] [PMC free article] [PubMed] [Google Scholar]
- 56. Xie T., Chen M., Gavrilova O., Lai E. W., Liu J., Weinstein L. S. (2008) Endocrinology 149, 2443–2450 [DOI] [PMC free article] [PubMed] [Google Scholar]
- 57. Daniels D., Patten C. S., Roth J. D., Yee D. K., Fluharty S. J. (2003) Brain Res. 986, 1–11 [DOI] [PubMed] [Google Scholar]
- 58. Kawasaki H., Springett G. M., Mochizuki N., Toki S., Nakaya M., Matsuda M., Housman D. E., Graybiel A. M. (1998) Science 282, 2275–2279 [DOI] [PubMed] [Google Scholar]
- 59. Patten C. S., Daniels D., Suzuki A., Fluharty S. J., Yee D. K. (2007) Regul. Pept. 142, 111–122 [DOI] [PubMed] [Google Scholar]
- 60. Voss-Andreae A., Murphy J. G., Ellacott K. L., Stuart R. C., Nillni E. A., Cone R. D., Fan W. (2007) Endocrinology 148, 1550–1560 [DOI] [PubMed] [Google Scholar]
- 61. Fan W., Voss-Andreae A., Cao W. H., Morrison S. F. (2005) Peptides 26, 1800–1813 [DOI] [PubMed] [Google Scholar]
- 62. Duplan S. M., Boucher F., Alexandrov L., Michaud J. L. (2009) Eur. J. Neurosci. 30, 2239–2249 [DOI] [PubMed] [Google Scholar]
- 63. Saper C. B., Loewy A. D., Swanson L. W., Cowan W. M. (1976) Brain Res. 117, 305–312 [DOI] [PubMed] [Google Scholar]
- 64. Sawchenko P. E. (1998) J. Comp. Neurol. 402, 435–441 [PubMed] [Google Scholar]
- 65. Sawchenko P. E., Swanson L. W. (1982) Brain Res. 257, 275–325 [DOI] [PubMed] [Google Scholar]
- 66. Swanson L. W., Kuypers H. G. (1980) J. Comp. Neurol. 194, 555–570 [DOI] [PubMed] [Google Scholar]
- 67. Kuwahara S., Arima H., Banno R., Sato I., Kondo N., Oiso Y. (2003) J. Neurosci. 23, 10231–10237 [DOI] [PMC free article] [PubMed] [Google Scholar]
- 68. Caldwell H. K., Lee H. J., Macbeth A. H., Young W. S., 3rd (2008) Prog. Neurobiol. 84, 1–24 [DOI] [PMC free article] [PubMed] [Google Scholar]
Associated Data
This section collects any data citations, data availability statements, or supplementary materials included in this article.