

Abstract
Better drugs are urgently needed for the treatment of African sleeping sickness. We tested a series of promising anticancer agents belonging to the 4-substituted 4-hydroxycyclohexa-2,5-dienones class (“quinols”) and identified several with potent trypanocidal activity (EC50 < 100 nm). In mammalian cells, quinols are proposed to inhibit the thioredoxin/thioredoxin reductase system, which is absent from trypanosomes. Studies with the prototypical 4-benzothiazole-substituted quinol, PMX464, established that PMX464 is rapidly cytocidal, similar to the arsenical drug, melarsen oxide. Cell lysis by PMX464 was accelerated by addition of sublethal concentrations of glucose oxidase implicating oxidant defenses in the mechanism of action. Whole cells treated with PMX464 showed a loss of trypanothione (T(SH)2), a unique dithiol in trypanosomes, and tryparedoxin peroxidase (TryP), a 2-Cys peroxiredoxin similar to mammalian thioredoxin peroxidase. Enzyme assays revealed that T(SH)2, TryP, and a glutathione peroxidase-like tryparedoxin-dependent peroxidase were inhibited in time- and concentration-dependent manners. The inhibitory activities of various quinol analogues against these targets showed a good correlation with growth inhibition of Trypanosoma brucei. The monothiols glutathione and l-cysteine bound in a 2:1 ratio with PMX464 with Kd values of 6 and 27 μm, respectively, whereas T(SH)2 bound more tightly in a 1:1 ratio with a Kd value of 430 nm. Overexpression of trypanothione synthetase in T. brucei decreased sensitivity to PMX464 indicating that the key metabolite T(SH)2 is a target for quinols. Thus, the quinol pharmacophore represents a novel lead structure for the development of a new drug against African sleeping sickness.
Keywords: Drug Action, Metabolism, Peroxidase, Thiol, Trypanosome, Quinol, Trypanothione, Tryparedoxin Peroxidase
Introduction
Human African trypanosomiasis, or sleeping sickness, is caused by the protozoan parasites Trypanosoma brucei gambiense and T. brucei rhodesiense. This vector-born disease is transmitted by the tsetse fly in sub-Saharan Africa with an estimated incidence of 70,000–80,000 cases and ∼30,000 deaths per annum (1). Once the infection has spread to the central nervous system, the disease is invariably fatal without treatment. The drugs in use for late stage disease (melarsoprol and eflornithine) are toxic or difficult to administer (2) and treatment failures, possibly due to parasite resistance, are increasing (3, 4). New drugs are urgently needed.
One unique metabolic feature of these parasites involves trypanothione (N1,N8-bis(glutathionyl)spermidine), a dithiol that plays a pivotal role in thiol-redox metabolism (5–7). Trypanothione (T(SH)2)4 has replaced many of the functions of glutathione in other organisms and, together with trypanothione reductase (TryR) and tryparedoxin (TryX), subsumes the role of thioredoxin reductase and thioredoxin in mammalian systems in providing reducing equivalents for ribonucleotide reductase (8). Trypanothione is the physiologically relevant source of reducing equivalents for the antioxidant defense systems of the parasite (9–11). All of its components are well characterized and involve the following electron cascade: NADPH, TryR (12, 13), T(SH)2 (6), TryX (14, 15), and two types of tryparedoxin-dependent peroxidases: the 2-Cys peroxiredoxins (TryP) (15–18) and the glutathione peroxidase-like proteins (TDPX) (19–22). These pathways are crucial for the survival of the parasites, as shown by the essentiality of all the above components (13, 22–24). Furthermore, T(SH)2 and TryR are possible targets for arsenical (25, 26) and antimonial drugs (27, 28) currently used to treat human African trypanosomiasis and leishmaniasis, respectively.
Recently, a new class of aromatic 4-substituted 4-hydroxycyclohexa-2,5-dienones (“quinols”), including the 4-benzothiazole-substituted quinol (PMX464), were found to have potent growth inhibitory activity against colon, renal, and certain breast cancer cell lines (29, 30), as well as anti-proliferative activity against human umbilical vein endothelial cells (31). Although the precise molecular mechanism of these promising antitumor agents remains elusive, thioredoxin (29) and thioredoxin reductase (32) have been proposed as possible targets. Like trivalent arsenical and antimonial drugs, quinols are thiol-reactive compounds that have been proposed to bind to vicinal protein dithiols, such as those found in thioredoxin, via an essentially irreversible, double Michael-addition reaction (29, 32). Others have suggested that quinols preferentially target mammalian thioredoxin reductase instead of thioredoxin via addition to the C-terminal selenocysteine residue involved in reduction of thioredoxin disulfide (32).
Given the unique and essential features of thiol metabolism in T. brucei and the proposed mode of action of quinols against cancer cells, we have found that PMX464 and analogues are also potent and moderately selective trypanocidal agents in vitro. Here we have investigated the mechanism of cytotoxicity in detail and provide evidence that T(SH)2 and TryP are primary molecular targets for these experimental compounds. The quinol pharmacophore could be a valuable lead structure for the development of a new drug against African sleeping sickness.
EXPERIMENTAL PROCEDURES
Materials
All chemicals were of the highest grade available from Sigma or BDH Chemicals. Ltd. (Poole, UK). Quinol compounds 1–7 were kindly provided by Pharminox Ltd., Biocity, Nottingham, UK. Stock solutions (10 mm) were prepared in dimethyl sulfoxide (DMSO) and stored for short term at 4 °C and for longer terms at −20 °C. Antiserum against T. brucei variant surface glycoprotein 221 (VSG221) was kindly provided by Lucia Guther (College of Life Sciences, Dundee, UK) and recombinant T. brucei TryR by Magnus Alphey (College of Life Sciences, Dundee, UK).
Cell Culture and Cell Potency Assays
Bloodstream T. brucei S427 were cultured at 37 °C in modified HMI9 medium (56 μm thioglycerol was substituted for 200 μm 2-mercaptoethanol) (33). MRC-5 cells were maintained in DMEM containing 10% fetal calf serum. Trypanosomes overexpressing trypanothione synthetase (34) were cultured in an identical manner. Effective concentrations of test compounds inhibiting growth by 50% (EC50) against parasites and MRC-5 cells were determined in 96-well plates using a modification of the Alamar Blue cell viability assay (35).
Viability Studies
Mid-log trypanosomes were diluted to 1 × 10⁶ cells ml−1 in pre-warmed medium containing ∼5 times the EC50 for melarsen oxide (50 nm) and PMX464 (500 nm) or DMSO (0.1%) as a control. Aliquots were taken at different time points and parasite density was determined using a CASY Cell Counter (Schärfe Systems, Reutlingen, Germany). In addition, the number of motile parasites was determined microscopically using a Neubauer hemocytometer. Studies examining potential synergistic effects between PMX464 and the H2O2 generator glucose oxidase (from Aspergillus niger, Fluka) were carried out in an identical manner with mid-log trypanosomes incubated with either PMX464 (500 nm), 0.1 milliunits ml−1 glucose oxidase, or a combination of both.
Immunoblotting
Exponentially growing T. brucei (1 × 10⁶ cells ml−1) were treated with varying concentrations of PMX464 (0 to 300 nm) and cultured for 16 h. Parasites were pelleted (800 × g for 10 min) and washed twice by resuspension in 5 mm KCl, 80 mm NaCl, 1 mm MgSO4, 20 mm Na2HPO4, 2 mm NaH2PO4, 20 mm glucose, pH 7.4, and centrifugation as above. Whole cell lysates were prepared by resuspension of cell pellets in 50 mm Tris, pH 7.4, 9 m urea, and 0.1% Triton-X-100 followed by heating at 95 °C for 5 min. Protein concentrations were determined by the Bradford protein assay (Bio-Rad) using BSA as standard. Protein samples (20 μg/lane) were separated by SDS-PAGE (12% NuPAGE, Invitrogen) and analyzed by Western blotting (36) using rat antiserum specific for TbTDPX2, TbTryX, LmTryP1, TbTryR, and TbVSG221.
Analysis of Intracellular Thiols
To determine the effect of PMX464 on intracellular thiol levels, exponentially growing cultures containing 1 × 10⁶ cells ml−1 were incubated with 250 nm PMX464 for 16 h. Cells (1 × 10⁸) were collected by centrifugation (800 × g, 10 min, 4 °C), washed once in ice-cold PSG buffer (phosphate-buffered saline, pH 8.0, 1.5% (w/v) glucose, and 0.5 mg ml−1 BSA) and cell pellets were derivatized with monobromobimane (6, 37). Acid-soluble thiols were separated by ion-paired, reverse-phase HPLC on an ion-paired Ultrasphere C18 column using a Dionex Ultimate 3000 instrument fitted with a Dionex RF-2000 fluorometer.
Expression and Purification of Recombinant Proteins
Recombinant TbTDPX2 (19) and TbTryP (15) were expressed and purified as described previously. TbTryX, cloned into pET-15b (15) and transformed into BL21(DE3) pLysS, was expressed using the autoinduction system (38). Briefly, autoinduction medium (1 liter) was inoculated with a 10-ml overnight culture (LB medium) and grown at 37 °C until the A595 nm reached 0.6, followed by a 72-h incubation at 22 °C. TbTryX was purified essentially as published for LmTryX (36).
Inhibition Assays
The effects of PMX464 on components of the T. brucei antioxidant defense system were analyzed in vitro using standard TDPX or TryP peroxidase assays. NADPH consumption was determined at 25 °C in a final volume of 200 μl essentially as described previously (19, 36). The standard assay mixture contained 100 mm Tris-HCl, pH 7.6, 5 mm EDTA, 170 μm NADPH, 1 unit ml−1 TbTryR, 20 μm T(S)2, 5 μm TryX and either 0.25 μm TDPX or 0.25 μm TryP. PMX464 (100 μm) was preincubated with the assay mixture before the reaction was initiated with 300 μm cumene hydroperoxide (for TDPX) or 150 μm H2O2 (for TryP). The final DMSO concentration in all assays was 1%.
To determine the sensitivity of individual components of the peroxidase systems to quinols, the concentrations of T(S)2, TDPX, or TryP were varied in the assay to obtain conditions under which NADPH consumption was proportional to only one of these components. For analysis of TDPX as the rate-limiting component, the assay contained 0.25 μm TbTDPX2 and a trace amount of T(S)2 (0.2 μm to reduce the TryX and TDPX). This mixture was preincubated for different times with various concentrations of quinol before the reaction was initiated with 300 μm cumene hydroperoxide plus 20 μm T(S)2. Similarly, for TryP, the assay contained 0.25 μm TbTryP and 0.2 μm T(S)2 and the reaction was initiated with 150 μm H2O2 and 20 μm T(S)2. For assays that were rate-limiting for T(SH)2, the final concentration of T(S)2 was 1 μm and the reaction was initiated with 300 μm cumene hydroperoxide plus 2 μm TbTDPX2. The initial rate of NADPH consumption was followed by the decrease of absorbance at 340 nm using a UV-visible Shimadzu spectrophotometer. In this way only one assay component (TDPX, TryP, or T(SH)2) was inhibited by the quinol due to the slow-binding behavior of these inhibitors.
The inhibitory concentration causing 50% inhibition (IC50) of compounds 1–7 were determined in a similar manner using a 96-well plate format at 27 °C monitoring NADPH consumption at 340 nm using a SPECTRAmax 340PC plate reader and SoftMax Pro software. The residual activities were calculated as a percentage of the DMSO-treated control assay. Analyses of IC50 values were performed using the standard rate-limiting peroxidase assays. PMX464 was diluted in DMSO, through a 10-point, doubling dilution curve with 100 μm as the highest compound concentration. The components of the assays for T(SH)2, TDPX, and TryP inhibition analysis were preincubated with varied amounts of PMX464 for 30 or 90 min and the initial rates were determined. Initial rates were corrected for background before fitting to an equation describing a two parameter fit,
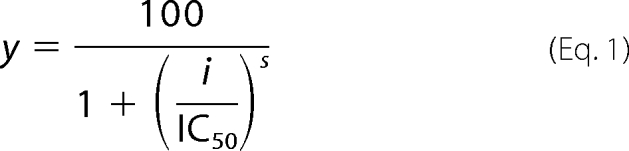 |
where y is the percentage inhibition for any inhibitor concentration, i, and s is the Hill slope.
Mass Spectrometry Analysis
Mixtures containing 50 mm Tris-HCl, pH 7.6, 5 mm EDTA, 200 μm NADPH, 10 μm TbTryR, 10 μm T(S)2, 10 μm TbTryX, and 10 μm TbTDPX were incubated for 1 h at room temperature with 100 μm PMX464 or 1% DMSO as control. Adduct formation was analyzed using matrix-assisted laser desorption/ionization time-of-flight mass spectrometry (MALDI-TOF MS) by the Mass Fingerprinting Service Dundee (University of Dundee, Dundee, UK).
Complex Formation of Low Molecular Mass Thiols with PMX464
The reaction of PMX464 with thiols was determined spectrophotometrically (UV-visible Shimadzu spectrophotometer) by monitoring the decrease in absorbance at 302.5 nm relative to background absorbance at 400 nm. Sequential spectra were obtained to establish the time taken to reach equilibrium for each thiol. PMX464 (100 μm) was then incubated with varying concentrations of T(SH)2 (0–250 μm), l-cysteine (0–1500 μm), or GSH (0–1000 μm) in a volume of 200 μl of 100 mm Tris-HCl, pH 7.6, 5 mm EDTA at 25 °C for 1.5, 2, or 4 h, respectively, and the net differential absorbance relative to zero time was calculated. These corrected data were plotted against the total thiol concentration and linear regression of the lower and higher data used to provide the tangent and asymptote, respectively. The ratio of thiol binding to PMX464 and thiol capacity was determined from the intersection point of these two linear fits. Bound thiol concentration ([L]b) was calculated using the δ extinction coefficients (2.68, 1.32, and 1.45 mm−1 cm−1 for T(SH)2, l-cysteine, and GSH, respectively) and data were fitted by non-linear regression using GraFit 5.0.13 to the following ligand binding equation,
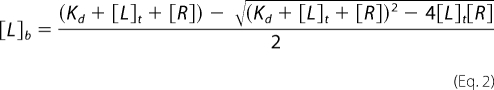 |
where [L]t is the total ligand (RSH) concentration and [R] is the receptor (PMX464) concentration.
For kinetic analyses of complex formation, 40, 60, 80, 100, 120, and 140 μm T(SH)2, l-cysteine, or GSH were mixed in an equimolar ratio with PMX464 in a volume of 200 μl at 25 °C. The initial rates of differential absorbance were determined as above and the rate of complex formation (R) was calculated using the δ absorption coefficient of 1,400 m−1 cm−1 per bound thiol. The initial rate R of the reaction: mA + nB → products, is given by,
where m is the order with respect to A, n is the order with respect to B, and m + n is the overall order. When [A] = [B] this simplifies to Equation 4.
Dissociation kinetics for PMX464-thiol complexes were determined by measuring the initial rate of thiol release using 5,5′-dithiobis(2-nitrobenzoic acid) (DTNB). Reactions were initiated by addition of 500 μm DTNB (final concentration) to a 1:1 mixture of 40, 60, 80, 100, 120, and 140 μm T(SH)2, l-cysteine, or GSH and PMX464 in equilibrium. The initial rate of release of free thiol groups was determined using ϵ412 nm = 13,600 m−1 cm−1 (39).
RESULTS
Quinols Are Potent Cytotoxic Inhibitors of T. brucei
Heteroaromatic 4-substituted 4-hydroxycyclohexa-2,5-dienone compounds (“quinols”) have been reported to be promising antitumor agents (29, 40–43). To study the effect of the quinol pharmacophore on T. brucei we selected a series of six different quinol compounds (1–6) (see Table 1 for structures). A derivative of compound 1 lacking the quinol pharmacophore was chosen as a control (7). Bloodstream forms of T. brucei parasites and MRC5 normal human fibroblasts were treated with varying concentrations of 1–7 and EC50 values were determined (Table 1). Quinol analogues 1–6 all displayed submicromolar potencies against T. brucei, with compounds 1, 4, and 5 having EC50 values ≤100 nm. Compound 7, which lacks the 4-hydroxycyclohexa-2,5-dienone pharmacophore, was inactive. Analogues 1–6 were also active against MRC5 cells, revealing a narrow window of selectivity of only 2–3-fold for the parasites. However, due to the steeper growth inhibition effects on T. brucei (the Hill slope), selectivity of 1–6 increases to between 4- and 7-fold at the EC90. The least active quinols against both cell types were 2 and 6, where in 2 the hydroxyl group of PMX464 was replaced by an O-methyl and in 6 the benzothiazole substituent in 1 was replaced by a phenyl group.
TABLE 1.
Cell viability assays and the effects of quinol analogues on trypanothione-dependent peroxidase systems

a Trypanosomes and MRC-5 cells were incubated for 69 h with varied amounts of 1–7 followed by addition of resazurin for 4 h as described under “Experimental Procedures.” The EC50 values are the mean of n independent determination with 95% confidence intervals given in parentheses.
b Details of the rate-limiting peroxidase assays for T(SH)2, TDPX, or TRYP are described under “Experimental Procedures.” Mixtures were preincubated for 30 min with 30 μm quinol compounds 1–7 before the reactions were started with the appropriate substrate. All values are the mean ± S.D. of triplicate measurements.
c The selectivity index (SI) is the ratio of EC50 values for MRC5 and T. brucei cells.
Previous studies have reported that various quinol analogues exhibit similar effects on growth of mammalian cells and on inhibition of thioredoxin reductase activity, independent of the substituent (29, 41, 42). Therefore, we chose to evaluate the mechanism of anti-trypanosomal activity in detail using the well studied benzothiazole-substituted quinol (1), named AW464 or PMX464 in previous publications (44). First, we analyzed the growth of T. brucei parasites as a function of time following treatment with a concentration of PMX464 equivalent to ∼5 × EC50 (Fig. 1A). After only 4 h exposure, the parasites ceased growing and started to die thereafter, such that no motile parasites could be detected after 10 h. Thiol analysis after the 4-h exposure to PMX464 showed a marked reduction in the T(SH)2 content and no significant change in GSH content (Fig. 2B). Trypanosomes, incubated with ∼5 times the EC50 values of melarsen oxide, started to die after 6 h in a similar manner to PMX464-treated parasites. Therefore, PMX464 shows the same rapid trypanocidal activity as this arsenical drug (25, 26). Significantly, the addition of the H2O2 generator glucose oxidase at non-trypanocidal levels was found to accelerate the lytic effect of PMX464 (Fig. 1B). The apparent synergy of PMX464 and H2O2 against bloodstream trypanosomes suggests that this quinol may specifically target the antioxidant defenses of these parasites.
FIGURE 1.

Growth curve analysis of PMX464-treated T. brucei. A, the cytocidal effects of PMX464 and melarsen oxide on bloodstream trypanosomes. Compounds were added at the defined concentrations to T. brucei parasites at a cell density of ∼1 × 10⁶ ml−1. Open circle, control cells with no inhibitor; filled circle, melarsen oxide, 50 nm; open square, PMX464, 500 nm. At different time points the cell number was determined, as described under “Experimental Procedures.” Data are the mean ± S.D. of three experiments. B, synergistic effects of PMX464 and the H2O2-producer glucose oxidase. As described above, compounds were added to bloodstream trypanosomes at a cell density of ∼1 × 10⁶ ml−1 and cell numbers were determined at defined intervals. Open circle, control cells with no inhibitor; filled circle, glucose oxidase, 0.1 milliunits ml−1; open square, PMX464, 500 nm; closed square, PMX464 (500 nm) and glucose oxidase (0.1 milliunits ml−1). Data are representative of two independent experiments.
FIGURE 2.

Effect of PMX464 on the thiol-dependent antioxidant system in T. brucei. A, effect on antioxidant proteins. Mid-log trypansomes were incubated for 16 h with varying concentrations of PMX464 and samples were separated by SDS-PAGE (20 μg of protein/lane). TryR, TryX, TDPX, and TryP and the internal loading control, VSG, were detected by immunoblotting using specific antiserum against each protein. B, effect on thiol levels. T. brucei parasites were incubated with either 500 or 250 nm PMX464 for 4 or 16 h, respectively, and the concentration of GSH and T(SH)2 determined by HPLC. White bars, GSH; gray bars, T(SH)2. The results are the mean ± S.D. of three experiments, expressed as a percentage of the thiol content of untreated cells. An asterisk indicates a significant difference compared with untreated cells (p < 0.01, Student's t test).
Effect of PMX464 on Thiols and TryP in Whole Trypanosomes
Various studies have established that quinols inhibit the thioredoxin reductase/thioredoxin system in mammalian cells (29, 31, 32) and increase cellular glutathione content (41). This prompted us to analyze the effects of PMX464 on T. brucei thiol metabolism, particularly with respect to its role in metabolizing peroxides. The trypanothione peroxidase system comprises the following cascade: NADPH, TryR, T(SH)2, and TryX with one of the two types of tryparedoxin-dependent peroxidases, TryP and TDPX, as final electron acceptor (15, 19). The effect on these proteins in PMX464-treated parasites was analyzed by Western blotting with specific antisera (Fig. 2A). Although the cellular content of TryR, TryX, and TDPX was not significantly altered in treated cells compared with the VSG control, the TryP band decreased in a dose-dependent manner, indicating that TryP is depleted by PMX464 treatment. Glutathione and trypanothione contents in parasites treated with 250 nm PMX464 for 16 h were analyzed by HPLC following derivatization with monobromobimane (Fig. 2B). In comparison to untreated cells, the intracellular trypanothione levels were decreased by 30%, whereas the glutathione concentration was up-regulated by about 30%.
To confirm that T(SH)2 is a target for quinols, cells overexpressing trypanothione synthetase and thus maintaining elevated levels of intracellular T(SH)2 were tested for their sensitivity to PMX464 (Fig. 3). These transgenic parasites yielded an EC50 value of 77.2 ± 3.2 nm, 1.9-fold higher than the value for wild type cells (41.2 ± 2.3 nm). This fold-shift in sensitivity correlates well with the 2.5-fold increase in T(SH)2 levels previously reported in these cells (34). These results demonstrate that PMX464 perturbs T(SH)2 metabolism prior to cell death.
FIGURE 3.

EC50 values were determined for PMX464 against WT (open circles) and TRYS-overexpressing (closed circles) bloodstream trypanosomes. The curves are the non-linear fits of data using a two-parameter EC50 equation provided by GraFit (see “Experimental Procedures”). EC50 values of 41.2 ± 2.3 and 77.4 ± 2.1 nm were determined for WT and TRYS-overexpressing cell lines, respectively. Data are the mean of duplicate measurements.
Trypanothione, TDPX, and TryP Are Molecular Targets of PMX464
A more detailed analysis of PMX464 inhibition of these putative molecular targets was carried out in vitro. First, PMX464 was tested in the standard TDPX and TryP peroxidase assays. Oxidation of NADPH by hydroperoxides was monitored spectrophotometrically at 340 nm. Addition of cumene hydroperoxide to the standard TDPX peroxidase assay containing all components resulted in linear oxidation of NADPH for the first 400 s (Fig. 4A, open circles). In contrast, addition of PMX464 at the same time as cumene hydroperoxide to initiate the reaction resulted in a reaction curve typical for a slow binding inhibitor (open triangles). Preincubation of the reduced assay components with PMX464 for 10 min prior to initiation with cumene hydroperoxide abolished the peroxidase activity completely (closed circles). This trace is identical to the one displaying the background rate containing no TDPX (open squares). Preincubation of PMX464 with the oxidized assay components, followed by initiation with NADPH, resulted in a similar reaction trace to the one where PMX464 is added directly at the start of the reaction (closed squares). The latter finding suggests that PMX464 only reacts with free thiols, but not with disulfides, in the assay mixture. The inhibitory behavior of PMX464 was similar in the TryP peroxidase assay (not shown).
FIGURE 4.

PMX464 inhibition of TDPX. The standard TDPX peroxidase assay mixture contains NADPH, TryR, T(S)2, TryX, and TDPX. The peroxidase reaction was initiated with cumene hydroperoxide (t = 0 min) until otherwise stated. Activity was monitored by following NADPH consumption at 340 nm. PMX464 was added at 100 μm as indicated. A, open circles, standard peroxidase assay mixture, no inhibitor; closed circles, assay mixture minus TDPX, no inhibitor; open triangles, PMX464 added at zero time together with cumene hydroperoxide to the assay mixture; open squares, assay mixture preincubation with PMX464 for 10 min; closed squares, assay mixture minus NADPH was treated for 5 min with cumene hydroperoxide followed by preincubation with PMX464 for 10 min and the reaction was started with NADPH. B, identification of the molecular targets of PMX464 in peroxidase assays containing 0.5 μm TDPX. Trace a, assay mixture preincubated for 30 min without inhibitor; traces b-f, assay components preincubated for 30 min with PMX464. The last minute of the preincubation time is shown before 300 μm cumene hydroperoxide was added at zero time. After 2, 4, or 6 min additional aliquots of 5 μm TryX, 20 μm T(S)2, or 0.5 μm TDPX were added in different orders. C, MALDI analysis of a mixture of the electron cascade components: NADPH (200 μm) and TryR, T(S)2, TryX, and TDPX (10 μm, respectively): left panel, control 1% DMSO; right panel, plus 100 μm PMX464 in 1% DMSO. MALDI analysis was performed after a 1-h incubation at room temperature.
It should be noted that continuous cycling between dithiol and disulfide forms of TryR, TryX, T(SH)2, TDPX, and TryP are required for transfer of electrons from NADPH donor substrate to peroxide acceptor substrate. To dissect which of these components might be the molecular target of PMX464, we exploited the fact that PMX464 is a slow binding inhibitor that takes several minutes to abolish peroxidase activity. Thus, further addition of any component that is inhibited in the assay mixture by PMX464 should restore the oxidation of NADPH by cumene hydroperoxide. The rate of peroxide reduction using the standard TDPX peroxidase assay containing no inhibitor is illustrated in trace a (Fig. 4B). To identify the molecular targets in the TDPX peroxidase assay, all assay components except for cumene hydroperoxide were preincubated with PMX464 for 30 min, so that no peroxidase activity was detected after addition of the hydroperoxide at zero time (Fig. 4B, traces b-g). After 2, 4, and 6 min, additional T(S)2, TDPX, and TryX were added in different orders to the inhibited assay mixtures. After addition of 20 μm trypanothione disulfide T(S)2 (trace b) the rapid and stoichiometric consumption of NADPH (about 0.12 absorbance units; 19 μm) was observed due to the reduction of T(S)2 to T(SH)2. This shows that TryR is not inhibited by PMX464. Moreover, the stoichiometry indicates that further reduction of cumene hydroperoxide does not occur. Only following further addition of TDPX to the reaction mixture in trace b was activity restored. However, addition of TDPX alone to the inhibited assay mixture was not sufficient for the reduction of the hydroperoxide (trace c), which also required the addition of T(S)2. In contrast, further addition of TryX either alone or in combination with TDPX or T(S)2 did not enhance activity (d–g). These results suggest that trypanothione and TDPX are the molecular targets for PMX464, but not TryR or TryX. TryP is inhibited in a similar manner to that of TDPX in the TryP peroxidase assay (data not shown).
Inhibition of TDPX by PMX464 is supported by MALDI-TOF MS studies (Fig. 4C). The TDPX peroxidase assay components (NADPH, TryR, T(S)2, TryX, and TDPX) were incubated with PMX464 (or 1% DMSO as control) for 30 min before analysis. Peaks corresponding to His6-TryX (theoretical mass: 18,054 Da) and TDPX (theoretical mass: 19,168 Da) were detected in the MALDI-TOF spectrum of the control sample. Following treatment with PMX464, the peak mass for TDPX was increased by 245 m/z in comparison to the untreated control with a corresponding loss of the peak at 19,153 Da. The molecular mass of PMX464 is 243, suggesting that 1 mol of PMX464 was bound per mole of TDPX. The signal for TryX did not show such a shift, in agreement with the conclusion from Fig. 4B that TryX is not inhibited by PMX464. TryR and TryP could not be detected by MALDI-TOF analysis probably due to their oligomeric structure in solution.
Specificity of Molecular Targets
The above experiments indicate that T(SH)2, TDPX, and TryP are the molecular targets of PMX464. To analyze the inhibition of each in more detail, the two peroxidase assays were optimized such that TDPX, TryP, or T(SH)2 was rate-limiting over a linear concentration range (data not shown). In the TDPX- and TryP-dependent assays, a trace amount of T(S)2 (0.2 μm) was included in the assay mixture, sufficient to allow reduction of the peroxidases before addition of quinol, but not enough for significant peroxidase activity. TryP- and TDPX-dependent reactions were initiated with T(S)2 (20 μm) and hydroperoxide. For assays where T(SH)2 (1 μm) was rate-limiting, the reaction was initiated with TDPX and hydroperoxide.
Time- and concentration-dependent inhibition by PMX464 in each of these rate-limiting reactions was analyzed by preincubation for different times prior to determining residual activity by addition of the appropriate substrates (Fig. 5, A–C). Residual activity was fitted to a first-order rate equation for each concentration of PMX464 to determine the observed rate constant of inactivation (kobs). The resulting rate constants were then plotted against the PMX464 concentration (Fig. 5D). For all three components, the values for kobs were directly proportional to the concentration of PMX464, indicating that the reactions were not saturable (i.e. Ki ≫ 100 μm). The enzymes TDPX and TryP showed similar inactivation rates, whereas substrate T(SH)2 was inactivated about 2.5-fold faster.
FIGURE 5.

Time- and concentration-dependent inhibition of T(SH)2, TryP, and TDPX by PMX464. The standard assay conditions, in which T(SH)2 (A), TryP (B), or TDPX (C) were limiting, are described under “Experimental Procedures.” Varied amounts of PMX464 were added to the standard reaction mixtures, respectively. Aliquots were removed at intervals and residual activities were determined. A, inhibition with limiting T(SH)2: open circles, no inhibitor; filled circles, 3.125 μm; open squares, 6.25 μm; filled squares, 12.5 μm; open triangles, 25 μm; filled triangles, 100 μm. Inhibition with limiting TryP (B) or TDPX (C): open circles, no inhibitor; closed circles, 6.25 μm; open squares, 12.5 μm; closed squares, 25 μm; open triangles, 50 μm; closed triangles, 100 μm. D, net kobs as a function of PMX464 concentration: open circles, T(SH)2; open triangles, TryP; inverted closed triangles, TDPX. Data points were fitted by linear regression.
IC50 values for T(SH)2, TDPX, and TryP were determined using the standard rate-limiting peroxidase assay conditions. The reaction mixtures were incubated with varying concentrations of PMX464, for either 30 or 90 min, before the residual peroxidase activity was determined. The calculated IC50 values are summarized in Table 2. TDPX and TryP displayed similar IC50 values of ∼15 μm, whereas T(SH)2 had a lower IC50 value of 5.8 μm after 30 min, decreasing to 1.8 μm after 90 min. The same standard assay conditions with T(SH)2, TDPX, or TryP as the rate-limiting component were used to examine the structure-activity relationship for the various quinol analogues 1–7. Inhibition was determined after a 30-min incubation with 30 μm 1–7 (Table 1). Control compound 7 did not exhibit an inhibitory activity in any of the assays showing the quinol pharmacophore is specifically responsible for the inhibitory activity. In all cases, the trypanothione-limited assays were more sensitive to inhibition by quinols than the TDPX- or TryP-limited assays with a good correlation between cell potency and inhibition of T(SH)2-limited peroxidase.
TABLE 2.
Inhibitory activity of PMX464 against T(SH)2, TDPX, and TryP
Residual activities were determined after 30 or 90 min preincubation with varying amounts of PMX464 in the rate-limiting assays for T(SH)2, TDPX, and TryP. The data represent the weighted mean ± S.E. of three independent experiments fitted by non-linear regression (Eq. 1).
| T(SH)2 |
TDPX |
TryP, 30 min | |||
|---|---|---|---|---|---|
| 30 min | 90 min | 30 min | 90 min | ||
| IC50 (μm) | 5.8 ± 0.3 | 1.8 ± 0.1 | 15.6 ± 1.3 | 6.0 ± 0.4 | 14.1 ± 0.8 |
| Hill slope | 1.6 ± 0.1 | 2.1 ± 0.2 | 1.5 ± 0.1 | 1.9 ± 0.2 | 1.4 ± 0.1 |
Affinity of PMX464 for Low Molecular Mass Thiols
Glutathione and trypanothione are the principal low molecular mass thiols in trypanosomes (6) and these parasites require high concentrations of l-cysteine (∼1.5 mm) for growth in vitro. These facts prompted us to analyze the interaction of T(SH)2, GSH, and l-cysteine with PMX464. For this purpose we exploited the observation that incubation with these thiols decreases the absorbance of PMX464 at 302.5 nm in a time- and concentration-dependent manner, with equilibrium of T(SH)2, l-cysteine, and GSH with PMX464 being attained after 1, 1½, and 3 h, respectively (data not shown). For quantitative analysis, 100 μm PMX464 was incubated with varying concentrations of each thiol and differential absorbance data were plotted against the thiol concentration. Representative results are shown for T(SH)2 and GSH (Fig. 6, A and B, insets). In all cases a similar maximum absorbance plateau was achieved with 5–10-fold excess thiol, yielding δ extinction coefficients of 2.68, 1.45, and 1.32 mm−1 cm−1 for T(SH)2, GSH, and cysteine, respectively. In the case of trypanothione, one molecule of the dithiol T(SH)2 bound to one quinol molecule (Fig. 6A, inset), whereas for the monothiols GSH (Fig. 6B, inset) or l-cysteine (not shown) the stoichiometry is 2:1. The concentration of bound thiol was then calculated from the above extinction coefficients (Fig. 6, A and B) and fitted to the ligand binding equation (Equation 2) yielding apparent dissociation constants (Kd) of 0.43, 6.2, and 27 μm for T(SH)2, GSH, and l-cysteine, respectively (Table 3). Analysis of the residual concentration of free thiol with DTNB gave essentially identical values for the bound thiol concentration at low thiol concentrations, but was not sufficiently accurate at higher thiol concentrations to provide meaningful estimates of Kd.
FIGURE 6.

Analysis of PMX464 binding to T(SH)2, GSH, and l-cysteine. PMX464 (100 μm) was incubated with increasing amounts of T(SH)2 (A), GSH (B), or l-cysteine (not shown). At equilibrium the absorbance at 302.5 and 400 nm (background) were measured. The insets show the calculated differential absorbance plotted against the thiol concentration. Binding ratios and thiol capacities were determined and used for calculation of bound thiol concentrations. These data were plotted against the total thiol concentration and fitted to an equation describing tight ligand binding. Data are listed in Table 3. C, the initial rate of binding of PMX464 to T(SH)2 (open circles), GSH (open squares), or l-cysteine (closed circles) at equimolar concentrations were determined by measuring the absorbance at 302.5 and 400 nm. The initial rates of thiol binding were calculated and plotted against the thiol concentration. D, an equimolar mixture of PMX464 and T(SH)2 (open circles), GSH (open squares), or l-cysteine (closed circles) was incubated until equilibrium was reached. DTNB was added and the reaction with reactive-free thiols was monitored at 412 nm. Here, the apparent initial rate is plotted against the thiol concentration. See “Experimental Procedures” for further details.
TABLE 3.
Analysis of T(SH)2, GSH, and l-cysteine binding to PMX464
See Fig. 5 and “Experimental Procedures” for further details. Results are the weighted mean ± S.D. of three independently performed experiments.
| Kda | Overall reaction orderb | Complex formation,bk1 | Complex dissociationc | Half-time for dissociation | |
|---|---|---|---|---|---|
| μm | μm−1min−1 × 10⁻³ | k2, min−1 × 10⁻³ | min | ||
| GSH | 6.2 ± 1.9 | 1.11 ± 0.07 | 3.6 ± 1.1 | 1.21 ± 0.07 | 573 |
| l-Cysteine | 26.7 ± 2.8 | 1.37 ± 0.16 | 6.6 ± 4.5 | 8.59 ± 0.20 | 81 |
| T(SH)2 | 0.43 ± 0.09 | 1.08 ± 0.06 | 45.6 ± 8.9 | 2.50 ± 0.08 | 277 |
a Apparent dissociation constants (Kd) were calculated using the ligand binding equation (Eq. 2).
b The overall reaction order and the apparent rate constants, k1 were calculated from the initial reaction rates fitted to Eq. 4.
c The apparent rate constants, k2 for complex dissociation were calculated by linear regression (correlation coefficients >0.994) of the initial rates of thiol formation following the addition of DTNB.
The kinetics of thiol-PMX464 complex formation was determined using equimolar concentrations of each reactant. Initial reaction rates were calculated and plotted against the PMX464/thiol concentration (Fig. 6C). Data were fitted to Equation 4 describing a reaction of overall order (m + n) (Table 3). GSH and T(SH)2 were essentially pseudo-first order, whereas cysteine yielded a complex overall order of 1.4. The dithiol T(SH)2 was the most reactive and glutathione the least reactive under these assay conditions.
The stability of the different PMX464 complexes was examined using DTNB. Addition of excess DTNB should immediately remove free thiols from the equilibrium mixture, causing further dissociation of the PMX464-thiol complex and providing an assessment of the rate of dissociation of the complexes. Dissociation of the PMX464-thiol complexes was found to be slow, taking ∼5 h to reach completion for cysteine and more than 20 h for GSH (data not shown). The apparent initial rates of dissociation were determined for each equimolar mixture of PMX464 and thiol in equilibrium. The data were plotted against the PMX464 concentration and analyzed by linear regression (Table 3). The rate of complex dissociation decreased from l-cysteine, T(SH)2, to GSH with half-times for dissociation of 1.4, 4.6, and 9.6 h, respectively. These findings indicate that binding of quinols to low molecular mass thiols is tight, but reversible.
Mechanism of Inhibition of TDPX and TryP by PMX464
As part of their catalytic cycles, TDPX (Fig. 7) forms an intramolecular and TryP (Fig. 8) an intermolecular disulfide bridge upon oxidation with hydroperoxide. In these two redox states both enzymes display different mobility by SDS-PAGE under non-reducing conditions (Figs. 7 and 8, lanes 1 and 2). To examine the effect of PMX464, TDPX and TryP were reduced by the TryR/T(SH)2/TryX-dependent system followed by incubation with PMX464 or DMSO as control. Proteins were separated by SDS-PAGE without heating the samples. PMX464 treatment promoted a small mobility shift in the direction of the band for oxidized TDPX (Fig. 7, compare starred bands in lanes 3 and 4), which can be discerned relative to the TryX band that has previously been shown not to react with PMX464 (Fig. 4C). A more pronounced shift can be observed for TryP (Fig. 8). In solution TryP is a homodimer that can oligomerize to form a doughnut-shaped pentamer of dimers (45). The reduced protein migrates as a monomer of 24.6 kDa by SDS-PAGE (Fig. 7, lane 1). Following oxidation of the reduced enzyme with peroxide, the protein migrates as a disulfide cross-linked dimer of 49.2 kDa under non-reducing conditions (Fig. 8, lane 2). In the absence of sample heating, complete dissociation of the TryP decameric complex does not occur and only a faint band at the size of a monomer is seen in the TryP sample reduced by TryX (Fig. 8, lane 3). Addition of PMX464 resulted in complete disappearance of the band corresponding to the size of the monomer, which was associated with the appearance of a band corresponding to the size of a TryP dimer (Fig. 8, lane 4). These results suggest that PMX464 reacts with the two catalytic cysteine residues of TDPX and TryP, respectively.
FIGURE 7.

A, mobility shift analysis of a mixture of PMX464 incubated with TDPX by non-reducing SDS-PAGE (12% NuPAGE). TDPX2 was incubated for 30 min with 10 mm DTT (lane 1), 100 μm H2O2 (lane 2), 100 μm NADPH, 0.1 nmol of TryR, 0.1 nmol of TryX, 0.1 nmol of T(SH)2 (lane 3), and as in lane 3 with an additional 100 μmol of PMX464 (lane 4). 0.1 nmol of TDPX2 was analyzed per lane. The samples for lanes 3 and 4 were not heated before SDS-PAGE analysis. B, a ribbon diagram of the reduced monomeric TDPX is depicted. The two yellow spheres represent the two catalytic cysteine residues (19). C, the scheme illustrates the TDPX redox reactions. The reduced monomeric TDPX forms upon oxidation of an intramolecular disulfide bridge. It is proposed that the two thiols are involved in binding to one molecule of PMX464.
FIGURE 8.

A, mobility shift analysis of a mixture of PMX464 incubated with TryP by non-reducing SDS-PAGE (12% NuPAGE). TryP was incubated for 30 min with 10 mm DTT (lane 1), 100 μm H2O2 (lane 2), 100 μm NADPH, 0.1 nmol of TryR, 0.1 nmol of TryX, 0.1 nmol of T(SH)2 (lane 3), and as in lane 3 with an additional 100 μmol of PMX464 (lane 4). 0.1 nmol of TryP were analyzed per lane. The samples for lanes 3 and 4 were not heated before SDS-PAGE analysis. B, a ribbon diagram of the reduced TryP homodimer, with the yellow spheres indicating the position of the catalytic cysteine residues (45). C, the scheme illustrates the TryP redox reactions. The reduced dimer decays under the denaturing conditions of an SDS-PAGE to a monomer. TryP forms upon oxidation of an intermolecular disulfide bridge so that the dimer is cross-linked in the oxidized form. It is proposed that the two thiols are involved in binding to one molecule of PMX464 cross-linking the two TryP subunits.
Brief heat treatment (95 °C, 1 min) of PMX464-inactivated TryP resulted in complete dissociation of the TryP dimeric complex. Presumably other buried SH groups in the denatured protein are then able to exchange with quinol cross-linked dimers to form monomer quinol adducts. However, this complex appears to be highly stable in the native state, because no peroxidase activity could be recovered even after extensive dialysis for 24 h and the complex retained the shift in mobility seen in Fig. 8, lane 4.
DISCUSSION
Recently, quinols were found to have promising inhibitory activity against various types of cancer cells (29, 31, 40, 46). Here, we report that quinols are also very potent trypanocidal agents. Among these, PMX464 and the arylsulfonylindole-substituted quinols were the most potent with EC50 values ≤100 nm. PMX464 exhibits a rapid cytocidal rather than a cytostatic effect on trypanosomes, a distinct advantage for future drug development. All quinol analogues tested were consistently more selective, albeit marginally, against T. brucei than against MRC5 cells. Selectivity may be underestimated possibly due to sequestration of the free quinol by the high concentration of l-cysteine in the parasite culture medium. However, the reversible nature of the cysteine-quinol complex and the fairly rapid rate of dissociation may allow equilibrium exchange with other higher affinity intracellular targets such as T(SH)2, TryP, and TDPX to take place over the 72-h incubation. Quinols are double Michael acceptors, suggesting that biological molecules with vicinal dithiols would be preferential targets. Indeed, monothiols such as glutathione and cysteine form 14-fold weaker 2:1 complexes than the 1:1 complex with T(SH)2. This can be attributed to the fact that the reaction in dilute solution is essentially intramolecular with dithiols due to the higher effective concentration of the second thiol group once the first Michael addition is formed.
The two trypanothione-dependent peroxidase systems comprise a series of dithiol-containing proteins (TryR, TryX, TryP, and TDPX) that switch between reduced (dithiol) and oxidized (disulfide) states during catalysis (19, 36, 47–49). Both classes of tryparedoxin peroxidase (TryP and TDPX) are inhibited in concentration- and time-dependent manners by quinols, whereas the other components, TryR and TryX, are not. The flexible nature of TDPX (19) and TryP (45, 50) and the consequent accessibility of the peroxidatic and resolving cysteine residues could favor reaction with both Michael acceptor sites on a single quinol molecule. In contrast, in TryX, a thioredoxin-like protein, and in TryR, a homologue of glutathione reductase, only one of the redox-active cysteine residues is readily accessible to solvent (51–54).
Given that quinols are promiscuous toward dithiol-containing biological molecules, the following evidence supports the conclusion that trypanothione and the monomeric and decameric tryparedoxin peroxidases are primary targets of PMX464 in trypanosomes. First, exposure to PMX464 results in decreased T(SH)2 content, whereas glutathione is not decreased (Fig. 2B). Second, transgenic trypanosomes overexpressing trypanothione synthetase with elevated T(SH)2 cellular content show increased resistance to this quinol (Fig. 3). Third, non-lytic concentrations of H2O2 accelerate cell lysis induced by PMX464 (Fig. 1B). This could be due to either a decrease in T(SH)2 to critical levels as a result of oxidative stress, or a direct inhibition of TryP and/or TDPX. Importantly, a combination of both effects could account for the higher IC50 values obtained in vitro against the peroxidase systems compared with EC50 values against whole cells. However, it is also possible that the IC50 values determined in Table 3 are underestimated because PMX464 is a time-dependent inhibitor and instability of the reaction components limits these determinations to 90 min. In contrast, EC50 values are determined after a 72-h exposure to PMX464.
The molecular mechanism of quinol inhibitory activity on trypanosome thiol metabolism may give valuable insights concerning quinol-mediated cytotoxic effects in other organisms. Homologues of TryP, the peroxiredoxins, are ubiquitous proteins with highly conserved structures (49). Therefore, it seems likely that peroxiredoxins are also targets for quinols in mammalian cells. Indeed, PrxI was recently identified as a quinol target in HCT 116 cell lysates by affinity chromatography using an immobilized quinol (41). Moreover, peroxiredoxins have been reported to be overexpressed in various cancer cell lines (55). Therefore, we propose that inhibition of peroxiredoxins could contribute to the antitumor activity of quinols.
In conclusion we have shown that the antitumor quinols are very potent trypanocidal agents whose effects are mediated, at least in part, by reaction with T(SH)2, TryP, and TDPX, thereby inhibiting the pivotal, unique, and essential antioxidant system in these parasites. Quinols are clearly not “magic bullets” specifically inhibiting one target, but take advantage of “polypharmacology” (56, 57). As a result, selectivity is an issue that will be addressed in future studies.
Acknowledgments
We thank Pharminox Ltd., Nottingham, UK, for provision of quinol inhibitors, Irene Hallyburton and Bhavya Rao for excellent assistance in performing the growth inhibition assays, and Dr. Stephen Patterson for advice.
This work was supported by Wellcome Trust Grants WT 079838, WT 077705, and WT 083481.
- T(SH)2
- trypanothione (N1,N8-bis(glutathionyl)spermidine
- quinols
- 4-substituted 4-hydroxycyclohexa-2,5-dienones
- TryP
- type I (decameric) tryparedoxin peroxidase
- TDPX
- type II (monomeric) tryparedoxin-dependent peroxidase
- TryR
- trypanothione reductase
- TryX
- tryparedoxin
- VSG
- variant surface glycoprotein
- DTNB
- 5,5′-dithiobis(2-nitrobenzoic acid)
- DMSO
- dimethyl sulfoxide.
REFERENCES
- 1. Stuart K., Brun R., Croft S., Fairlamb A., Gürtler R. E., McKerrow J., Reed S., Tarleton R. (2008) J. Clin. Invest. 118, 1301–1310 [DOI] [PMC free article] [PubMed] [Google Scholar]
- 2. Pecoul B. (2004) Plos Med. 1, e6. [DOI] [PMC free article] [PubMed] [Google Scholar]
- 3. Balasegaram M., Harris S., Checchi F., Ghorashian S., Hamel C., Karunakara U. (2006) Bull. World Health Org. 84, 783–791 [DOI] [PMC free article] [PubMed] [Google Scholar]
- 4. Balasegaram M., Young H., Chappuis F., Priotto G., Raguenaud M. E., Checchi F. (2009) Trans. R. Soc. Trop. Med. Hyg. 103, 280–290 [DOI] [PubMed] [Google Scholar]
- 5. Fairlamb A. H., Blackburn P., Ulrich P., Chait B. T., Cerami A. (1985) Science 227, 1485–1487 [DOI] [PubMed] [Google Scholar]
- 6. Ariyanayagam M. R., Fairlamb A. H. (2001) Mol. Biochem. Parasitol. 115, 189–198 [DOI] [PubMed] [Google Scholar]
- 7. Fairlamb A. H., Cerami A. (1992) Annu. Rev. Microbiol. 46, 695–729 [DOI] [PubMed] [Google Scholar]
- 8. Dormeyer M., Reckenfelderbäumer N., Ludemann H., Krauth-Siegel R. L. (2001) J. Biol. Chem. 276, 10602–10606 [DOI] [PubMed] [Google Scholar]
- 9. Augustyns K., Amssoms K., Yamani A., Rajan P. K., Haemers A. (2001) Curr. Pharm. Des. 7, 1117–1141 [DOI] [PubMed] [Google Scholar]
- 10. Flohé L., Hecht H. J., Steinert P. (1999) Free Radic. Biol. Med. 27, 966–984 [DOI] [PubMed] [Google Scholar]
- 11. Krauth-Siegel R. L., Meiering S. K., Schmidt H. (2003) Biol. Chem. 384, 539–549 [DOI] [PubMed] [Google Scholar]
- 12. Aboagye-Kwarteng T., Smith K., Fairlamb A. H. (1992) Mol. Microbiol. 6, 3089–3099 [DOI] [PubMed] [Google Scholar]
- 13. Krieger S., Schwarz W., Ariyanayagam M. R., Fairlamb A. H., Krauth-Siegel R. L., Clayton C. (2000) Mol. Microbiol. 35, 542–552 [DOI] [PubMed] [Google Scholar]
- 14. Lüdemann H., Dormeyer M., Sticherling C., Stallmann D., Follmann H., Krauth-Siegel R. L. (1998) FEBS Lett. 431, 381–385 [DOI] [PubMed] [Google Scholar]
- 15. Tetaud E., Giroud C., Prescott A. R., Parkin D. W., Baltz D., Biteau N., Baltz T., Fairlamb A. H. (2001) Mol. Biochem. Parasitol. 116, 171–183 [DOI] [PubMed] [Google Scholar]
- 16. Budde H., Flohé L., Hecht H. J., Hofmann B., Stehr M., Wissing J., Lünsdorf H. (2003) Biol. Chem. 384, 619–633 [DOI] [PubMed] [Google Scholar]
- 17. Henderson G. B., Fairlamb A. H., Cerami A. (1987) Mol. Biochem. Parasitol. 24, 39–45 [DOI] [PubMed] [Google Scholar]
- 18. Trujillo M., Budde H., Piñeyro M. D., Stehr M., Robello C., Flohé L., Radi R. (2004) J. Biol. Chem. 279, 34175–34182 [DOI] [PubMed] [Google Scholar]
- 19. Alphey M. S., König J., Fairlamb A. H. (2008) Biochem. J. 414, 375–381 [DOI] [PMC free article] [PubMed] [Google Scholar]
- 20. Hillebrand H., Schmidt A., Krauth-Siegel R. L. (2003) J. Biol. Chem. 278, 6809–6815 [DOI] [PubMed] [Google Scholar]
- 21. Schlecker T., Comini M. A., Melchers J., Ruppert T., Krauth-Siegel R. L. (2007) Biochem. J. 405, 445–454 [DOI] [PMC free article] [PubMed] [Google Scholar]
- 22. Schlecker T., Schmidt A., Dirdjaja N., Voncken F., Clayton C., Krauth-Siegel R. L. (2005) J. Biol. Chem. 280, 14385–14394 [DOI] [PubMed] [Google Scholar]
- 23. Comini M. A., Krauth-Siegel R. L., Flohé L. (2007) Biochem. J. 402, 43–49 [DOI] [PMC free article] [PubMed] [Google Scholar]
- 24. Wilkinson S. R., Horn D., Prathalingam S. R., Kelly J. M. (2003) J. Biol. Chem. 278, 31640–31646 [DOI] [PubMed] [Google Scholar]
- 25. Cunningham M. L., Zvelebil M. J., Fairlamb A. H. (1994) Eur. J. Biochem. 221, 285–295 [DOI] [PubMed] [Google Scholar]
- 26. Fairlamb A. H., Henderson G. B., Cerami A. (1989) Proc. Natl. Acad. Sci. U.S.A. 86, 2607–2611 [DOI] [PMC free article] [PubMed] [Google Scholar]
- 27. Mukhopadhyay R., Dey S., Xu N., Gage D., Lightbody J., Ouellette M., Rosen B. P. (1996) Proc. Natl. Acad. Sci. U.S.A. 93, 10383–10387 [DOI] [PMC free article] [PubMed] [Google Scholar]
- 28. Wyllie S., Cunningham M. L., Fairlamb A. H. (2004) J. Biol. Chem. 279, 39925–39932 [DOI] [PubMed] [Google Scholar]
- 29. Bradshaw T. D., Matthews C. S., Cookson J., Chew E. H., Shah M., Bailey K., Monks A., Harris E., Westwell A. D., Wells G., Laughton C. A., Stevens M. F. G. (2005) Cancer Res. 65, 3911–3919 [DOI] [PubMed] [Google Scholar]
- 30. Wells G., Berry J. M., Bradshaw T. D., Burger A. M., Seaton A., Wang B., Westwell A. D., Stevens M. F. G. (2003) J. Med. Chem. 46, 532–541 [DOI] [PubMed] [Google Scholar]
- 31. Mukherjee A., Westwell A. D., Bradshaw T. D., Stevens M. F., Carmichael J., Martin S. G. (2005) Br. J. Cancer 92, 350–358 [DOI] [PMC free article] [PubMed] [Google Scholar]
- 32. Pallis M., Bradshaw T. D., Westwell A. D., Grundy M., Stevens M. F., Russell N. (2003) Biochem. Pharmacol. 66, 1695–1705 [DOI] [PubMed] [Google Scholar]
- 33. Greig N., Wyllie S., Patterson S., Fairlamb A. H. (2009) FEBS J. 276, 376–386 [DOI] [PMC free article] [PubMed] [Google Scholar]
- 34. Wyllie S., Oza S. L., Patterson S., Spinks D., Thompson S., Fairlamb A. H. (2009) Mol. Microbiol. 74, 529–540 [DOI] [PMC free article] [PubMed] [Google Scholar]
- 35. Torrie L. S., Wyllie S., Spinks D., Oza S. L., Thompson S., Harrison J. R., Gilbert I. H., Wyatt P. G., Fairlamb A. H., Frearson J. A. (2009) J. Biol. Chem. 284, 36137–36145 [DOI] [PMC free article] [PubMed] [Google Scholar]
- 36. König J., Fairlamb A. H. (2007) FEBS J. 274, 5643–5658 [DOI] [PMC free article] [PubMed] [Google Scholar]
- 37. Fairlamb A. H., Henderson G. B., Bacchi C. J., Cerami A. (1987) Mol. Biochem. Parasitol. 24, 185–191 [DOI] [PubMed] [Google Scholar]
- 38. Studier F. W. (2005) Protein Expr. Purif. 41, 207–234 [DOI] [PubMed] [Google Scholar]
- 39. Gething M. J., Davidson B. E. (1972) Eur. J. Biochem. 30, 352 [Google Scholar]
- 40. Berry J. M., Bradshaw T. D., Fichtner I., Ren R., Schwalbe C. H., Wells G., Chew E. H., Stevens M. F., Westwell A. D. (2005) J. Med. Chem. 48, 639–644 [DOI] [PubMed] [Google Scholar]
- 41. Chew E. H., Matthews C. S., Zhang J., McCarroll A. J., Hagen T., Stevens M. F., Westwell A. D., Bradshaw T. D. (2006) Biochem. Biophys. Res. Commun. 346, 242–251 [DOI] [PubMed] [Google Scholar]
- 42. Chew E. H., Lu J., Bradshaw T. D., Holmgren A. (2008) FASEB J. 22, 2072–2083 [DOI] [PubMed] [Google Scholar]
- 43. Mortimer C. G., Wells G., Crochard J. P., Stone E. L., Bradshaw T. D., Stevens M. F., Westwell A. D. (2006) J. Med. Chem. 49, 179–185 [DOI] [PubMed] [Google Scholar]
- 44. Callister M. E., Pinhu L., Catley M. C., Westwell A. D., Newton R., Leaver S. K., Quinlan G. J., Evans T. W., Griffiths M. J., Burke-Gaffney A. (2008) Br. J. Pharmacol. 155, 661–672 [DOI] [PMC free article] [PubMed] [Google Scholar]
- 45. Alphey M. S., Bond C. S., Tetaud E., Fairlamb A. H., Hunter W. N. (2000) J. Mol. Biol. 300, 903–916 [DOI] [PubMed] [Google Scholar]
- 46. Lion C. J., Matthews C. S., Wells G., Bradshaw T. D., Stevens M. F., Westwell A. D. (2006) Bioorg. Med. Chem. Lett. 16, 5005–5008 [DOI] [PubMed] [Google Scholar]
- 47. König J., Lotte K., Plessow R., Brockhinke A., Baier M., Dietz K. J. (2003) J. Biol. Chem. 278, 24409–24420 [DOI] [PubMed] [Google Scholar]
- 48. Wood Z. A., Poole L. B., Hantgan R. R., Karplus P. A. (2002) Biochemistry 41, 5493–5504 [DOI] [PubMed] [Google Scholar]
- 49. Wood Z. A., Schröder E., Harris J., Poole L. B. (2003) Trends Biochem. Sci. 28, 32–40 [DOI] [PubMed] [Google Scholar]
- 50. Piñeyro M. D., Pizarro J. C., Lema F., Pritsch O., Cayota A., Bentley G. A., Robello C. (2005) J. Struct. Biol. 150, 11–22 [DOI] [PubMed] [Google Scholar]
- 51. Alphey M. S., Leonard G. A., Gourley D. G., Tetaud E., Fairlamb A. H., Hunter W. N. (1999) J. Biol. Chem. 274, 25613–25622 [DOI] [PubMed] [Google Scholar]
- 52. Alphey M. S., Gabrielsen M., Micossi E., Leonard G. A., McSweeney S. M., Ravelli R. B., Tetaud E., Fairlamb A. H., Bond C. S., Hunter W. N. (2003) J. Biol. Chem. 278, 25919–25925 [DOI] [PubMed] [Google Scholar]
- 53. Bond C. S., Zhang Y., Berriman M., Cunningham M. L., Fairlamb A. H., Hunter W. N. (1999) Structure 7, 81–89 [DOI] [PubMed] [Google Scholar]
- 54. Jones D. C., Ariza A., Chow W. H., Oza S. L., Fairlamb A. H. (2010) Mol. Biochem. Parasitol. 169, 12–19 [DOI] [PMC free article] [PubMed] [Google Scholar]
- 55. Kang S. W., Rhee S. G., Chang T. S., Jeong W., Choi M. H. (2005) Trends Mol. Med. 11, 571–578 [DOI] [PMC free article] [PubMed] [Google Scholar]
- 56. Hopkins A. L., Mason J. S., Overington J. P. (2006) Curr. Opin. Struct. Biol. 16, 127–136 [DOI] [PubMed] [Google Scholar]
- 57. Hopkins A. L. (2008) Nat. Chem. Biol. 4, 682–690 [DOI] [PubMed] [Google Scholar]