

Summary
Objectives
To report on the process and criteria for selecting acquisition protocols to include in the osteoarthritis initiative (OAI) magnetic resonance imaging (MRI) study protocol for the knee.
Methods
Candidate knee MR acquisition protocols identified from the literature were first optimized at 3 Tesla (T). Twelve knees from 10 subjects were scanned one time with each of 16 acquisitions considered most likely to achieve the study goals and having the best optimization results. The resultant images and multi-planar reformats were evaluated for artifacts and structural discrimination of articular cartilage at the cartilage–fluid, cartilage–fat, cartilage–capsule, cartilage–meniscus and cartilage–cartilage interfaces.
Results
The five acquisitions comprising the final OAI MRI protocol were assembled based on the study goals for the imaging protocol, the image evaluation results and the need to image both knees within a 75 min time slot, including positioning. For quantitative cartilage morphometry, fat-suppressed, 3D dual-echo in steady state (DESS) acquisitions appear to provide the best universal cartilage discrimination.
Conclusions
The OAI knee MRI protocol provides imaging data on multiple articular structures and features relevant to knee OA that will support a broad range of existing and anticipated measurement methods while balancing requirements for high image quality and consistency against the practical considerations of a large multi-center cohort study. Strengths of the final knee MRI protocol include cartilage quantification capabilities in three planes due to multi-planar reconstruction of a thin slice, high spatial resolution 3D DESS acquisition and the multiple, non-fat-suppressed image contrasts measured during the T2 relaxation time mapping acquisition.
Keywords: Osteoarthritis, Knee, MRI, Protocol
Background
Osteoarthritis (OA) of the knee is a significant contributor to disability and loss of independence among middle age and elderly persons and presents a clear and growing public health need (http://www.cdc.gov/nchs/fastats/arthrits.htm). Because of the chronic nature of OA and its variable clinical outcomes, the use of clinical endpoints in studies of risk and prognostic factors and in clinical trials that test interventions to prevent or slow the progression of this disease requires studying large numbers of patients for long periods of time, often at great expense. Developing effective medical treatments to prevent or to reduce progression of OA is hampered by the lack of robust biomarkers of disease onset and progression.
The osteoarthritis initiative (OAI) is a public–private partnership jointly sponsored by the National Institutes of Health (NIH), including the National Institute of Arthritis and Musculoskeletal and Skin Diseases (NIAMS), National Institute on Aging (NIA), National Institute of Dental and Craniofacial Research (NIDCR), National Center for Complementary and Alternative Medicine (NCCAM), Office of Research on Women’s Health (ORWH), National Institute of Biomedical Imaging and Bioengineering (NIBIB), and National Center on Minority Health and Health Disparities (NCMHD), and the pharmaceutical industry. The OAI is focused on identifying the most promising biomarkers of development and progression of symptomatic knee OA. A total of 4796 men and women, aged 45–79 years, who either have or are at increased risk of developing knee OA have been enrolled in the study. Annual radiography and magnetic resonance imaging (MRI) of the knee and clinical assessments of disease activity are being performed in all participants over a period of 4 years. Genetic and biochemical specimens are also being collected annually from all participants.
A primary objective of the OAI is to create a public resource for identifying, characterizing and validating a broad range of imaging biomarkers for OA of the knee that could be used to investigate basic research hypotheses as well as to serve as outcomes in clinical trials of new therapies. Accordingly, the goals for the OAI MRI study protocol are to (1) provide imaging data on as many articular structures and features believed to be relevant to knee OA as possible; (2) provide images that are able to support as broad a range of existing and anticipated measurement methods for each of these structures and features as possible; and (3) balance scientific requirements for image quality and consistency against the need to maintain high throughput of the participants and the ability of the participants to tolerate the annual MRI examinations.
The report outlines the rationale used by the OAI Imaging Working Group, which included scientists and clinicians from academia and industry with expertise in MRI of OA and cartilage (see Acknowledgements), to address these design considerations and ultimately to arrive at the knee MRI protocol used in the OAI. This report is not intended to serve as a review of the literature on existing or emerging imaging biomarkers of knee OA using MRI technology. Several excellent reviews have recently been published, and readers are referred to these for broad overviews of the field1-5.
A key consideration in protocol development for the OAI was to identify which knee OA features to target. Since OA affects several articular structures, and is believed to progress through multiple pathogenic pathways, the imaging protocol had to support multi-feature, structural assessment of the knee. The OAI Imaging Working Group prioritized the following knee structures: articular cartilage, osteophytes, bone marrow abnormality (BMA), bone attrition and cysts, the osteochondral junction (bone surface area), meniscal integrity, synovial tissue, joint effusion, anterior cruciate ligament (ACL) and posterior cruciate ligament (PCL), medial collateral ligament (MCL) and lateral collateral ligament (LCL). Quantitative assessment of articular cartilage morphology (e.g., volume, thickness, cartilaginous/denuded surface area, etc.) was considered to be particularly important. Many assessments of the selected knee structures have been previously validated using MRI at 1.5 T, and are used widely clinically and in research6-14.
The above priorities determined that anatomical coverage had to include at least the entire patellar, femoral and tibial cartilages but ideally the entire synovial cavity. Other decisions with respect to acquisition planes, spatial resolution, image contrast, and acquisition time are discussed below, but the general principles underlying the tradeoffs are outlined in a report from the Workshop on Imaging Osteoarthritis of the Knee15, held on December 5–6, 2002 in Bethesda, MD by Outcome Measures in Rheumatology Clinical Trials (OMERACT) and Osteoarthritis Research Society International (OARSI).
Early in the planning stages of the OAI, the decision was made to purchase dedicated, state-of-the-art MRI systems for each of the four study sites (The Ohio State University, Columbus, OH; University of Maryland, School of Medicine, Baltimore, MD; University of Pittsburgh, Pittsburgh, PA; and Memorial Hospital of Rhode Island, Pawtucket, RI) to minimize acquisition variability and accommodate the large number of subjects to be examined over the course of the study. In 2003, when the OAI study was being designed and implemented, 3 Tesla (T) MRI systems had recently been introduced to the commercial market but were not yet routinely available in clinical settings. MRI at 3 T offered potential advantages over 1.5 T in terms of signal level that could be traded for increased signal-to-noise (SNR), spatial resolution or imaging speed. This advantage was felt to be particularly useful for T2 relaxation time measurement of cartilage2,10,16,17 and was believed to outweigh potential disadvantages of high field strength, such as increased susceptibility to metallic artifacts, increased fat-water chemical shift, and different tissue relaxation times than those observed at 1.5 T18,19. Inspite of the relative lack of clinical and research experience at 3 T, it was understood that 1.5 T knee MRI protocols would not translate directly to 3 T without adjusting for the differences detailed above. Other important considerations for the OAI included: use of commercially available, food and drug administration (FDA)-approved, pulse sequences and radiofrequency (RF) coils; minimizing redundancy among acquisitions in the measurements that could be derived from them; the need to position and image both knees within 75 min to prevent subject discomfort and minimize the risk of dropout; and minimizing individual sequence acquisition times to reduce the possibility of motion artifacts and associated image degradation, especially for 3D acquisitions and 2D multi-echo spin-echo (MESE) acquisitions.
The process of meeting these diverse goals with a single, uniform protocol entailed selecting the image contrasts most likely to satisfy the anticipated needs and making careful tradeoffs in image spatial resolution and tissue contrasts. To facilitate this process, a pilot study was undertaken in which selected candidate acquisition sequences, based on contrast parameters at 1.5 T, were optimized for use at 3 T. A small sample of knees was then scanned with the most promising acquisitions and the resulting images visually evaluated by musculoskeletal imaging experts affiliated with the OAI (see Acknowledgements) for suitability in cartilage segmentation and semi-quantitative assessments of relevant tissues. Details of this pilot study and its results can found on the OAI website (http://www.oai.ucsf.edu).
The OAI MRI protocol
The final OAI knee MRI protocol is shown in Tables I and II. Subject positioning and scan set up can be found in detail in the OAI MRI Operator’s Manual available on the website (http://www.oai.ucsf.edu). The knee MRI acquisition begins with a three-plane localizer, followed by a coronal intermediate-weighted (IW) 2D turbo spin-echo (TSE) (COR IW 2D TSE)7 for evaluating the MCL and LCL, marginal femoral and tibial osteophytes, the medial and lateral meniscal body segments, and the presence/extent of subchondral bone cysts and bone attrition. All 2D and 3D coronal acquisitions are oriented coronal to the joint based on anatomic landmarks using a double oblique prescription (Figs. 1 and 2)9 in order to improve the reproducibility of cross-sectional anatomy depicted on serially acquired MRI exams.
Table I.
Final OAI knee MRI protocol acquisition time (min)
| Scan | Right knee | Left knee | Total | |
|---|---|---|---|---|
| 1 | Localizer (3-plane) | 0.5 | 0.5 | 1.0 |
| 2 | COR IW 2D TSE | 3.4 | 3.4 | 6.8 |
| 3 | SAG 3D DESS WE | 10.6 | 10.6 | 21.2 |
| 4 | COR MPR SAG 3D DESS WE | 0.0 | 0.0 | 0.0 |
| 5 | AXIAL MPR SAG 3D DESS WE | 0.0 | 0.0 | 0.0 |
| 6 | COR T1W 3D FLASH WE* | 8.6 | – | 8.6 |
| 7 | SAG IW 2D TSE FS | 4.7 | 4.7 | 9.4 |
| 8 | SAG 2D MESE* | 10.6 | – | 10.6 |
| Total | 38.4 | 19.2 | 57.6 |
Acquired on only right knee, unless right knee contains metal in which case, acquired on only left knee.
Table II.
Final OAI knee MRI protocol acquisition parameters
| Scan | Localizer | COR IW 2D TSE | SAG 3D DESS WE | COR T1W 3D FLASH WE | SAG 2D MESE | SAG IW 2D TSE FS |
|---|---|---|---|---|---|---|
| Plane | 3-plane | Coronal | Sagittal | Coronal | Sagittal | Sagittal |
| FS | No | No | WE | WE | No | FS |
| Matrix (phase) | 128 | 307 | 307 | 512 | 269 | 313 |
| Matrix (frequency) | 256 | 384 | 384 | 512 | 384 | 448 |
| No. of slices | 21 | 35 | 160 | 80 | 21 | 37 |
| FOV (mm) | 200 | 140 | 140 | 160 | 120 | 160 |
| Slice thickness/gap (mm/mm) | 5/1 | 3/0 | 0.7/0 | 1.5/0 | 3/0.5 | 3/0 |
| Flip angle (°) | 40 | 180 | 25 | 12 | n/a | 180 |
| TE/TR (ms/ms) | 5/10 | 29/3700 | 4.7/16.3 | 7.57/20 | 10, 20, 30, 40, 50, 60, 70/2700 | 30/3200 |
| Bandwidth (Hz/pixel) | 250 | 352 | 185 | 130 | 250 | 248 |
| Chemical shift (pixels) | 1.8 | 1.3 | 0 | 0 | 1.8 | 0 |
| No. excitations averaged | 1 | 1 | 1 | 1 | 1 | 1 |
| ETL | 1 | 7 | 1 | 1 | 1 | 5 |
| Phase encode axis | A/P, R/L | R/L | A/P | R/L | A/P | A/P |
| Distance factor (%) | 50 | 0 | 0 | 0 | 16 | 0 |
| Phase oversampling | 0 | 20 | 0 | 0 | 0 | 40 |
| Slice oversampling | 0 | 0 | 10 | 0 | 0 | 0 |
| Phase resolution | 50 | 80 | 80 | 100 | 70 | 70 |
| Phase partial Fourier (8/8 = 1) | 1 | 1 | 1 | 1 | 0.875 | 1 |
| Readout partial Fourier (8/8 = 1) | 1 | 1 | 1 | 1 | 1 | 1 |
| Slice partial Fourier (8/8 = 1) | 1 | 1 | 0.75 | 0.75 | 0.75 | 1 |
| X-resolution (mm) | 0.391 | 0.365 | 0.365 | 0.313 | 0.313 | 0.357 |
| Y-resolution (mm) | 0.781 | 0.456 | 0.456 | 0.313 | 0.446 | 0.511 |
Fig. 1.
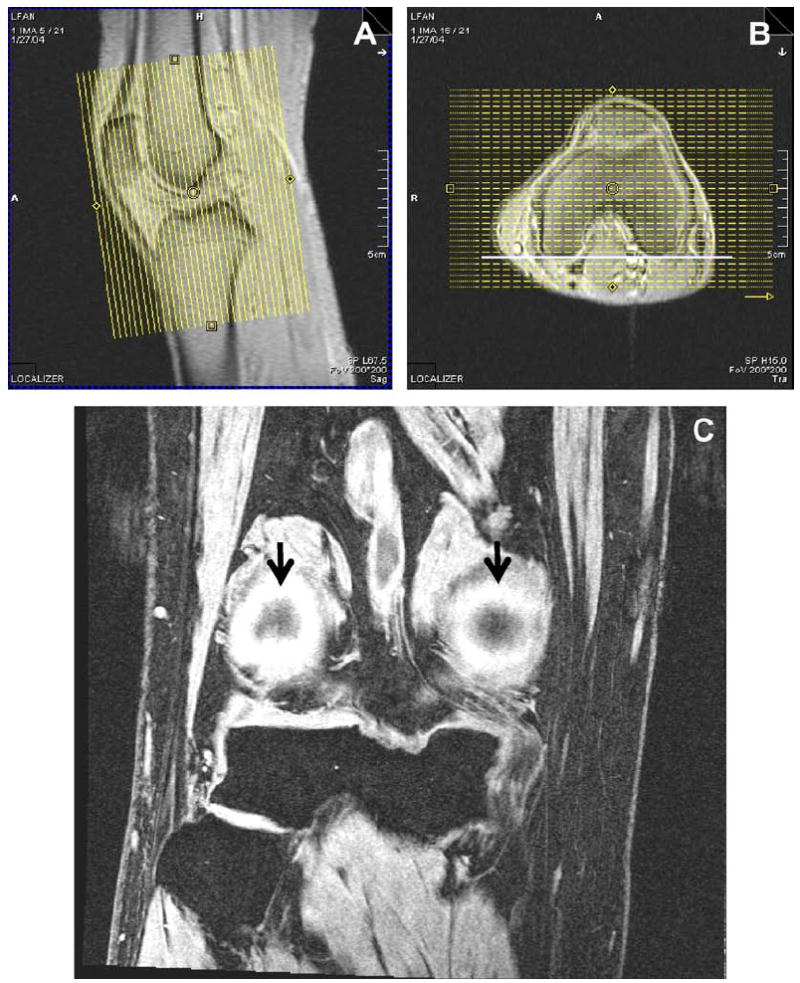
Orientation of coronal acquisitions. Coronal 2D and 3D acquisitions are prescribed coronal to the joint, with the slice axis parallel to the long axis of the femoral diaphysis on the sagittal localizer (A) and to a line tangent to the posterior cortices of the femoral condyles on the axial localizer (B). Depiction of both posterior femoral cortices (arrows) within two slices (3 mm) of each other confirms proper alignment on this example of COR 3D FLASH WE (C).
Fig. 2.

Example of COR IW 2D TSE. Note delineation of the MCL, LCL, body segments of the menisci, central tibial and femoral bone margins and the central tibiofemoral articular cartilage. Note that chemical-shift artifact is relatively mild.
The coronal plane1,9,15 is excellent for evaluating articular cartilage along the central weight-bearing surfaces of the femur and tibia, where the cartilage curves up the tibial spines and the corresponding curves of the adjacent femoral condyles near the notch. This plane is also excellent for delineating the osteochondral junctions at the medial and lateral margins of the femur and tibia. Intermediate weighting7 is used in COR IW 2D TSE to balance the need for an echo time (TE) short enough to detect non-displaced meniscal tears but still long enough to discriminate articular cartilage. Because of the high density and linear orientation of collagen fibers in the MCL and LCL, these structures show very rapid T2 relaxation and therefore good delineation with intermediate-TE sequences.
Although the 3D dual-echo in steady state (DESS) image contrast21 has not been as extensively evaluated for quantitative cartilage measurements as have fat-suppressed 3D fast low-angle shot (FLASH) or 3D spoiled gradient-recalled echo (SPGR) image contrast, 3D DESS with selective water excitation (WE) appeared to show better cartilage discrimination in pilot scans using volunteer subjects, and therefore was included in the OAI MRI protocol. Sagittal (SAG) 3D DESS WE was found not only to provide excellent cartilage delineation for morphological measurements, such as total joint cartilage thickness and volume, it also delineates osteophytes along the anterior and posterior margins of the femur and tibia and the superior and inferior margins of the patella with high resolution, shows tears of the anterior and posterior horns of the menisci, depicts subarticular bone cysts and bone attrition, and assesses integrity of the ACL and PCL and the patellar and quadriceps tendons1,15. In addition, the SAG 3D DESS acquisition is faster than an equivalent 3D FLASH (or SPGR) acquisition; the resultant time savings can be potentially traded for increased SNR or spatial resolution. All 2D and 3D sagittal acquisitions are oriented sagittal to the joint based on anatomic landmarks and are orthogonal to the coronal acquisitions (Figs. 3 and 4).
Fig. 3.
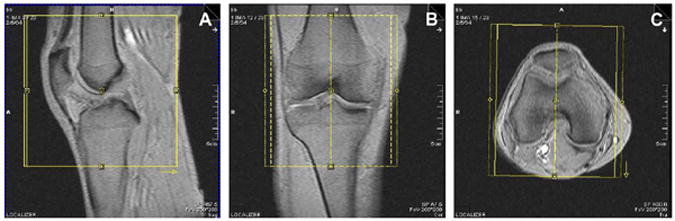
Orientation of the sagittal acquisitions. Anatomical coverage on sagittal 2D and 3D acquisitions should include the tibial tubercle, the entire patella and as much of the suprapatellar bursa as possible (A) Sagittal acquisitions are prescribed orthogonal to the coronal acquisitions and sagittal to the joint, with the slice axis parallel to the long axis of the femoral diaphysis on the coronal localizer (B) and perpendicular to a line tangent to the posterior cortices of the femoral condyles on the axial localizer (C).
Fig. 4.

SAG 3D DESS WE. Note the clear delineation of the cartilage-cartilage (small arrows) and cartilage-capsule (large arrow) interfaces as well as the interfaces between cartilage and adipose (F), bone (B) and meniscus (M).
The 3D DESS WE acquisition selected uses 0.7 mm thick slices. Thinner slices could have been obtained, however, the cost in increased scan time and subsequent loss of SNR was considered to be excessive. The 3D FLASH WE acquisition, in contrast, uses 1.5 mm slices, as was the coronal slice thickness that was previously validated at 1.5 T3,11,12,22,23. Because the SAG 3D DESS WE acquisition has thin slices, the resultant images can also be reformatted (MPR) into the coronal and axial planes (Figs. 5 and 6) to display optimally the tibial and central weight-bearing surface of the femoral cartilage, as well as the trochlear and patellar cartilage, respectively1,3,6,11,13. The multiplanar reformation (MPR) images can be of variable slice thickness; 1.5 mm was chosen for the OAI to enable comparison with the previously validated coronal 3D FLASH images. Other MPR orientations and slice thicknesses can be retrospectively calculated from the sagittal images. However, the in-plane spatial resolution of the MPR images is governed by the size and orientation of the voxels in the original acquisition. The SAG 3D DESS WE series utilizes near anisotropic voxels (0.7 mm slice thickness × 0.37 mm × 0.46 mm) to maximize in-plane sagittal spatial resolution in a reasonable acquisition time (10.5 min). The resultant in-plane coronal MPR spatial resolution is thus 0.7 mm × 0.37 mm.
Fig. 5.
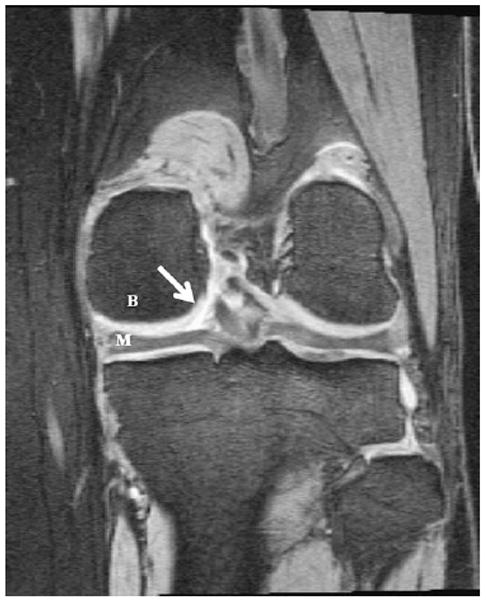
Coronal MPR of SAG 3D DESS WE. Orientation is identical to that described in Fig. 1. Note the excellent delineation of the cartilage–fluid interface (arrow), and the high contrast between cartilage and bone (B) and cartilage and meniscus (M).
Fig. 6.
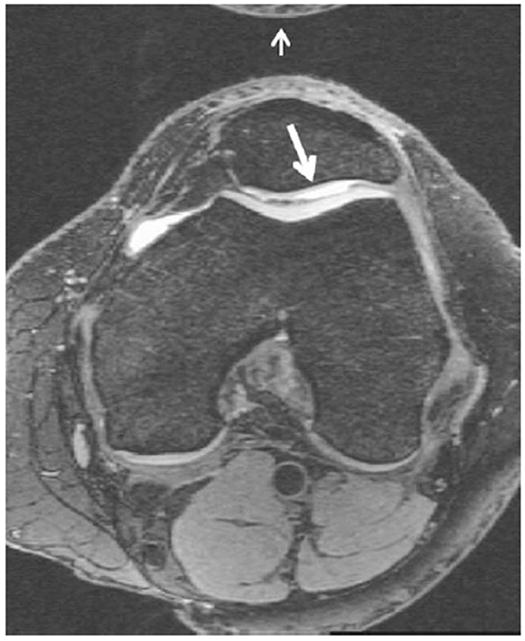
Axial MPR of SAG 3D DESS WE. Axial coverage includes any superior or inferior patellar osteophytes and extends to the tibial epiphysis. Note the good cartilage–fluid contrast revealing thinning of articular cartilage over the lateral facet of the patella (large arrow). Note also, that a small aliasing artifact (small arrow) is present at the top of the image but does not obscure any anatomy of interest.
The COR T1-weighted (T1W) 3D FLASH WE acquisition also provides high-resolution delineation of articular cartilage9, and as noted above has been extensively validated at 1.5 T and shown to support accurate quantification of the volume and thickness of cartilage over the tibial plateaus and the central surface of the femur3,11,12. Since the OAI MRI protocol was designed and implemented, 3D FLASH WE at 3 T has been cross-validated with 3D FLASH WE at 1.5 T for quantitative analysis of cartilage morphology23,24.
The OAI protocol also includes SAG IW 2D TSE fat suppression (FS), which provides excellent assessment of the ACL and PCL, the anterior and posterior horns of the menisci, anterior and posterior osteophytes, synovial effusion and peri-articular cysts and bursae. This technique also delineates articular cartilage; although, not as well as the 3D acquisitions do. To obtain relatively high spatial resolution in a relatively short acquisition time, the field of view (FOV) was made smaller (16 cm) than desired (24 cm) for complete coverage of the synovial cavity. The unique contribution of the SAG IW 2D TSE FS acquisition to the protocol is its sensitivity to BMA and subchondral cysts1,25-27 (Fig. 7A). Gradient-echo (GRE) techniques, such as 3D DESS (Fig. 7B) and 3D FLASH (Fig. 7C), even with robust FS, are relatively insensitive to BMA (large arrow in Fig. 7A). They are, however, sensitive for subchondral cysts (thin arrow).
Fig. 7.
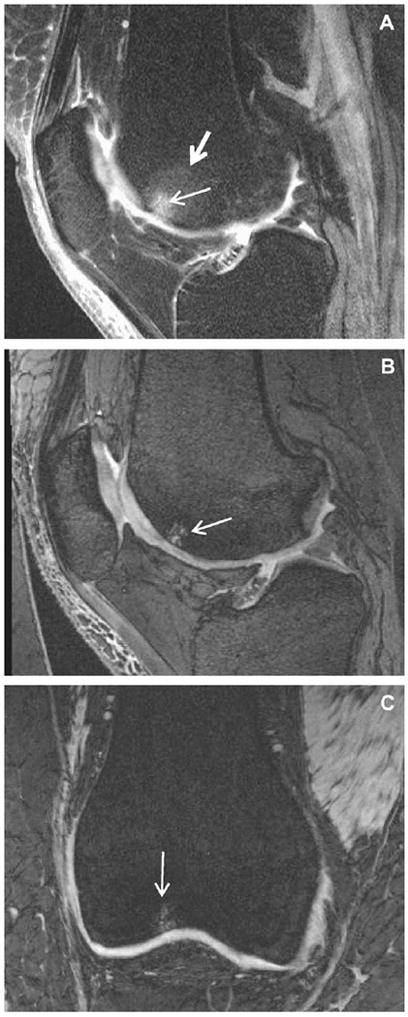
Sensitivity to subarticular BMA and cysts. SAG IW 2D TSE FS (A) shows both bone cysts (small arrow) and surrounding BMA (large arrow) in the femoral trochlea of this knee. However, both GRE scans, SAG 3D DESS WE (B) and COR 3D FLASH WE (C), of the same knee show only the cysts in this location.
Finally, SAG 2D MESE is included in the protocol to allow quantification of cartilage T2 relaxation times as well as to provide a range of non-fat-suppressed image contrasts (proton density [PD], IW, T2-weighted [T2W]) (Fig. 8) to improve assessment of many joint components, including ligaments and tendons, and the cartilage–bone interface. T2 relaxation times are believed to relate to the integrity of cartilage matrix, particularly collagen, and therefore to be potentially useful for evaluating early degeneration2,10,16.
Fig. 8.
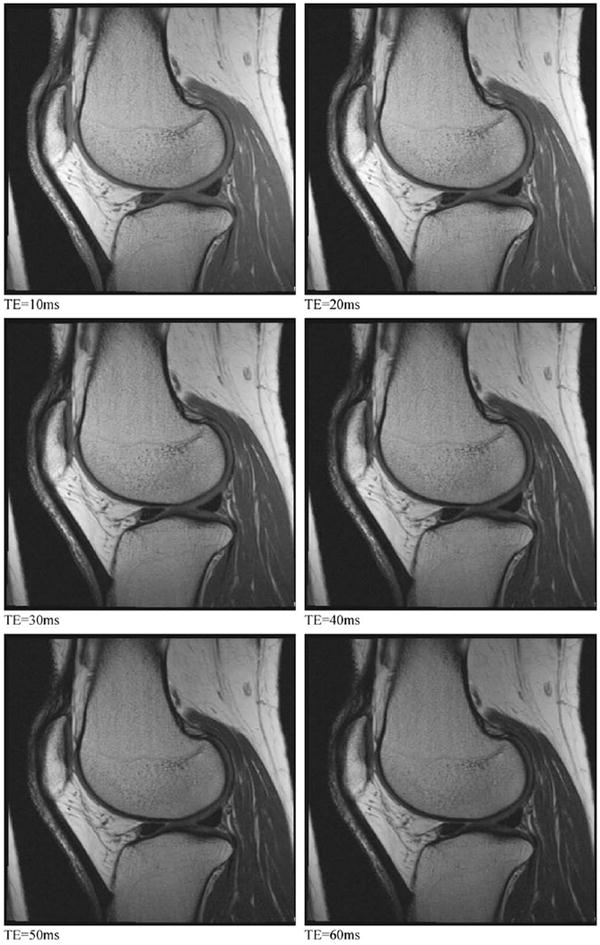
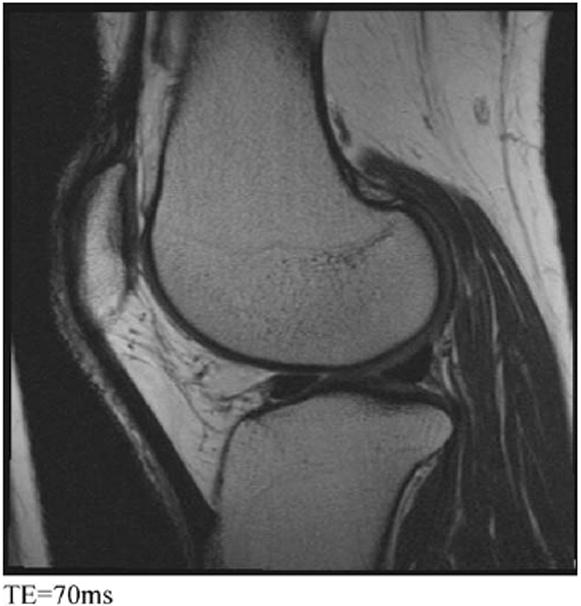
SAG 2D MESE. Multiple contrast acquisitions having progressively longer TEs can be combined to generate T2 maps of the articular cartilage and adjacent tissues. These seven images illustrate how changing the TE affects the relative signal and relative contrast among the different tissues in the knee.
Based on the acquisition time constraints, the OAI Imaging Working Group decided that it was not feasible to obtain all acquisitions in the final protocol on both knees. Accordingly, two acquisitions were excluded from the left knee examination (Table I) unless subjects had surgical hardware in the right knee, in which case, the two sequences would be performed on the knee without surgical hardware. Subjects with unilateral knee arthroplasty would have no MRI examinations of the operated knee.
COR T1W 3D FLASH WE was elected to be acquired on only one knee because SAG 3D DESS WE was considered to provide better contrast for delineating the interface between articular cartilage and a range of degenerated and normal tissues, as well as better contrast for evaluating menisci, ligaments and synovial effusion. In pilot scans of volunteer knees, the cartilage–capsule and cartilage–cartilage interfaces (Fig. 4) were often difficult to discriminate with 3D FLASH WE, but were well discriminated with 3D DESS WE. Both 3D FLASH WE and 3D DESS WE were felt to provide excellent delineation of osteophytes, however, the most important contribution of SAG 3D DESS WE in this protocol is high-resolution delineation of articular cartilage.
3D FLASH WE and 3D DESS WE have subsequently been cross-validated at 3 T for cartilage volume quantification28-35. The absolute value performance and test–retest precision of the direct SAG 3D DESS and the coronal MPR DESS image series were found to be comparable to that provided by coronal 3D FLASH in a cross-sectional analysis. These results, and the history of use in knee OA studies, support the decision to include COR T1W 3D FLASH WE in the OAI MRI protocol. However, insufficient acquisition time was available to perform this technique in both knees. Similarly, SAG 2D MESE was performed on only one of the two knees to meet imaging time constraints. Finally, the Imaging Working Group felt that axial MPR of the high-resolution SAG 3D DESS WE would provide sufficient visualization of the patellofemoral joint in a plane orthogonal to the cartilage plate, and therefore excluded direct axial imaging of either knee.
Total imaging time for the final OAI knee MRI protocol is 58 min (Table I), leaving 17 min for subject positioning, coil placement and for scan prescription to stay within the total examination time limit of 75 min for both knees.
Conclusion
In summary, the OAI MRI protocol offers a balance between the scientific and practical considerations in assessing the key articular structures and features believed to be involved in the development and progression of OA in the knee. While implementation of such a long and rigorous MRI protocol may not be feasible in the clinic or in all clinical trials, it is hoped that OAI will help guide the development of more streamlined protocols applicable for use at either 3 T or 1.5 T.
Several limitations of the protocol development process should be noted. We were limited to the acquisition and analysis methods which had been validated as of 2003. Although other MRI biomarkers that relate to cartilage matrix damage2,5,20,36,37 and subchondral trabecular architecture and bone volume14 have been described, the current OAI MRI protocol does not have sufficient imaging time to support those measurements and still satisfies its primary scientific objectives. Given time constraints for planning and startup of the OAI, the knee MRI protocol was finalized and implemented without formally assessing the performance characteristics of any biomarker measurements, such as cartilage volume, semi-quantitative assessments of articular lesions, etc. Since the OAI protocol was implemented, several studies of quantitative cartilage morphology using images acquired with the OAI protocol and addressing measurement precision, 3D FLASH vs 3D DESS comparisons and sensitivity to change have been published28-35,38,39. These performance parameters will continue to be important topics for investigation.
No external validation (compared to cadaver or arthroscopy) of cartilage measurements or assessments has been done using the OAI MRI protocol or any other acquisition protocol at 3 T. Key parameters (e.g., spatial resolution) of the 3D FLASH acquisitions included in the OAI protocol were identical to those previously validated at 1.5 T for quantitative cartilage measurements compared to cadaver knees12. Moreover, 3D FLASH acquisitions acquired with the same resolution at 1.5 T and 3 T gave identical precision for quantitative cartilage measurements23. We have no reason to believe that external validation results would differ between 3 T and 1.5 T acquisitions, but studies are needed to confirm this.
The OAI clinical data set as well as the radiographic and MRI images are available through the study’s public website (www.oai.ucsf.edu). It is hoped that the OAI MRI images will support not only the majority of analysis methods and imaging biomarker measurements that are currently available but many of those yet to be developed. We urge users of the OAI public data to employ a systematic framework, such as the OMERACT filter40, to the development and validation of imaging biomarkers of OA. The availability of these images to the general community of investigators should serve to accelerate research in OA and thus our understanding of this enigmatic disease and how to combat it.
Acknowledgments
This manuscript has been reviewed by the OAI Publications committee for scientific content and data interpretation. The research reported in this article was supported in part by contracts N01-AR-2-2261, N01-AR-2-2262 and N01-AR-2-2258 from NIAMS.
We are grateful to the Ohio State University team for acquiring the MRI images used for the study. The team that reviewed the pilot images was composed of (alphabetical order): BJ Dardzinski PhD, F Eckstein MD, D Goodwin MD, A Guermazi MD, R Jackson MD, M Nevitt PhD, S Totterman, MD PhD, L Martin BS RT (R) (MR), A Padua Jr RT, CG Peterfy MD PhD, J Pitts RT (R) (MR), E Schneider PhD, D White PhD, CS Winalski MD, J Yu MD. We are also grateful to Wendy Bommer RN (Cincinnati Children’s Hospital), Kim Toussant (Ohio State University), David Purdy PhD (Siemens Medical Solutions), Joseph Murphy-Bosch PhD (USA Instruments), Katherine Hall (Synarc Inc), Mary Hochman MD (Beth Israel Medical Center), Perry Renshaw MD, PhD (McLean Hospital, Brain Imaging Center), H. Cecil Charles PhD (Duke University Medical School).
The OAI Imaging Working Group was composed of the following individuals: Charles Peterfy MD PhD (chair), and in alphabetical order, Mostafa Analoui PhD, Fernando Boada PhD, Denise Davis RTR(MR), Bernard J. Dardzinski PhD, Felix Eckstein PhD, Jeff Evelhoch PhD, Faiza Fawaz-Estrup PhD MD FACP FACR, David Felson MD MPH, Garry E. Gold MD PhD, Doug Goodwin MD, Rao Gullapalli PhD, Marie-Pierre Hellio Le Graverand MD, Ali Guermazi MD, Manish Kothari PhD, Philipp K. Lang MD PhD MBA, Gayle Lester PhD, Larry Martin BS RT(R) (MR), Michael Nevitt PhD, Theodore Pellas VMD PhD, David Purdy PhD, Charles Resnick MD, Douglas Robertson MD, Erika Schneider PhD, Leena Sharma MD, Saara Totterman MD PhD, Glenn Tung MD, Joseph Yu MD, David White PhD, Katherine Wildy MD, Carl Winalski MD, and Thasia Wood-worth MD.
The OAI is a public–private partnership which comprised five contracts (N01-AR-2-2258; N01-AR-2-2259; N01-AR-2-2260; N01-AR-2-2261; N01-AR-2-2262) funded by the National Institutes of Health, a branch of the Department of Health and Human Services, and conducted by the OAI Study Investigators. Private funding partners include Merck Research Laboratories; Novartis Pharmaceuticals Corporation, GlaxoSmithKline; and Pfizer, Inc. Private sector funding for the OAI is managed by the Foundation for the National Institutes of Health. This manuscript has received the approval of the OAI Publications Committee based on a review of its scientific content and data interpretation.
Abbreviations
- COR
coronal
- CNR
contrast-to-noise ratio
- DESS
dual-echo steady state
- ETL
echo-train length
- FDA
food and drug administration
- FLASH
fast low-angle shot
- FOV
field of view
- FS
fat suppression
- GRE
gradient-echo
- IW
intermediate-weighted
- MEMS
multi-echo, multi-slice
- NEX
number of excitations
- MPR
multiplanar reformation
- PD
proton density
- SAG
sagittal
- SE
spin-echo
- SNR
signal-to-noise ratio
- SPGR
spoiled gradient-recalled echo
- T1W
T1-weighted
- T2W
T2-weighted
- TE
echo time
- TR
repetition time
- TSE
turbo spin-echo
- WE
water excitation
Footnotes
Conflict of interest None of the authors have any financial or other interests related to the manuscript submitted to Osteoarthritis and Cartilage that might constitute a potential conflict of interest.
References
- 1.Peterfy CG, Gold G, Eckstein F, Cicuttini F, Dardzinski B, Stevens R. MRI protocols for whole-organ assessment of the knee in osteoarthritis. Osteoarthritis Cartilage. 2006;14(Suppl A):A95–A111. doi: 10.1016/j.joca.2006.02.029. [DOI] [PubMed] [Google Scholar]
- 2.Gold GE, Burstein D, Dardzinski B, Lang P, Boada F, Mosher T. MRI of articular cartilage in OA: novel pulse sequences and compositional/-functional markers. Osteoarthritis Cartilage. 2006;14(Suppl A):A76–86. doi: 10.1016/j.joca.2006.03.010. [DOI] [PubMed] [Google Scholar]
- 3.Eckstein F, Cicuttini F, Raynauld JP, Waterton JC, Peterfy C. Magnetic resonance imaging (MRI) of articular cartilage in knee osteoarthritis (OA): morphological assessment. Osteoarthritis Cartilage. 2006;14(Suppl A):A46–75. doi: 10.1016/j.joca.2006.02.026. [DOI] [PubMed] [Google Scholar]
- 4.Eckstein F, Mosher T, Hunter D. Imaging of knee osteoarthritis: data beyond the beauty. Curr Opin Rheumatol. 2007;19(5):435–43. doi: 10.1097/BOR.0b013e328248b4be. [DOI] [PubMed] [Google Scholar]
- 5.Burstein D, Gray ML. Is MRI fulfilling its promise for molecular imaging of cartilage in arthritis? Osteoarthritis Cartilage. 2006;14(11):1087–90. doi: 10.1016/j.joca.2006.07.001. [DOI] [PubMed] [Google Scholar]
- 6.Waldschmidt JG, Rilling RJ, Kajdacsy-Balla AA, Boynton MD, Erickson SJ. In vitro and in vivo MR imaging of hyaline cartilage: zonal anatomy, imaging pitfalls, and pathologic conditions. Radiographics. 1997;17(6):1387–402. doi: 10.1148/radiographics.17.6.9397453. [DOI] [PubMed] [Google Scholar]
- 7.Potter HG, Linklater JM, Allen AA, Hannafin JA, Haas SB. Magnetic resonance imaging of articular cartilage in the knee. An evaluation with use of fast-spin-echo imaging. J Bone Joint Surg Am. 1998;80(9):1276–84. doi: 10.2106/00004623-199809000-00005. [DOI] [PubMed] [Google Scholar]
- 8.Woertler K, Strothmann M, Tombach B, Reimer P. Detection of articular cartilage lesions: experimental evaluation of low- and high-field-strength MR imaging at 0.18 and 1.0 T. J Magn Reson Imaging. 2000;11(6):678–85. doi: 10.1002/1522-2586(200006)11:6<678::aid-jmri15>3.0.co;2-y. [DOI] [PubMed] [Google Scholar]
- 9.Glaser C, Burgkart R, Kutschera A, Englmeier KH, Reiser M, Eckstein F. Femoro-tibial cartilage metrics from coronal MR image data: technique, test–retest reproducibility, and findings in osteoarthritis. Magn Reson Med. 2003;50(6):1229–36. doi: 10.1002/mrm.10648. [DOI] [PubMed] [Google Scholar]
- 10.Mosher TJ, Dardzinski BJ. Cartilage MRI T2 relaxation time mapping: overview and applications. Semin Musculoskelet Radiol. 2004;8(4):355–68. doi: 10.1055/s-2004-861764. [DOI] [PubMed] [Google Scholar]
- 11.Eckstein F, Glaser C. Measuring cartilage morphology with quantitative magnetic resonance imaging. Semin Musculoskelet Radiol. 2004;8(4):329–53. doi: 10.1055/s-2004-861579. [DOI] [PubMed] [Google Scholar]
- 12.Graichen H, von Eisenhart-Rothe R, Vogl T, Englmeier KH, Eckstein F. Quantitative assessment of cartilage status in osteoarthritis by quantitative magnetic resonance imaging: technical validation for use in analysis of cartilage volume and further morphologic parameters. Arthritis Rheum. 2004;50(3):811–6. doi: 10.1002/art.20191. [DOI] [PubMed] [Google Scholar]
- 13.Cicuttini FM, Wluka AE, Wang Y, Stuckey SL. Longitudinal study of changes in tibial and femoral cartilage in knee osteoarthritis. Arthritis Rheum. 2004;50(1):94–7. doi: 10.1002/art.11483. [DOI] [PubMed] [Google Scholar]
- 14.Eckstein F, Burstein D, Link TM. Quantitative MRI of cartilage and bone: degenerative changes in osteoarthritis. NMR Biomed. 2006;19(7):822–54. doi: 10.1002/nbm.1063. [DOI] [PubMed] [Google Scholar]
- 15.Peterfy C, Woodworth T, Altman R. Workshop for consensus on osteoarthritis imaging: MRI of the knee. Osteoarthritis Cartilage. 2006;14:A44–5. [Google Scholar]
- 16.Dardzinski BJ, Mosher TJ, Li S, Van Slyke MA, Smith MB. Spatial variation of T2 in human articular cartilage. Radiology. 1997;205(2):546–50. doi: 10.1148/radiology.205.2.9356643. [DOI] [PubMed] [Google Scholar]
- 17.Goodwin DW, Dunn JF. MR imaging and T2 mapping of femoral cartilage. AJR Am J Roentgenol. 2002;178(6):1568–9. doi: 10.2214/ajr.178.6.1781568. author reply 1569-1570. [DOI] [PubMed] [Google Scholar]
- 18.Bottomley PA, Foster TH, Argersinger RE, Pfeifer LM. A review of normal tissue hydrogen NMR relaxation times and relaxation mechanisms from 1–100 MHz: dependence on tissue type, NMR frequency, temperature, species, excision, and age. Med Phys. 1984;11(4):425–48. doi: 10.1118/1.595535. [DOI] [PubMed] [Google Scholar]
- 19.Gold GE, Han E, Stainsby J, Wright G, Brittain J, Beaulieu C. Musculoskeletal MRI at 3.0 T: relaxation times and image contrast. AJR Am J Roentgenol. 2004;183(2):343–51. doi: 10.2214/ajr.183.2.1830343. [DOI] [PubMed] [Google Scholar]
- 20.Gray ML, Burstein D, Kim YJ, Maroudas A. Magnetic resonance imaging of cartilage glycosaminoglycan: basic principles, imaging technique, and clinical applications. J Orthop Res. 2007 doi: 10.1002/jor.20482. [DOI] [PubMed] [Google Scholar]
- 21.Hardy PA, Recht MP, Piraino D, Thomasson D. Optimization of a dual echo in the steady state (DESS) free-precession sequence for imaging cartilage. J Magn Reson Imaging. 1996;6(2):329–35. doi: 10.1002/jmri.1880060212. [DOI] [PubMed] [Google Scholar]
- 22.Eckstein F, Sittek H, Milz S, Putz R, Reiser M. The morphology of articular cartilage assessed by magnetic resonance imaging (MRI). Reproducibility and anatomical correlation. Surg Radiol Anat. 1994;16(4):429–38. doi: 10.1007/BF01627667. [DOI] [PubMed] [Google Scholar]
- 23.Eckstein F, Charles HC, Buck RJ, Kraus VB, Remmers AE, Hudelmaier M, et al. Accuracy and precision of quantitative assessment of cartilage morphology by magnetic resonance imaging at 3.0 T. Arthritis Rheum. 2005;52(10):3132–6. doi: 10.1002/art.21348. [DOI] [PubMed] [Google Scholar]
- 24.Tamez-Pena J, Barbu-McInnes M, Buck R, Totterman S. Cross validation of fused SPGR-GRE T2* MRI at 1.5 T and 3.0 T for morphological cartilage analysis. Osteoarthritis and Cartilage. 2005;12(Suppl 2):S1–2. [Google Scholar]
- 25.Peterfy C. Rheumatology. Philadelphia: Mosby; 1998. Medial knee pain in the aging patient; pp. 8.12.8–8.12.9. [Google Scholar]
- 26.Felson DT, Chaisson CE, Hill CL, Totterman SM, Gale ME, Skinner KM, et al. The association of bone marrow lesions with pain in knee osteoarthritis. Ann Intern Med. 2001;134(7):541–9. doi: 10.7326/0003-4819-134-7-200104030-00007. [DOI] [PubMed] [Google Scholar]
- 27.Felson DT, McLaughlin S, Goggins J, LaValley MP, Gale ME, Totterman S, et al. Bone marrow edema and its relation to progression of knee osteoarthritis. Ann Intern Med. 2003;139(5 Pt 1):330–6. doi: 10.7326/0003-4819-139-5_part_1-200309020-00008. [DOI] [PubMed] [Google Scholar]
- 28.Peterfy C, Schneider E, White D, Guermazi A, Zhao J, Kothari M, et al. Cartilage volume quantification with 3 tesla MRI: comparison of 3D-DESS with 3D-FLASH imaging sequences. Osteoarthritis Cartilage. 2004;12(SB):1. [Google Scholar]
- 29.Tamez-Pena J, Barbu-McInnes M, Jackson R, Yu J, Eaton CB, Totterman S. Bone–cartilage contrast ratio (BCCR) from MRI DESS sequences: signal-based quantitative biomarker in OA studies. ACR. 2005;92 [Google Scholar]
- 30.Barbu-McInnes M, Tamez-Pena J, Jackson R, Yu J, Eaton CB, Totterman S. Subject specific bone atlas: segmentation applications and validation on OA subjects. MICCAI. 2005;P1-6(S-T1):24. [Google Scholar]
- 31.Tamez-Pena J, Barbu-McInnes M, Jackson R, Yu J, Eaton CB, Totterman S. Cartilage quantification: comparison between 3 T DESS and 3 T FLASH sequences. Osteoarthritis and Cartilage. 2005;12(Suppl 2: S1-2):247. [Google Scholar]
- 32.Eckstein F, Hudelmaier M, Wirth W, Kiefer B, Jackson R, Yu J, et al. Double echo steady state magnetic resonance imaging of knee articular cartilage at 3 Tesla: a pilot study for the osteoarthritis initiative. Ann Rheum Dis. 2006;65(4):433–41. doi: 10.1136/ard.2005.039370. [DOI] [PMC free article] [PubMed] [Google Scholar]
- 33.Duryea J, Neumann G, Brem MH, Koh W, Noorbakhsh F, Jackson RD, et al. Novel f ast semi-automated software to segment cartilage for knee MR acquisitions. Osteoarthritis Cartilage. 2007;15(5):487–92. doi: 10.1016/j.joca.2006.11.002. [DOI] [PMC free article] [PubMed] [Google Scholar]
- 34.Eckstein F, Kunz M, Hudelmaier M, Jackson R, Yu J, Eaton CB, et al. Impact of coil design on the contrast-to-noise ratio, precision, and consistency of quantitative cartilage morphometry at 3 Tesla: a pilot study for the osteoarthritis initiative. Magn Reson Med. 2007;57(2):448–54. doi: 10.1002/mrm.21146. [DOI] [PubMed] [Google Scholar]
- 35.Eckstein F, Kunz M, Schutzer M, Hudelmaier M, Jackson RD, Yu J, et al. Two year longitudinal change and test–retest-precision of knee cartilage morphology in a pilot study for the osteoarthritis initiative. Osteoarthritis Cartilage. 2007;15(11):1326–32. doi: 10.1016/j.joca.2007.04.007. [DOI] [PMC free article] [PubMed] [Google Scholar]
- 36.Gray ML, Eckstein F, Peterfy C, Dahlberg L, Kim YJ, Sorensen AG. Toward imaging biomarkers for osteoarthritis. Clin Orthop Relat Res. 2004;Suppl 427:S175–81. doi: 10.1097/01.blo.0000144972.50849.d9. [DOI] [PubMed] [Google Scholar]
- 37.Borthakur A, Mellon E, Niyogi S, Witschey W, Kneeland JB, Reddy R. Sodium and T1rho MRI for molecular and diagnostic imaging of articular cartilage. NMR Biomed. 2006;19(7):781–821. doi: 10.1002/nbm.1102. [DOI] [PMC free article] [PubMed] [Google Scholar]
- 38.Hunter D, Niu J, Zhang Y, Totterman S, Tamez J, Dabrowski C, et al. Change in cartilage morphometry: a sample of the progression cohort of the osteoarthritis initiative. Arthritis Rheum. 2007;56(9S):S131. doi: 10.1136/ard.2007.082107. [DOI] [PMC free article] [PubMed] [Google Scholar]
- 39.Eckstein F, Maschek S, Wirth W, Wyman B, Hudelmaier M, Nevitt M, et al. Change in femorotibial cartilage volume and subregional cartilage thickness over 1 year – data from the osteoarthritis initiative progression subcohort. Arthritis Rheum. 2007;56(9S):S283. [Google Scholar]
- 40.Lassere MN. A users guide to measurement in medicine. Osteoarthritis Cartilage. 2006;14(Suppl A):A10–3. doi: 10.1016/j.joca.2006.02.021. [DOI] [PubMed] [Google Scholar]