

Abstract
The majority of meningiomas are benign tumors associated with favorable outcomes; however, the less common aggressive variants with unfavorable outcomes often recur and may be due to sub-populations of less-differentiated cells residing within the tumor. These sub-populations of tumor cells have tumor-initiating properties and may be isolated from heterogeneous tumors when sorted or cultured in defined medium. We report the isolation and characterization of a population of tumor-initiating cells derived from an atypical meningioma.
We identify a tumor-initiating population from an atypical meningioma, termed meningioma-initiating cells (MICs). These MICs self-renew, differentiate, and can recapitulate the histological characteristics of the parental tumor when transplanted at 1,000 cells into the flank regions of athymic nude mice. Immunohistochemistry reveals stem-like protein expression patterns similar to neural stem and progenitor cells (NSPCs) while genomic profiling verified the isolation of cancer cells (with defined meningioma chromosomal aberrations) from the bulk tumor. Microarray and pathway analysis identifies biochemical processes and gene networks related to aberrant cell cycle progression, particularly the loss of heterozygosity of tumor suppressor genes CDKN2A (p16INK4A), p14ARF, and CDKN2B (p15INK4B). Flow cytometric analysis revealed the expression of CD44 and activated leukocyte adhesion molecule (ALCAM/CD166); these may prove to be markers able to identify this cell type. The isolation and identification of a tumor-initiating cell population capable of forming meningiomas demonstrates a useful model for understanding meningioma development. This meningioma model may be used to study the cell hierarchy of meningioma tumorogenesis and provide increased understanding of malignant progression.
Keywords: Atypical meningioma, microarray, progenitor cell, malignant progression, molecular genetics
Introduction
Meningiomas are common intracranial neoplasms that account for approximately 30% of all reported brain tumors (CBTRUS: 2007–2008 Statistical report: primary brain tumors in the United States). Most meningiomas are attached to the dura and press on the brain or spinal cord through the arachnoid, although unusual examples can arise within the brain’s ventricles or in the leptomeninges without a dural attachment. These tumors express a phenotype similar to meningothelial (arachnoid cap) cells both histologically and immunohistochemically, and the majority are sporadic, slow growing, and are classified as benign (WHO grade I). However, more aggressive variants such as atypical (WHO grade II) and anaplastic (WHO grade III) meningiomas may express a mesenchymal-like phenotype, and these often recur and invade the brain following initial removal, or even disseminate to distant sites (WHO grade III) resulting in a lower median survival compared to their benign counterparts (Willis et al., 2005). Unusual examples of meningiomas are associated with genetic syndromes (e.g., Neurofibromatosis Type II, NF2) or are induced by radiation (Simon et al., 2007). Whole genome gene expression profiling has provided insight into the genetic alterations and pathway dysregulation of meningiomas, providing a better understanding of the molecular signature for meningioma variants. Mutations and aberrant DNA methylation patterns in the well-studied tumor suppressor gene NF2, located on chromosome 22, have been implicated in more than half of spontaneous meningiomas suggesting a role for NF2 involvement in meningiomas and as a target for therapy (Hanemann, 2008; Liu et al., 2005). However, additional genetic components contribute to the more aggressive meningioma variants and include frequent chromosomal aberrations such as the loss of chromosomal regions 1p, 6q, 10, 14q, 18q, 22q, or the gain of 1q, 9q, 12q, 15q, 17q and 20q (Keller et al., 2009; Watson et al., 2002; Weber et al., 1997; Wrobel et al., 2005). These aberrations include the inactivation of cell cycle genes either due to homozygous deletion or truncated expression due to mutation, and may contribute to the malignant growth and progression of meningiomas. For example, deletions in tumor suppressor genes CDKN2A (p16INK4A), p14ARF, and CDKN2B (p15INK4B) have been investigated in high-grade meningiomas and are known to cause cell-cycle dysregulation at the G1/S phase checkpoint (Bostrom et al., 2001; Simon et al., 2007).
Over the past few decades, many studies have identified and characterized small populations of cells within tumors, termed cancer stem cells (CSCs) or tumor-initiating cells (TICs) with stem-like properties. According to the cancer stem cell hypothesis, sub-populations of cells reside within tumors to regenerate and sustain the heterogeneity of the tumor and its growth. CSCs share properties of neural stem/progenitor cells (NSPCs) with regard to their in vitro properties of self-renewal and differentiation, in vivo tumorigenic capabilities, enrichment in defined culture conditions, and their identification based on the molecular markers they express (Dalerba et al., 2007; Fang et al., 2005; Lapidot et al., 1994; Singh et al., 2003; Singh et al., 2004; Zhang et al., 2008).
CSCs were first described in acute myeloid leukemia and are now identified in a variety of tumors (Hill and Wu, 2009; Lapidot et al., 1994). Identification of CSCs has been an active area of research in cancer biology and understanding these cells may be a first step toward targeting the underlying causes of recurrent tumors. In the brain, CD133 is a putative though not exclusive stem cell marker used to identify CSCs and is associated with NSPCs, mesenchymal stem cells, progenitor cells, and hematopoietic stem cells. Additionally, CD133 is expressed by many tumor types such as carcinomas of colon, liver, lung, ovary, pancreas and prostate (Fabian et al., 2009). The initiating cell populations or CSCs within tumors and tissues have been identified based on the presence or absence of various combinations of molecular markers such as: CD44+/CD24− for breast cancer, CD44+/CD24+ for pancreatic cancer, CD44+/CD133+/− CD166+ for colon cancer, CD44+/ CD133+/ Sca-1+/ CD117+ for prostate cancer, CD44+/ CD117+ for ovarian cancer, CD20+ for melanoma, and CD90+ for liver and lung (Chu et al., 2009; Fabian et al., 2009; Fang et al., 2005; Zhang et al., 2008). It is important to note that the overlap of markers and the lack of consensus in various studies regarding the combination of markers to identify progenitor cell populations within tumors are due to tissue-specificity, and can be attributed to the heterogeneous nature of the primary tumor, the culture medium, or the developmental state of the cells.
Most recently, Hueng et al. reported the isolation of tumor stem-like cells from human meningiomas (Hueng et al., 2010). Similar to their findings, we report in this study the establishment of a cell line with properties of TICs, derived from an atypical meningioma. These meningioma-initiating cells (MICs) have been enriched using serum-free cell culture medium in the presence of mitogens, initially designed for the isolation and propagation of NSPCs and TICs in vitro (Reynolds and Weiss, 1992; Singh et al., 2003). These MICs exhibit a capacity for self-renewal, differentiation, and recapitulate hallmarks of the parental tumor when transplanted into athymic nude mice. Gene expression microarray analysis in conjunction with flow cytometry and fluorescent immunohistochemistry revealed CD133, CD44, and CD166 surface marker expression as properties of these cells while Array Comparative Genomic Hybridization (aCGH) identified genomic commonalities of the MICs with high-grade meningiomas. Additionally, we provide evidence supporting the presence of MICs found early in the hierarchal lineage of an atypical meningioma and establish that this cell line may be used a model for meningioma tumorigenesis.
Materials and Methods
Tissue samples from the primary atypical meningioma and NSPC samples were provided via written informed consent under appropriate Institutional Review Board-approved protocols (tissue banking #1044138) of the Department of Surgery, Division of Neurological Surgery, and Division of Pathology and Anatomical Sciences, University of Missouri School of Medicine. The meningioma tumor was located in the left fronto-parietal area, attached to the sagittal sinus and upon removal, was placed in serum-free culture medium as described below. The NSPC sample was obtained from telencephalon and diencephalon regions of the cerebral hemispheres from a fresh fetal autopsy at 17 weeks gestational age.
Cell culture
Fresh tissue from the atypical meningioma and cerebral hemisphere samples were mechanically dissociated, washed with PBS, and red blood cells removed with Histopaque (Sigma, St. Louis, MO). To promote growth of progenitor cells, the cells were grown as non-adherent cultures in uncoated petri dishes in serum-free growth medium containing DMEM-F12 supplemented with 20ng/ml EGF, 20ng/ml bFGF 1:50 B27 supplement, 1:100 N2 supplement (all Invitrogen, Paisley, UK), and 10ng/ml LIF (Chemicon, Hampshire, UK) as a permissive factor to facilitate the proliferation of progenitor cells, hereafter known as “DN2L medium” (i.e. mitogen-containing medium). For differentiation experiments, the cells were treated as described by the Human Neural Stem Cell Characterization Kit (Chemicon).
Flow Cytometry
For flow cytometry analysis, cells were dissociated and labeled according to the protocols specified by the manufacturer of the antibodies: ALCAM (CD166)-PE, IgG1 Isotype Control PE (both R&D Systems, Minneapolis, MN, USA), CD44-APC, and IgG2bK Isotype Control APC (both BD Biosciences, San Jose, CA, USA). Cells were analyzed using a Beckman Coulter CyAn ADP flow cytometer and the data was analyzed with Summit software v4.3 (Dako, Ely, UK).
Animal Xenografts
Animal studies were performed in accordance with approved protocols (University of Missouri protocol 4219 and Medical College of Georgia protocol AUP: 08-07-090) outlined by the Institutional Animal Care and Use Committee of the University of Missouri and the Medical College of Georgia. For in vivo tumorigenicity studies, cells grown in DN2L medium were resuspended at varying concentrations of 1,000, 10,000, 100,000, and 5×10⁶ cells in 150 µl 1:1 DN2L media/Matrigel (BD Biosciences), and injected subcutaneously into the flank regions of 6–7 week old female athymic nude mice (Hsd: Athymic Nude Foxn1nu; Harlan, Indianapolis, IN, USA). This flank model induction of meningioma tumors follows pre-established methods (Ragel et al., 2008). Three mice were used in each group and each mouse was injected twice in the left and right flank regions for six injections per group. Mice were sacrificed at 12 weeks post-transplant and at a tumor diameter of 1cm. Portions of the xenograft were snap frozen (for DNA isolation and cryosectioning), embedded in paraffin (for histology), or dissociated and placed in DN2L medium (for MIC enrichment and flow cytometry analysis).
Histology and Immunohistochemistry
For histology, tumor specimens were processed routinely for standard H&E staining and histologic assessment. Primary antibodies used for immunohistochemistry were: anti-Vimentin, anti-EMA, anti-GFAP, anti-Synaptophysin (all Dako), NF (RMDO20) (Invitrogen), anti-NeuN (Chemicon), anti-Nestin (Santa Cruz, Santa Cruz, CA, USA). Tumor cell clusters and neurospheres were embedded in OCT, sectioned, and labeled with antibody as previously described (Bleau et al., 2008). Antibodies used for fluorescence studies were: anti-Nestin, anti-Sox2, anti-βIII-tubulin, anti-GFAP, anti-Neurofilament 150kd (all Chemicon), anti-CD133, anti-CD166, (both Abcam), anti-Vimentin (Dako), anti-Snai1, and anti-Twist1 (both ABNOVA), GαM AF-488, GαR AF-546, and GαR AF-488 (all Invitrogen). Sections were counterstained with Vectashield (Vector Laboratories Inc., Burlingame, CA, USA) mounting medium containing Dapi. Negative controls were processed as described above with no primary antibody.
Imaging
Brightfield images of cultured cells were captured with a Nikon D100 camera through an Olympus CKx41 upright microscope. Histology photomicrographs were captured with an Optronics Macrofire digital photomicroscope camera mounted on an Olympus BX51 microscope. Confocal images were captured with a Zeiss 510 META NLO and a Zeiss 5 live microscope and processed with LSM 5 Image Examiner software.
Real Time RT-PCR
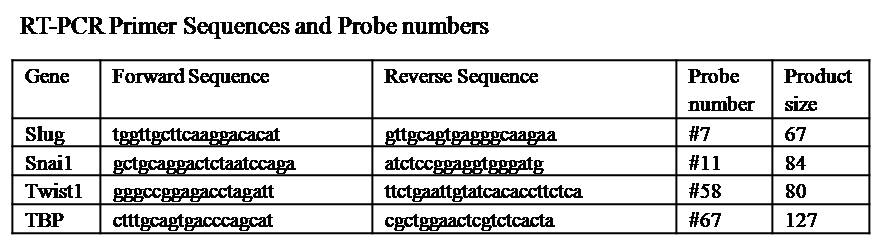
Total RNA was isolated using RNeasy mini kit (Qiagen, Valencia, CA, USA) and treated with DNase I. Two micrograms total RNA was reverse-transcribed into cDNA using High Capacity cDNA Reverse Transcription Kit (Applied Biosystems, Foster City, CA, USA). PCR primers were synthesized by Integrated DNA Technologies (Integrated DNA Technologies, Coralville, IA, USA). Universal Probe #7, 11, 58 and 67 (Roche, Indianapolis, IN, USA) was used for the real time PCR assay and real time PCR was carried out using LightCycler 480 (Roche). The primers and probes were used at a final concentration of 500 nM and 100nM, respectively. The housekeeping gene TBP was used as control. A table containing the RT-PCR primer sequences and probe numbers can be found at Supplementary Information S1.
Microarrays
Primary neural and tumor tissue was disrupted using the TissueLyser apparatus (Qiagen) and total RNA and DNA were isolated using RNeasy and DNeasy mini kits (Qiagen). Copy number (CN) and loss of heterozygosity (LOH) profiles were identified using Affymetrix Human SNP 5.0 arrays (Affymetrix, Inc., Santa Clara, CA, USA). Data for gene expression was derived from Illumina Human WG-6 v3 Expression BeadChips (Illumina Inc., San Diego, CA, USA). Both platforms are whole genome arrays and assays were performed in accordance with the respective manufacturer’s protocol.
Data Acquisition and Analysis
CN, LOH, and gene expression analysis was performed using Partek® Genomics Suite (Partek, St. Louis, MO, USA). Briefly, genetic CN events from Affymetrix chips were reported based on CN values using Partek’s Genomic Segmentation algorithm. Single nucleotide polymorphism (SNP) genotype data was generated through Affymetrix’s Genotyping Console then imported into Partek and compared against a 270 HapMap genotype sample dataset. Gene expression values from Illumina chips were generated by ANOVA (analysis of variance) to create a table of differentially expressed genes (as compared to the NSPCs), then exported to Ingenuity’s Pathway Analysis (IPA) platform for functional network and pathway analysis (Ingenuity® Systems, Redwood, CA, USA). The differentially expressed genes were overlaid onto a global molecular network developed from information contained in the Ingenuity Pathways Knowledge Base, a repository of molecular interactions, events, and associations used for pathway construction. Illumina’s BeadStudio module was used to generate histograms of the average signal. For a detailed description of the microarray data generation and analysis, see Supplementary Information S2. The data discussed in this publication have been deposited in NCBI's Gene Expression Omnibus and are accessible through GEO Series accession number GSE22577 (http://www.ncbi.nlm.nih.gov/geo/query/acc.cgi?acc=GSE22577).
Results
Cells derived from primary atypical meningiomas self-renew and differentiate along neuronal and glial lines in vitro
Fresh primary atypical meningioma specimens were placed in mitogen-containing DN2L media and sub-cultured weekly for many months. After the first month in culture, only non-adherent cells remained in the dish and aggregated as small clusters of cells (Fig. 1A top), unlike the tight spherical formations normally associated with NSPC neurospheres (data not shown). The meningioma cells rapidly proliferated and expressed NSPC molecular markers Nestin, SRY-related HMG box gene 2 (Sox2), CD133 (Fig. 1B, left and middle), and expressed the intermediate filament proteins Vimentin and Glial Fibrillary Acidic Protein (GFAP) (Fig. 1B, right). Upon dissociation and plating on laminin-coated slides in the absence of mitogens, we observed outgrowth of cellular processes and morphologies consistent with a differentiated cellular phenotype (Fig. 1A, bottom). The cells were immunoreactive for the mature neuronal markers Neurofilament-M (NF), βIII-tubulin (Fig. 1C, left and middle), and retained the expression of Vimentin and GFAP (Fig. 1C, right). The expression of neural stem cell markers (Nestin, Sox2, and CD133) and mature neuronal markers (βIII-tubulin, NF, and GFAP) seen here for the meningioma-derived cells was similar to the stem cell marker staining patterns seen in undifferentiated NSPCs, and NSPCs when differentiated (data not shown). These results indicate that these tumor-derived meningioma-initiating cells (MICs), can self-renew, and following withdrawal of mitogens, differentiate into neural lineages similar to brain-progenitor cell-types.
Figure 1.
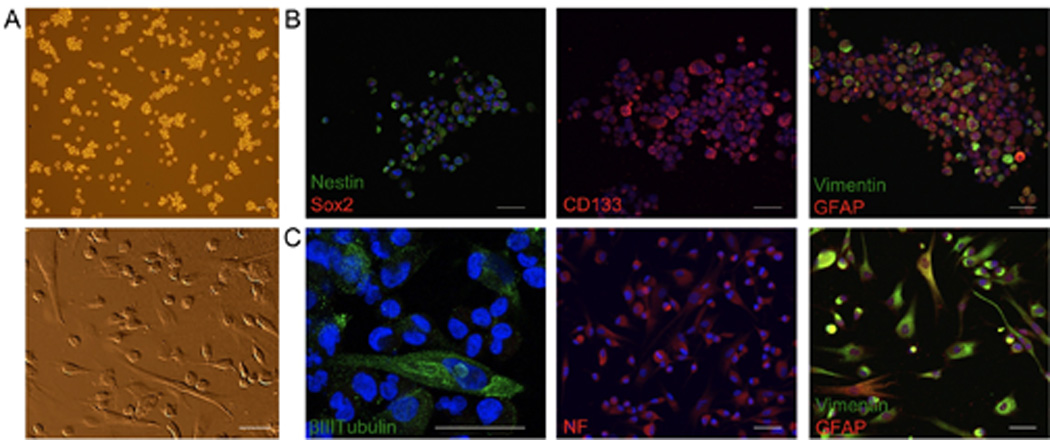
Mitogen withdrawal induces differentiation of MICs. A, MICs grow as non-adherent asymmetrical clusters of cells (top), and following mitogen withdrawal exhibit morphologies similar to neurons and astrocytes (bottom). B, the majority of undifferentiated cells were immunoreactive for neural stem/progenitor cell markers Nestin, Sox2 (left), CD133 (middle), and the intermediate filament proteins Vimentin and GFAP (right). C, adherent cultures expressed the mature cell markers βIII-tubulin (left), NF (middle), and retained the expression of Vimentin and GFAP (right). Nuclei were counterstained with DAPI (blue). Scale bars for all images 50µm.
MICs are tumorigenic and histologically resemble the primary tumor
The primary tumor was a dural-based frontoparietal convexity mass excised at surgery (Supplementary Fig. S3). Sections of tumor showed a meningioma with lobular growth patterns containing epithelioid clusters and sheets of cells, sharply demarcated from the underlying cerebral cortex (Fig. 2A). The tumor had a variety of histological features characteristic of meningiomas, including classical meningotheliomatous meningioma with areas of sheet-like growth of small to mid-size bland monotonous cells, and other areas with markedly pleiomorphic cells with large nuclei and large prominent nucleoli. Several foci contained small cells with hyperchromatic nuclei and scant cytoplasm (Fig. 2A, top, left-right). There were zones with considerable fibrous tissue between the cells, particularly in the more pleiomorphic areas. The tumor showed areas with multiple mitotic figures, which in these areas exceeded 4 mitotic figures in 10 high power (400×) fields. Additionally, the tumor focally invaded the underlying brain.
Figure 2.

Xenograft of MICs recapitulates features of primary parental tumor. A, top panel, representative H&E staining of the parental atypical meningioma exhibiting a variety of histological patterns including areas of atypical cluster formation (left), highly atypical areas (middle), and small anaplastic cells (right). A, bottom panel, immunolabeling shows strong, diffuse immunopositivity in virtually all tumor cells for Vimentin (left), variable EMA staining (middle), and tumor cells without GFAP staining (right) with immunopositivity in adjacent brain. B, top left, xenograft tumors show a poorly differentiated tumor with focal lobulation and nodularity (top middle) consistent with the original meningioma, including areas with whorl formation (top right). B, bottom left, mouse xenograft tumor labeled immunopositive for Vimentin, EMA (bottom middle), GFAP (bottom right). Scale bars for all images 50µm.
Primary tumor cells were strongly and diffusely positive for Vimentin (Fig. 2A, bottom, left), in patches had a delicate surface membrane immunopositivity for Epithelial Membrane Antigen (EMA) (Fig. 2A, bottom, middle), was GFAP negative (Fig. 2A, bottom, right), and in a small minority of tumor cells had positive nuclear immunoreactivity for Progesterone Receptors (data not shown), all consistent with an atypical meningioma diagnosis.
To investigate the tumorigenicity of MICs, we examined whether a smaller numbers of MICs were capable of forming tumors in immunodeficient mice. MICs were grown non-adherently in DN2L medium and implanted subcutaneously in the flank regions of athymic nude mice. For mice receiving injections of only 1000 cells, tumors were observed in all three athymic nude mice and in four out of six injections with tumor latencies of 84 days (12 weeks), similar to TICs of other malignancies.
Correspondingly, injections of 104, 105, and 106, cells were also tumorigenic in nine of nine mice with shorter tumor latencies (4–7 weeks). All subcutaneous xenograft tumors derived had histological features similar to the primary tumor, such as areas with whorl formation in animals transplanted with 1,000 cells, and areas that resembled the more atypical areas of the parental tumor including pleiomorphic nuclei and mitotic figures (Fig. 2B, top left-right) in animals receiving higher concentrations of cells. The xenograft had diffuse areas of Vimentin positivity and regions of patchy EMA cell-surface positivity similar to the primary parental tumor (Fig. 2B bottom, left, middle). In addition, there were areas of patchy GFAP immunopositivity in tumor cells, consistent with the immunofluorescence results (Fig. 2B bottom, right).
ALCAM/CD166 and CD44 are expressed before and after xenograft
Analysis of the gene expression profile of the non-adherent cultured MICs revealed that hyaluronate receptor (CD44) and activated leukocyte cell adhesion molecule (ALCAM or CD166) is upregulated in the MICs as compared to the NSPCs (GEO Series accession number GSE22577). To investigate whether these markers might be enriched because of placement in the DN2L medium, we tested whether this expression profile is present in the primary tumor and could be re-isolated, or re-enriched following xenotransplantation. Fluorescent IHC revealed that the primary tumor contained scattered cells that were immunopositive for the expression of ALCAM (Fig. 3A left), whereas nearly all the cells were ALCAM positive when cultured in the DN2L medium pre-transplant (Fig. 3A middle). Flow cytometric analysis confirmed that the cells grown in the DN2L medium homogeneously express the surface markers CD44 and ALCAM pre-transplantation (Fig. 3B left). After xenograft removal, the cells were dissociated, and placed again in DN2L medium to re-isolate the non-adherent only population of cells. Fluorescent immunohistochemisty indicated that the majority of cells post-transplantation expressed ALCAM (Fig. 3A right), and flow analysis revealed the uniform expression of ALCAM as well as CD44 in nearly all of the cells (Fig. 3B right). The lower expression level of ALCAM in the primary parental tumor as compared to the pre-transplant cells suggests the enrichment in culture of an ALCAM positive population of cells (derived from the primary tumor), and that this population was maintained or reenriched in DN2L medium post-transplant.
Figure 3.

Fluorescent immunohistochemistry and flow cytometric analysis show that culture medium enrich for an ALCAM+, CD44+ subpopulation of cells. A, the primary tumor show areas of scattered ALCAM expression (left) and increased abundance of MICs expressing ALCAM pre-transplant (middle) and post-transplant (right). B, Flow analysis reveals the near uniform expression of CD44 and ALCAM pre- and post-transplant. Nuclei were counterstained with DAPI (blue). Scale bars for all images 50µm.
MICs grown in culture, and derived from the xenograft show a genomic profile similar to that of the primary parental tumor
Deletions or mutations in the NF2 gene are implicated in the tumorigenesis of many meningiomas. To test the NF2 gene status, the MICs grown in DN2L medium, as well as a sample from the paraffin-embedded primary tumor were analyzed to define specific cytogene changes in these cells (Testing done in the Neurofibromatosis Laboratory of Massachusetts General Hospital, Dr. Xie Win). Analysis of the coding regions of exons 1 through 17 showed no deletion of the NF2 gene in either the primary tumor specimen or the cultured cells derived from it, and no mutations in a limited exon analysis (data not shown). We performed aCGH and SNP genotyping analysis to determine CN and LOH for four different samples: 1) the primary parental atypical meningioma, 2) the pre-transplant MICs grown in the DN2L medium, 3) the primary xenograft, and 4) the post-transplant MICs that had been placed in the DN2L medium (Fig. 4A). An LOH event is indicative of the genotype expressed, whereas the loss or gain of CN may influence the differential gene expression. We used Partek software to perform an allele-specific analysis of all the samples and confirmed that the MICs were derived from the parental tumor (GEO Series accession number GSE22577). The chromosomal aberrations of the primary tumor (Fig. 4A top left) included gains in regions of chromosomes 3, 7, 9, and 11. The MICs pre-transplant (Fig. 4A bottom left), subsequent xenograft (Fig. 4A top right), and post-transplant MICs (Fig. 4A bottom right) all depicted gains in regions of chromosomes 3, 7, and 9. Unlike the primary tumor, the MICs pre-transplant, xenograft, and MICs post-transplant, showed gains in regions of chromosomes 1 and 17, and loss of amplification in regions of chromosome 11. There were minor regions with chromosomal deletions, generally consistent in all four samples. Of interest was region 9p21.3, the location of CDKN2A (p16INK4A), p14ARF, and CDKN2B (p15INK4B), well-known tumor suppressor genes and regulators of cell cycle progression (Fig. 4Bleft). Alterations at this locus are evident in a minority of atypical meningiomas (WHO grade II) and a majority of anaplastic meningiomas (WHO grade III) (Bostrom et al., 2001). SNP genotyping and copy number analysis revealed a single copy LOH event for all three genes in the primary atypical meningioma, whereas the subsequent samples showed homozygous deletions (complete loss) (Fig. 4B right).
Figure 4.

Genome-wide copy number analysis suggests that the MICs are a subpopulation derived from the primary parental tumor. A, aCGH graphs represent genome-wide gains (red) and loss (blue) with the chromosomes distributed on the x-axis and the copy number on the y-axis. Shown are the parental tumor (top left), MICs pre-transplant (bottom left), the primary xenograft (top right), and the DN2L cultured cells post-transplant (bottom right). All conditions depicted conserved chromosomal gains (large black oval). B, region 9p21.3 (small black oval Figure 4A), the location of tumor suppressor genes CDKN2A (p16INK4A), p14ARF, and CDKN2B (p15INK4B), showed a one-copy loss of heterozygosity (LOH) that was conserved in all samples.
Microarray and functional pathway analysis of MICs
The genome-wide expression profile of the MICs revealed the high expression levels of many mesenchymal associated genes, as well as the dysregulation of genes involved in the Wnt-signaling pathway when compared with the NSPC population including: LEF1, SNAI2, TGFB3, TGFB1, TGFBR2, and TWIST1 (Fig. 5A). These six genes, among others, are known to contribute to the loss of E-cadherin, a key mechanism in the stabilization of the mesenchymal state (Polyak and Weinberg, 2009). Real time RT-PCR results indicated a high expression of Snail, Slug, and Twist (Fig. 5A right). Fluorescence immunohistochemistry showed strong staining for Snail (Fig. 5B left) and Twist (Fig. 5B right), corroborating the expression levels and suggesting an additional link to a stem cell-like characteristic.
Figure 5.
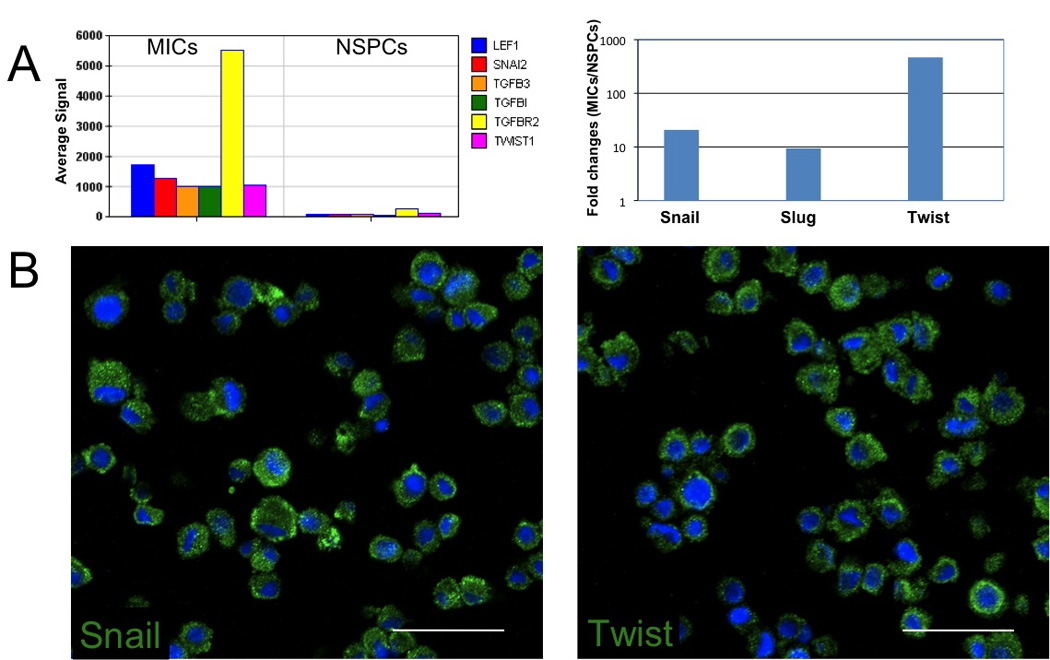
Expression of mesenchymal genes in MICs. A, (left) a histogram shows the absolute microarray expression of probes for LEF1, SNAI2 (Slug), TGFB3, TGFB1, TGFBR2, and TWIST1(Twist) in MICs. (Right) a histogram of RT-PCR of SNAI1 (Snail), Slug, and Twist showing the fold change ratio of MICs/NSPCs. B, fluorescent IHC expression of key mesenchymal genes, SNAI1 (Snail) (left) and TWIST1 (right) in MICs. Nuclei were counterstained with DAPI (blue). Scale bars for all images 50µm.
To investigate the biological functions associated with the MICs, we first identified 1138 transcripts as being differentially expressed (p < 0.01) as compared to the NSPCs. Ingenuity’s Pathway Analysis generated 27 gene network associations from this list. We focused on the top network, which included functions important in Cancer, Cellular Growth and Proliferation, and Connective Tissue Development and Function (Fig. 6A). This network was of particular interest due to its inclusion of many cyclin-dependant kinase-associated genes. The upregulation of CCND3 and down-regulation of CCND2 and CDKN1B (p27) identifies genes responsible for dysregulation of the cell cycle for the MICs. Canonical pathway analysis revealed the Wnt/β-catenin pathway as including the most differentially expressed genes (Fig. 6B). The genes in this pathway include the upregulation of Wnt-signaling activators (CCND1, FZD6, LEF1, TGFBR2) and the downregulation of Wnt-signaling inhibitors (SFRP1, SFRP2, SOX4, SOX11, SOX12), highlighting the relevance of a common stem and progenitor-signaling pathway in these cells. The diseases strongly associated with the differentially expressed gene list were ‘Genetic Disorder’, ‘Cancer’ and ‘Neurological Disease’, appropriately identifying the core processes of these cells (Fig. 6C).
Figure 6.

Ingenuity Pathways Analysis of the differentially expressed genes in the MICs as compared to NSPCs. A, IPA analysis associated the differential expression of MICs as related to Cancer, Cellular Growth and Proliferation, Connective Tissue Development and Function. Genes shaded red are identified as upregulated and, green, as downregulated. B, the functional analysis identified top canonical pathways, and C, diseases most significant with the differentially expressed genes. For example, Canonical pathways analysis identified the Wnt/β-catenin pathway as being the top pathway associated with the differentially expressed gene set.
Discussion
In this study, we describe a tumor-initiating population of cells derived from an atypical meningioma. These meningioma-initiating cells (MICs) exhibit properties of self-renewal, and upon the withdrawal of mitogens, are capable of differentiating into mature neural (neuronal and astrocytic) lineages. Upon transplantation into athymic nude mice, the resulting tumors recapitulate the histological phenotype of the parental tumor.
Meningiomas are thought to arise from arachnoidal cap (meningothelial) cells, (Perry A, 2007) arising embryologically from neural crest and mesoderm, rather than neural ectoderm (Ikeda and Yoshimoto, 2003; Perry A, 2006). However, the histogenesis has not been completely resolved, and the meningothelial phenotype has both ectodermal characteristics, frequently expressing EMA and forming desmosomes, and mesenchymal characteristics capable of synthesizing collagen (Perry A, 2006). Although there are rare descriptions of meningioma-derived cells expressing neurofilaments (Ikeda and Yoshimoto, 2003), the full neuronal and glial phenotype expressed in this study (Neurofilament, GFAP) with simultaneous expression of neural stem cell markers (Nestin, Sox2, and CD133), has not been previously reported.
The propagation of a tumor with features of an atypical meningioma by transplanting 1,000 cells derived from an atypical meningioma supports a tumorinitiating phenotype and presupposes its use as a model for studying meningioma tumors and meningioma progression. The flank model induction of meningioma tumors, augmented by the addition of matrigel, has been shown to recapitulate the features of primary meningiomas with regard to the cytogenetic abnormalities, histological, immunohistochemical and ultrastructural features (Ragel et al., 2008), lending support to the observations reported here. The growth characteristics of this cell line in vitro as well as in vivo suggests that this is a good cell line to be used as a model for meningioma development.
Microarray analysis of gene expression and copy number variations indicates that these MICs are a sub-population derived from the original tumor (rather than a contamination by a stem- and/or progenitor cell not derived from the original neoplastic clone), and can be identified through the expression of, among other markers, ALCAM and CD44. Microarray and pathway analysis suggests the loss of tumor suppressor proteins CDKN2A (p16INK4A), p14ARF, and CDKN2B (p15INK4B), and the upregulation of mesenchymal associated genes, may be key contributors to the phenotype of these cells, and suggests a mechanistic role for tumor progression in the absence of an NF2 mutation.
Genes involved in the G1/S phase transition are important for cell cycle progression and the aCGH indicates that there is a heterozygous loss of CDKN2A (p16INK4A), p14ARF, and CDKN2B (p15INK4B) in the primary tissue, and a homozygous loss in the subsequent samples. However, it is possible that the heterozygous loss reported in the bulk primary tissue is due to the contribution of two cell populations, that of a cell population with two normal copies, and that of a cell which contains a homozygous deletion of this region.
The elevated expression of mesenchymal associated genes is believed to play a role in the pathogenesis of carcinomas, where subpopulations acquire mesenchymal features such as motility, invasiveness, and resistance to apoptosis. In meningiomas, malignant progression is seen as an increase in the frequency of genetic alterations and not defined by the type of genetic alteration (Bostrom et al., 2001; Simon et al., 2007; Weber et al., 1997). For example, the high frequency of NF2 mutations in certain types of meningioma variants has been suggested to contribute to a mesenchymal-like phenotype (Simon et al., 2007). Although these cells do not display mutations in the NF2 gene, we see the high expression of genes and signaling mechanisms essential for the acquisition of a mesenchymal phenotype such as TGFβ1, and the transcription factors Twist, Snail, Slug, and LEF1 (Medici et al., 2008; Polyak and Weinberg, 2009). LEF1, which has recently been shown to be a pivotal molecule in the convergence of the TGF-β and Wnt/β-catenin signaling pathways, may play a strong role in the cross talk of many signaling pathways that converge upon a mesenchymal phenotype as seen here (DiMeo et al., 2009; Mani et al., 2008; Medici et al., 2008).
The MICs cultured in the DN2L medium expressed NF, GFAP, and ALCAM and CD44 in almost all cells, which was not expected. In a study of prostate cancer xenografted tumors, the expression of a CD44+ prostate cancer cell sub-population was shown to be enriched in tumorigenic cells and shared many traits of stem-like cancer cells (Patrawala et al., 2006). Additionally, a comparison of gene expression profiles between fresh-frozen primary meningiomas and their derived cell cultures, identified CD44 as being differentially upregulated in the cultured cells (Sasaki et al., 2003). Similarly, ALCAM has been described as a stem cell marker for melanomas and studies have shown an increased ALCAM expression in metastatic melanomas compared to the primary site tumors or benign melanocytic lesions, indicating a role for ALCAM in tumor invasion and progression (Klein et al., 2007; Lunter et al., 2005). These studies further support our findings regarding the expression of CD44 and ALCAM seen in the MICs and suggest that either the culture medium augment this expression, or this expression pattern is a property of the non-adherent population of this atypical meningioma. Thus, these markers may be used to select and identify a tumor-initiating cell population in atypical meningiomas, and it will be important to examine additional cases of atypical meningiomas with similar in vivo growth properties for the coexpression of ALCAM, CD44, and CD133 as potential biomarkers.
In addition to the expression of putative stem cell markers, the pathway analysis revealed that the most differentially expressed genes were present in the Wnt pathway. It is known that Wnt pathway is activated in stem and progenitor cells and the dysregulation of the molecules in this pathway may lead to cancer (Reya and Clevers, 2005). The association of the Wnt pathway with MICs seen here suggests an additional link to a progenitor population. In a study looking at the correlation between Wnt-signaling in atypical and anaplastic meningiomas containing losses on chromosome 10 and 14, two Wnt pathway genes were shown to be upregulated in anaplastic compared to benign meningiomas, one of them CCND1, similar to the gene identified in our results (Wrobel et al., 2005). The deregulation of genes involved in the Wnt-signaling pathway, such as CCND1 is a feature of MICs, and this signaling pathway in combination with the acquisition of mesenchymal characteristics may contribute to the features of malignant progression and the presence of a stem cell-like subpopulation.
We describe a cell line derived from an atypical meningioma that is capable of expressing proteins of glial derivation, suggesting that meningioma-initiating cells retain the potential to express a glial phenotype. Furthermore, this cell line represents a good model for studying meningioma tumorigenesis. These findings support the idea of an early-lineage stem cell phenotype in meningioma-initiating cells, a finding that provides new insight into the tumorigenesis and malignant progression of atypical meningiomas.
Supplementary Material
Acknowledgement
We would like to thank Dr. Shang Huang for providing Snail and Twist antibodies, Dr. John Cowell and Dr. Charles Caldwell for helpful discussion and critical review of this manuscript, and Dr. Yayun Liang for transplant guidance. This work is partially supported by the Department of Pathology, University of Missouri, and the Georgia Cancer Coalition, and NIH grants CA123018 and CA123565.
Footnotes
Publisher's Disclaimer: This is a PDF file of an unedited manuscript that has been accepted for publication. As a service to our customers we are providing this early version of the manuscript. The manuscript will undergo copyediting, typesetting, and review of the resulting proof before it is published in its final citable form. Please note that during the production process errors may be discovered which could affect the content, and all legal disclaimers that apply to the journal pertain.
Contributor Information
Prakash Rath, Email: rath@kennedykrieger.org.
Douglas C. Miller, Email: millerdc@health.missouri.edu.
N. Scott Litofsky, Email: litofskyn@health.missouri.edu.
Douglas C. Anthony, Email: anthonydc@health.missouri.edu.
Qi Feng, Email: fengq@missouri.edu.
Craig Franklin, Email: FranklinC@missouri.edu.
Lirong Pei, Email: lpei@mcg.edu.
Alan Free, Email: alanfree83@gmail.com.
Jime Liu, Email: jliu@mcg.edu.
Mingqiang Ren, Email: mren@mcg.edu.
Mark D. Kirk, Email: KirkM@missouri.edu.
Huidong Shi, Email: hshi@mcg.edu.
References
- Bleau AM, et al. New strategy for the analysis of phenotypic marker antigens in brain tumor-derived neurospheres in mice and humans. Neurosurg Focus. 2008;24:E28. doi: 10.3171/FOC/2008/24/3-4/E27. [DOI] [PubMed] [Google Scholar]
- Bostrom J, et al. Alterations of the tumor suppressor genes CDKN2A (p16(INK4a)), p14(ARF), CDKN2B (p15(INK4b)), and CDKN2C (p18(INK4c)) in atypical and anaplastic meningiomas. Am J Pathol. 2001;159:661–669. doi: 10.1016/S0002-9440(10)61737-3. [DOI] [PMC free article] [PubMed] [Google Scholar]
- CBTRUS. Statistical report: primary brain tumors in the United States. C., IL: Central Brain Tumor Registry of the United States of America; 2007–2008. [Google Scholar]
- Chu P, et al. Characterization of a subpopulation of colon cancer cells with stem cell-like properties. Int J Cancer. 2009;124:1312–1321. doi: 10.1002/ijc.24061. [DOI] [PubMed] [Google Scholar]
- Dalerba P, et al. Phenotypic characterization of human colorectal cancer stem cells. Proc Natl Acad Sci U S A. 2007;104:10158–10163. doi: 10.1073/pnas.0703478104. [DOI] [PMC free article] [PubMed] [Google Scholar]
- DiMeo TA, et al. A novel lung metastasis signature links Wnt signaling with cancer cell self-renewal and epithelial-mesenchymal transition in basal-like breast cancer. Cancer Res. 2009;69:5364–5373. doi: 10.1158/0008-5472.CAN-08-4135. [DOI] [PMC free article] [PubMed] [Google Scholar]
- Fabian A, et al. Die hard: are cancer stem cells the Bruce Willises of tumor biology? Cytometry A. 2009;75:67–74. doi: 10.1002/cyto.a.20690. [DOI] [PubMed] [Google Scholar]
- Fang D, et al. A tumorigenic subpopulation with stem cell properties in melanomas. Cancer Res. 2005;65:9328–9337. doi: 10.1158/0008-5472.CAN-05-1343. [DOI] [PubMed] [Google Scholar]
- Hanemann CO. Magic but treatable? Tumours due to loss of merlin. Brain. 2008;131:606–615. doi: 10.1093/brain/awm249. [DOI] [PubMed] [Google Scholar]
- Hill R, Wu H. PTEN, stem cells, and cancer stem cells. J Biol Chem. 2009;284:11755–11759. doi: 10.1074/jbc.R800071200. [DOI] [PMC free article] [PubMed] [Google Scholar]
- Hueng DY, et al. Isolation and characterization of tumor stem-like cells from human meningiomas. J Neurooncol. 2010 doi: 10.1007/s11060-010-0469-1. [DOI] [PubMed] [Google Scholar]
- Ikeda H, Yoshimoto T. Immunohistochemical study of anaplastic meningioma with special reference to the phenotypic change of intermediate filament protein. Ann Diagn Pathol. 2003;7:214–222. doi: 10.1016/s1092-9134(03)00049-2. [DOI] [PubMed] [Google Scholar]
- Keller A, et al. Genome wide expression profiling identifies specific deregulated pathways in meningioma. Int J Cancer. 2009;124:346–351. doi: 10.1002/ijc.23942. [DOI] [PubMed] [Google Scholar]
- Klein WM, et al. Increased expression of stem cell markers in malignant melanoma. Mod Pathol. 2007;20:102–107. doi: 10.1038/modpathol.3800720. [DOI] [PubMed] [Google Scholar]
- Lapidot T, et al. A cell initiating human acute myeloid leukaemia after transplantation into SCID mice. Nature. 1994;367:645–648. doi: 10.1038/367645a0. [DOI] [PubMed] [Google Scholar]
- Liu Y, et al. Aberrant CpG island hypermethylation profile is associated with atypical and anaplastic meningiomas. Hum Pathol. 2005;36:416–425. doi: 10.1016/j.humpath.2005.02.006. [DOI] [PubMed] [Google Scholar]
- Lunter PC, et al. Activated leukocyte cell adhesion molecule (ALCAM/CD166/MEMD), a novel actor in invasive growth controls matrix metalloproteinase activity. Cancer Res. 2005;65:8801–8808. doi: 10.1158/0008-5472.CAN-05-0378. [DOI] [PubMed] [Google Scholar]
- Mani SA, et al. The epithelial-mesenchymal transition generates cells with properties of stem cells. Cell. 2008;133:704–715. doi: 10.1016/j.cell.2008.03.027. [DOI] [PMC free article] [PubMed] [Google Scholar]
- Medici D, et al. Snail and Slug promote epithelial-mesenchymal transition through beta-catenin-T-cell factor-4-dependent expression of transforming growth factor-beta3. Mol Biol Cell. 2008;19:4875–4887. doi: 10.1091/mbc.E08-05-0506. [DOI] [PMC free article] [PubMed] [Google Scholar]
- Patrawala L, et al. Highly purified CD44+ prostate cancer cells from xenograft human tumors are enriched in tumorigenic and metastatic progenitor cells. Oncogene. 2006;25:1696–1708. doi: 10.1038/sj.onc.1209327. [DOI] [PubMed] [Google Scholar]
- Perry A. Menigiomas. In: R.M. McLendon RE, Bigner DD, editors. Russell and Rubinstein’s Pathology of Tumors of the Nervous System. London: Hodder Arnold; 2006. pp. 427–474. [Google Scholar]
- Perry ALD, Scheithauer BW, Budka H, von Deimling A. O. H. Louis DN, Wiestler OD, Cavenee WK, editors. Menigiomas. Lyon, France: International Agency for Research on Cancer; WHO Classification of Tumours of the Central Nervous System. 2007
- Polyak K, Weinberg RA. Transitions between epithelial and mesenchymal states: acquisition of malignant and stem cell traits. Nat Rev Cancer. 2009;9:265–273. doi: 10.1038/nrc2620. [DOI] [PubMed] [Google Scholar]
- Ragel BT, et al. A comparison of the cell lines used in meningioma research. Surg Neurol. 2008;70:295–307. doi: 10.1016/j.surneu.2007.06.031. discussion 307. [DOI] [PubMed] [Google Scholar]
- Reya T, Clevers H. Wnt signalling in stem cells and cancer. Nature. 2005;434:843–850. doi: 10.1038/nature03319. [DOI] [PubMed] [Google Scholar]
- Reynolds BA, Weiss S. Generation of neurons and astrocytes from isolated cells of the adult mammalian central nervous system. Science. 1992;255:1707–1710. doi: 10.1126/science.1553558. [DOI] [PubMed] [Google Scholar]
- Sasaki T, et al. Comparison of gene expression profiles between frozen original meningiomas and primary cultures of the meningiomas by GeneChip. Neurosurgery. 2003;52:892–898. doi: 10.1227/01.neu.0000053368.73552.bb. discussion 898-9. [DOI] [PubMed] [Google Scholar]
- Simon M, et al. Molecular genetics of meningiomas: from basic research to potential clinical applications. Neurosurgery. 2007;60:787–798. doi: 10.1227/01.NEU.0000255421.78431.AE. discussion 787-98. [DOI] [PubMed] [Google Scholar]
- Singh SK, et al. Identification of a cancer stem cell in human brain tumors. Cancer Res. 2003;63:5821–5828. [PubMed] [Google Scholar]
- Singh SK, et al. Identification of human brain tumour initiating cells. Nature. 2004;432:396–401. doi: 10.1038/nature03128. [DOI] [PubMed] [Google Scholar]
- Watson MA, et al. Molecular characterization of human meningiomas by gene expression profiling using high-density oligonucleotide microarrays. Am J Pathol. 2002;161:665–672. doi: 10.1016/S0002-9440(10)64222-8. [DOI] [PMC free article] [PubMed] [Google Scholar]
- Weber RG, et al. Analysis of genomic alterations in benign, atypical, and anaplastic meningiomas: toward a genetic model of meningioma progression. Proc Natl Acad Sci U S A. 1997;94:14719–14724. doi: 10.1073/pnas.94.26.14719. [DOI] [PMC free article] [PubMed] [Google Scholar]
- Willis J, et al. The accuracy of meningioma grading: a 10-year retrospective audit. Neuropathol Appl Neurobiol. 2005;31:141–149. doi: 10.1111/j.1365-2990.2004.00621.x. [DOI] [PubMed] [Google Scholar]
- Wrobel G, et al. Microarray-based gene expression profiling of benign, atypical and anaplastic meningiomas identifies novel genes associated with meningioma progression. Int J Cancer. 2005;114:249–256. doi: 10.1002/ijc.20733. [DOI] [PubMed] [Google Scholar]
- Zhang S, et al. Identification and characterization of ovarian cancer-initiating cells from primary human tumors. Cancer Res. 2008;68:4311–4320. doi: 10.1158/0008-5472.CAN-08-0364. [DOI] [PMC free article] [PubMed] [Google Scholar]
Associated Data
This section collects any data citations, data availability statements, or supplementary materials included in this article.