

Abstract
Purpose
The standard approach of using tumor doubling time to assess growth delay may not accurately represent tumor response, especially if the growth rates are not constant. Therefore, we developed a method to compare the antitumor activities of different treatments in xenograft experiments that uses the entire growth curve to estimate non-constant growth rates.
Experimental Design
A Bayesian hierarchical changepoint (BHC) method was used to model logarithmically transformed tumor volumes. Each tumor was assumed to have a growth profile, represented by a pre-nadir regression rate, a regression period, a nadir volume, and a post-nadir regrowth rate. Confidence intervals were calculated to compare these features between different treatments. We used data from a study assessing the effects of radiation, gemcitabine, and a Chk1/2 inhibitor on MiaPaCa-2 xenografts.
Results
We found that the BHC model provided a good fit to the data and more descriptive features than the tumor doubling approach. This model detected significant tumor regression in the AZD7762+1Gy and GEM+1Gy that was not detected when comparing the tumor doubling times. The BHC model also provided evidence that the growth inhibition resulted from a direct tumor effect rather than an indirect effect on the tumor bed, as evidenced by dramatic tumor regression in response to effective treatments and similar post-nadir regrowth rates across all treatment groups.
Conclusions
Compared with the tumor doubling time approach, the BHC model utilizes all data, providing more descriptive features that address mechanisms underlying tumor growth inhibition and maximize the biological information obtained from tumor xenografts studies.
Keywords: Xenograft model, changepoint model, tumor doubling time, growth delay, tumor growth profile, Bayesian model
INTRODUCTION
Tumor xenograft models play an important role in translational cancer research. In these models, immunocompromised mice are grafted with cancer cells, treated with anti-cancer therapies, and then monitored for the effects of therapy on tumor growth during treatment as well as the more sustained effects on tumor regrowth after treatment.
Tumor regression and regrowth is complicated and involves several biological processes. Depending on the treatment, tumor growth patterns can be quite different. For example, while untreated tumors may grow during an entire study period, radiation treated tumors usually regress and then subsequently regrow. The time until tumor volume doubling, defined as the earliest day on which the tumor volume is at least twice as large as on the first day of treatment, is the most commonly used endpoint in these studies.
There are, however, two major disadvantages with using doubling time. First, by ignoring the measurements taken after time-to-tumor doubling, biologically important aspects of a treatment effect might be missed. Second, the single estimate of doubling time does not address the biological mechanisms underlying different patterns of tumor growth. For instance, in response to an effective therapy, tumors may regress to a level below the limit of quantitation (10mm3 in this study) for some time, possibly until the end of the observation period. Volumes below the limit of quantitation are not considered missing, but left-censored; the exact volume cannot be estimated beyond stating that the tumor is less than 10 mm3. Thus an approach that can assess the regression period and volume nadir for such tumors is needed to more accurately estimate the treatment effect.
Previously, comparisons of tumor volumes at selected time points have been utilized as an endpoint for tumor growth studies. For instance, the Wilcoxon-Mann-Whitney test is used to compare tumor volumes between treatments at a given time point1. This approach, however, deliberately ignores data at the other time points. As alternatives, longitudinal data analyses such as repeated-measures ANOVA, or Friedman repeated-measures ANOVA on ranks2, can compare tumor volumes between treatments at a given time point after accounting for the correlation of measurements on the same tumor. However, this model can not take into account the data that are below the limit of quantitation (censored data). Tan, Fang and Tian3,4,5 developed a t-test via the EM algorithm and, also, Bayesian approaches for testing differences between two treatment regimens by analyzing longitudinal data and taking into account the censored data. Although the models proposed by Tan, Fang and Tian are an improvement over the previously mentioned approaches (Wilcoxon, repeated measures ANOVA), their test hypotheses are based on comparing either specific time points or a function of selected time points, which can not be used to study tumor growth patterns. Liang6 developed a non-parametric approach to estimate the tumor growth profiles by penalized splines, but important characteristics of the tumor growth curve such as tumor regression and growth rates cannot be estimated using this approach. Other studies have utilized the time in days for the tumors to reach a pre-defined tumor volume as an endpoint. The choice of the end-point tumor size at which to assess delay, however, is critical in determining the magnitude of delay7. Although these endpoints are useful to estimate the tumor growth delay, they neither capture all of the data nor address the different mechanisms underlying tumor growth. Thus analyses which take into account the entire data set, as well as the characteristics of the tumor growth curve, are needed in order to maximize the biological information gained from tumor xenografts studies.
In this paper, we propose a novel Bayesian hierarchical changepoint approach to model the logarithmically-transformed tumor volumes. The two-piece linear (“broken stick”) line describes tumor regression, followed by tumor regrowth. The hinge is when the tumor starts to re-grow and the volume at the hinge is the nadir. Bayesian changepoint methods have been successfully applied to CD4 counts to predict the timing of HIV viral rebound8, to longitudinal PSA series to predict cancer onset9,10, and to cognitive function over time to predict the decline in memory that precedes diagnosis of dementia11. In this study, we applied the BHC model to the tumor xenograft volume profile data, and assessed “during-treatment” and “after-treatment” effects, by testing if the features of the tumor growth profiles (e.g., regression rate, regression period, volume nadir, and regrowth rate) differ between treatment groups.
METHODS
Transformation of volume measurements
In xenograft experiments, tumor growth rates are typically close to exponential both before and after the nadir. For this reason, tumor volumes were logarithmically transformed before analysis to obtain linear growth profiles before and after the nadir. The base 2 logarithms have scientifically useful interpretations; the post-nadir log2volume growth rate is equivalent to the number of times the tumor doubles per day, and its reciprocal corresponds to the tumor doubling time. Similarly, the log2volume regression rate is the number of times the tumor halving per day and its reciprocal corresponds to the tumor halving time.
BHC model
We assume that the log2volumes (yijk: the kth tumor in the ith animal at time tj) are normally distributed, with an expected value μijk and variance σ2, as described by the tumor-level piecewise linear model:
The model assesses each tumor growth profile, represented by a pre-nadir regression rate (exp(b1i)), a regression period (rik), a volume nadir (aik), and a post-nadir regrowth rate (exp(b2i)). For left-censored observations, the condition that a given yijk is less than the limit of quantitation (in the example, log2(10)=3.3) is incorporated in the estimation process in the same fashion as censored data are considered in parametric survival models.
The random effects b1i and b2i are exponentiated to model both regression-regrowth profile and growth-only profile. A growth profile does not exhibit regression and uses only the regrowth line of the model, with rik≤0. In such tumors, the regrowth starts immediately after the initiation of the therapy. To complete the BHC model, it is then assumed that the tumor-level random effects aik, b1i, b2i and rik are drawn from probability distributions with treatment-specific parameters; these parameters are estimated with 90% HPD (highest probability density) intervals. Given any treatment group, if the lower bound of the 90% HPD interval on regression period is smaller than zero, then there is a high probability that there is no tumor regression, and only the post-nadir regrowth rate will be presented. If the HPD interval of the difference in any feature between two treatments covers zero, the two treatments are not significantly different on that feature.
The treatment-specific parameters are assumed to have been drawn from probability distributions with vague priors. The full BHC model setup is described mathematically in the Appendix. Estimation was implemented in WinBUGS12, a statistical software package that uses Markov Chain Monte Carlo to generate samples from the relevant posterior distributions. The mechanics of estimation in the presence of left-censored data are described in the WinBUGS code in the Appendix as well.
RESULTS
Design setup
This paper was motivated by a study of the combination of a novel Chk1/2 targeted agent, AZD7762, with gemcitabine and radiation to treat pancreatic cancer13. In this study, MiaPaCa-2 cells were injected subcutaneously into the flanks of mice. Treatment with gemcitabine (GEM) (90mg/kg on days 0, 7, and 14), AZD7762 (20mg/kg on days 0, 1, 7, 8, 14, and 15), and/or radiation (1 or 2 Gy / fraction on days 0-4, 7-11, and 14-17) was initiated when the average tumor volume reached 100 mm3. Tumor volume (TV) was monitored by measurement with calipers two times per week, until the tumors reached approximately 800mm3, the mouse died, or 120 days, whichever occurred first. TV was calculated according to the equation: TV = παβ2/6, where α and β are the longer and shorter dimensions of the tumor, respectively.
Data summary
The BHC model was applied to a data set comprised of animals exposed to 12 treatments in a 2×2×3 design: Control; GEM; AZD7762; 1Gy; GEM+AZD7762; 2Gy; GEM+1Gy; GEM+2Gy; AZD7762+1Gy; AZD7762+2Gy; GEM+AZD7762+1Gy; GEM+AZD7762+2Gy. There are 6 or 7 mice in each treatment group, and all mice had two tumors, one on each flank, except one mouse treated with 2Gy that had just one tumor. Treatments that had tumor profiles containing at least one volume measurement below the limit of quantitation include 1Gy (1/6), 2Gy (6/6), AZD7762+2Gy (6/7), GEM+2Gy (6/6), GEM+AZD7762+1Gy (1/7), GEM+AZD7762+2Gy (7/7). Moreover, there were tumors that never regrew in the observation period in 2Gy (3 tumors), AZD7762+2Gy (4 tumors) and GEM+AZD7762+2Gy (3 tumors) treatment arms.
Estimates for treatment groups
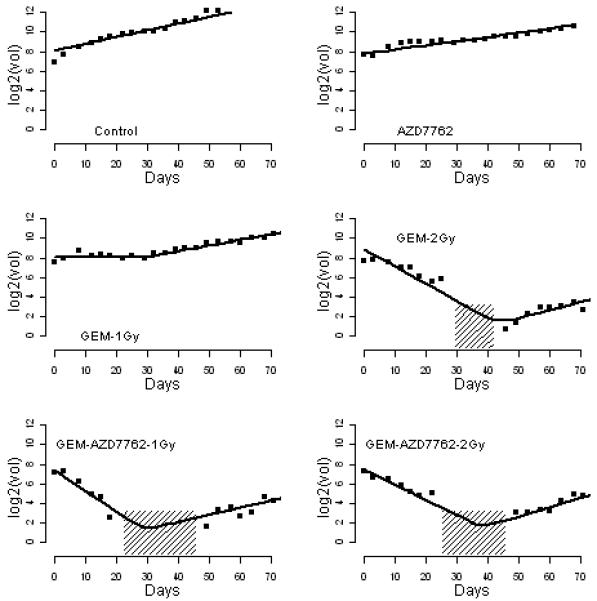
The model provided a good fit to the data, demonstrated by a reasonable fit of the estimated growth profiles on the observed profiles (see Fig. 1) as well as justified by the diagnostic test embedded in the statistical package. The estimates of the BHC model parameters are shown in Table 1 and estimated growth profiles for all treatments are presented in Figure 2. Control, AZD7762, GEM, 1Gy and GEM+AZD7762 did not induce tumor regression, and the tumor growth rates were not statistically different (90% HPD intervals of regrowth rate, expressed as the number of times a tumor doubles per day, were [0.03, 0.09], [0.03, 0.07], [0.03, 0.07], [0.03, 0.08] and [0.02, 0.07], respectively; the 90% HPD intervals of all pairwise differences cover zero). With a radiation dose of 2Gy (such as 2Gy, AZD7762+2Gy, GEM+2Gy and GEM+AZD7762+2Gy), tumor regression rates were significantly higher, tumor regression period were significantly longer, and the nadir volumes were significantly lower than the corresponding treatments with 1 Gy. For example, the 90% HPD interval of nadir volume in AZD7762+1Gy is 152mm3 to 221mm3, which is substantially above the interval of 3mm3 to 13mm3 in AZD7762+2Gy. The addition of AZD7762 to radiation and gemcitabine resulted in enhanced tumor regression; 90% HPD intervals of the difference in nadir volume were [96mm3, 173mm3] for GEM+1Gy vs. GEM+AZD7762+1Gy and [6mm3, 21mm3] for GEM+2Gy vs. GEM+AZD7762+2Gy. In summary, this model suggests that the growth inhibition results from direct effects on the tumor cells and not from indirect effects on the tumor bed, evidenced by dramatic tumor regression in response to effective treatments and similar post-nadir regrowth rates across all treatments.
Figure 1. Estimated individual tumor growth profiles for 6 tumors.
The observed growth profile (squares) of six selected tumors, with estimated tumor-specific profiles (solid line) from the BHC model; areas shaded with 45 degree lines represent the measurements that are below the limit of quantification. The y axis is the log2 tumor volume; the x axis is the days after the start of treatment.
Table 1.
Posterior estimates from the BHC model**, with 90% high probability density (HPD) intervals
| Control | AZD7762 | GEM | GEM+AZD7762 | |
|---|---|---|---|---|
| Regression time (days) | No* | No | No | No |
| growth rate | 0.06 (0.03,0.09) | 0.05 (0.03,0.07) | 0.05 (0.03,0.07) | 0.05 (0.02,0.07) |
| 1Gy | AZD7762+1Gy | GEM+1Gy | GEM+AZD7762+1Gy | |
| Regression time (days) | No | 26 (22,30) | 27 (24, 31) | 22 (19,24) |
| Nadir Volume (mm3) | -- | 186 (152,221) | 206 (163,253) | 80 (44,116) |
| Regression rate† | -- | 0.00 (0.00,0.00) | 0.00 (0.00,0.00) | 0.04 (0.01,0.06) |
| Regrowth rate‡ | 0.06 (0.03,0.08) | 0.06 (0.04,0.09) | 0.07 (0.04,0.09) | 0.07 (0.05,0.1) |
| 2Gy | AZD7762+2Gy | GEM+2Gy | GEM+AZD7762+2Gy | |
| Regression time (days) | 34 (29,39) | 33 (28,38) | 32 (29,35) | 40 (35,45) |
| Nadir Volume (mm3) | 8 (2, 14) | 8 (3, 13) | 16 (10,23) | 3 (1,5) |
| Regression rate | 0.16 (0.09,0.24) | 0.15 (0.09,0.21) | 0.13 (0.06,0.18) | 0.16 (0.1,0.22) |
| Regrowth rate | 0.07 (0.02,0.11) | 0.04 (0, 0.08) | 0.09 (0.05,0.13) | 0.06 (0.02,0.11) |
BHC model using the WinBUGS code of Treat1.txt
“No” means no tumor regression, that occurs when the lower bound of the 90% HPD interval of the regression period is less than 0
Regression rate is the number of times tumor halves per day, and its reciprocal is the tumor halving time
Regrowth rate is the number of times tumor doubles per day, and its reciprocal is the tumor doubling time
Figure 2. Estimated tumor growth profiles for 12 treatment groups.

The gray lines are the observed tumor growth profiles by connecting longitudinal measurements per tumor and the disconnection of a line is for data that are below the limit of quantitation. The black dashed lines are the estimated treatment-specific profiles from the BHC model. The y axis is the log2 tumor volume; the x axis is the days after the start of treatment.
Comparison to time to tumor volume doubling test
This experiment was also analyzed using the time-to-tumor volume doubling endpoint by log-rank tests. The two approaches (BHC vs. doubling) did not yield entirely consistent results. The BHC model found two significant comparisons that were not found by the time-to-doubling approach; AZD7762+1Gy vs. 1Gy (log-rank: p=0.45) and GEM+1Gy vs. 1Gy (log-rank: p=0.73). Although these treatments are associated with similar doubling times, both AZD7762+1Gy and GEM+1Gy demonstrate significant tumor regression by the BHC model, which is confirmed by inspection of the growth curves. These findings support the use of the BHC model which has more descriptive features than the time-to-tumor volume doubling test.
The time-to-tumor volume doubling test found three significant comparisons: Control vs. AZD7762 (p=0.04), Control vs. GEM+AZD7762 (p<0.0001), and GEM vs. GEM+AZD7762 (p=0.0002), which were not estimated to be significant by the BHC model in terms of tumor regrowth rate. However, consistent with the BHC model estimates, the time-to-tripling test showed non-significant results for all three of these comparisons (p=0.64 for AZD7762 vs. control, p=0.46 for GEM+AZD7762 vs. control and p=0.65 for GEM+AZD7762 vs. GEM). If tumor growth were consistently different between the treatment conditions, the time-to-doubling or -tripling test should yield the same results. Given the agreement between the BHC and time-to-tripling models, it seems likely that the differences found in the time-to-doubling test result from the limitations of analyzing a single time point rather than a fundamental difference between the growth curves.
DISCUSSION
In this study we have found that, in comparison to the most commonly used tumor growth model of time-to-doubling, the BHC approach helped to clarify the underlying biology by providing additional features of the growth profiles, including tumor regression rate, regression period, nadir volume, and regrowth rate.
During anticancer therapy, tumor cells are killed and eventually cleared in the circulation. As dead cells are cleared from the tumor, the blood and nutrient supply to the tumor improves, allowing repopulation of the tumor. When the rate of tumor repopulation overtakes the rate of tumor cell loss, the tumor starts to re-grow, and at the same time its volume achieves the nadir. For some effectively treated tumors, a high rate of regression or/and a longer period of regression could ultimately result in a complete tumor regression in the study period. If tumor repopulation starts very early and the rate of repopulation is faster than the rate of cell loss, the tumors typically grow during the entire study period. The BHC model efficiently assessed whether the treatment induced a significant tumor regression, and if so then the rate and period of the regression. This model also distinguished the initial tumor growth inhibition (i.e. cell killing), from the subsequent inhibition of tumor regrowth (i.e. tumor bed effect14), which will be interpreted as tumor growth delay by the time-to-doubling approach. All of these features could have clinical implications for treatment. For example, higher regression rate, longer regression time, and lower regrowth rate could predict longer intervals to, and/or less frequent, tumor recurrence.
In this study, the BHC approach did not demonstrate tumor bed effects for any of the treatments, evidenced by statistically similar regrowth rates for all of the treatments. Since the tumor bed effect depends on the radiation doses15, a dose of 1-2 Gy was probably too low to demonstrate the effect. In future studies, higher doses of radiation could be used or tumors may be monitored until they become larger, where the tumor bed effect appears to play a greater role13.
The BHC model used in this study assumed that tumor regression and regrowth followed an exponential fashion. Thus, the BHC model could be applied to other studies in which tumor growth profiles satisfy such an assumption, such as modeling of spontaneous tumors formed by genetically engineered mice. By empirical evaluation of the tumor growth profile data of this study, the BHC model also assumed the same regrowth rate of two tumors within the same animal. This assumption, however, is not required by the BHC model, and the model can be easily modified to release this assumption. In future work, we plan to explore the BHC model with three or four pieces of linear growth lines, to capture more significant growth rate changes. For example, a model with three pieces can estimate a tumor growth-regression-regrowth profile.
In this study, we mainly focused on comparing these features between different treatments, and these features can be assessed for individual tumors as well. The BHC model is especially useful in estimating the regression period and nadir volume for tumors that contain measurements below the limit of quantitation, since the exact volumes cannot be measured, and the nadir volume is unknown. In this circumstance, a small number of viable tumor cells remain that can grow back into a tumor. The BHC model predicts these nadirs and regression times by borrowing information from the observed volumes. Likewise, these tumor-specific growth patterns (such as regression rates, regression periods, nadir volumes, and regrowth rates) can be correlated with the percentages of tumor stem cells to gain insights into cancer stem cell biology. For instance, in a patient-derived xenograft mouse model, the percentage of cancer stems following treatment with gemcitabine and AZD7762 was significantly less compared to treatment with gemcitabine or AZD7762 alone (unpublished observation). This decrease in tumor stem cells in response to gemcitabine and AZD7762 correlated with the tumor growth profiles obtained under similar experimental conditions, in which a significantly longer regression period occurred in response to the combination of gemcitabine and AZD7762, as compared to gemcitabine or AZD7762 alone. These data warrant future studies designed to determine the relationships between tumor stem cells and tumor growth profiles, in which the BHC model may be very useful.
In summary, a BHC model was developed to describe clinically meaningful characterization of nonlinear tumor growth profiles observed in many xenograft experiments, using the off-the shelf programming components. It not only provides new insights to the current xenograft study, but also lays ground work for future studies in cancer stem cell biology.
Statement of translational relevance.
The new statistical model we propose in this study provides a comprehensive analysis of the tumor growth profiles observed in tumor xenograft experiments, including tumor regression rate, regression period, nadir volume and tumor regrowth rate. Each of these features provided by this model could have clinical implications for treatment. For example, higher regression rate, longer regression time, and lower regrowth rate could predict longer intervals to, and/or less frequent, tumor recurrence. This statistical approach maximizes the biological information obtained from tumor xenografts which should facilitate the translation of preclinical xenograft studies to more rationale clinical trial designs.
Acknowledgments
Grant support: This work was supported by NIH grants R01CA78554, R01CA138723, P50CA130810, and AstraZeneca.
Abbreviations
- BHC
Bayesian hierarchical changepoint
- ANOVA
analysis of variance
- PSA
prostate-specific antigen
- EM
expectation-maximization
- HPD
highest probability density
- TV
tumor volume
APPENDIX
Prior specification
Note that WinBUGS describes the normal distribution in terms of a mean and a precision, where precision is the inverse of the variance (τ=1/σ2), so the second term in the specification of a normal distribution will refer to precision in this Appendix.
We use hierarchical priors for the parameters aik, b1i, b2i and rik, so the individual parameters are viewed as a random sample from a common distribution. For example, the hierarchical model assumes that the regression time, rik, is randomly selected from a normal distribution with treatment specific mean r and variance 1/τr. This hierarchical structure allows borrowing information across tumors, resulting in correlation between tumors in the same treatment group. In other words, the data from each tumor provide information about all other tumors in the same group. Therefore, the BHC model will be less sensitive to the outliers (tumor volumes or tumor profiles that are far from the others). In addition, an example code of borrowing information across similar treatment groups is shown in the WinBUGS code saved as TreatALL.txt.
We performed a sensitivity analysis to investigate the effect of the prior distributions on the estimates of the BHC parameters. We observed the effect of increasing the variance of the prior distribution on the estimates. For example, we increased the variance of the prior distribution of b1 and b2 from 10 to 100, and found that increasing the variances in the prior distributions had a negligible effect on these estimates, concluding that the priors we used provide little information in the final estimates.
WinBUGS Code
We ran two independent parallel chains with different starting values. The chains were run with a burn-in of 5000 iterations, and an additional 50000 iterations for inference. With a thinning interval of 50, posterior distributions for the parameter estimates were therefore based on 2000 iterations. Point estimates of parameters were calculated using the mean of the posterior distribution; 90% high probability density intervals were obtained as well. The convergence of the Markov chain was assessed visually, and by the Gelman-Rubin Diagnostic criterion16. In addition, we visually checked the predicted growth profiles for each tumor, and they all fit very well to the observed profiles (see Fig. 1).


R and WinBUGS can be download at
http://www.mrc-bsu.cam.ac.uk/bugs/winbugs/contents.shtml
WinBUGS user manual can also be found at
Footnotes
Disclosure of potential conflicts of interest: M.A. Morgan: commercial research grant, AstraZeneca
REFERENCES
- 1.Shusterman S, Grupp SA, Barr R, Carpentieri D, Zhao H, Maris JM. Angiogenesis Inhibitor TNP-470 Effectively Inhibits Human Neuroblastoma Xenograft Growth, Especially in the Setting of Subclinical Disease. Clinical Cancer Research. 2001;7:977–84. [PubMed] [Google Scholar]
- 2.Sauer LA, Dauchy RT, Blask DE, Krause JA, Davidson LK, Dauchy EM. Eicosapentaenoic Acid Suppresses Cell Proliferation in MCF-7 Human Breast Cancer Xenografts in Nude Rats via a Pertussis Toxin–Sensitive Signal Transduction Pathway. J. Nutr. 2005;135:2124–2129. doi: 10.1093/jn/135.9.2124. [DOI] [PubMed] [Google Scholar]
- 3.Tan M, Fang HB, Tian GL, Houghton PJ. Small sample inference for incomplete longitudianl data with trunction and cersoring in tumour xenograft models. Biometrics. 2002;58:612–620. doi: 10.1111/j.0006-341x.2002.00612.x. [DOI] [PubMed] [Google Scholar]
- 4.Fang HB, Tian GL, Tan M. Hierarchical models for tumour xenograft experiments in drug development. Journal of Biopharmaceutical statistics. 2004;14:931–945. doi: 10.1081/BIP-200035462. [DOI] [PubMed] [Google Scholar]
- 5.Tan M, Fang HB, Tian GL, Houghton PJ. Repeated measures models with constrained parameters for incomplete data in tumour xenograft experiments. Statistics in Medicine. 2005;24:109–119. doi: 10.1002/sim.1775. [DOI] [PubMed] [Google Scholar]
- 6.Liang H. Modeling Antitumor Activities in Xenograft Tumor Treatment. Biometrical Journal. 2005;3:358–368. doi: 10.1002/bimj.200310113. [DOI] [PubMed] [Google Scholar]
- 7.Begg AC. Analysis of growth delay data: potential pitfalls. Br.J.Cancer. 1980;42:93–97. [PMC free article] [PubMed] [Google Scholar]
- 8.Kiuchi AS, Hartigan JA, Holford TR, Rubinstein P, Stevens CE. Change Points in the Series of T4 Counts Prior to AIDS. Biometrics. 1995;51:236–48. [PubMed] [Google Scholar]
- 9.Bellera CA, Hanley JA, Joseph L, Albertsen PC. Hierarchical changepoint models for biochemical markers illustrated by tracking postradiotherapy prostate-specific antigen series in men with prostate cancer. Ann Epidemiol. 2008;18:270–82. doi: 10.1016/j.annepidem.2007.10.006. [DOI] [PubMed] [Google Scholar]
- 10.Slate E, Lark L. Using PSA to detect prostate cancer onset: an application of Bayesian retrospective and prospective changepoint identification. Journal of Educational and Behavioral Statistics. 2001;26:443–468. [Google Scholar]
- 11.Hall CB, Ying J, Kuo L, Lipton RB. Bayesian and profile likelihood changepoint methods for modeling cognitive function over time. Computational statistics and data analysis. 2003;42:91–109. [Google Scholar]
- 12.Lunn DJ, Thomas A, Best N, Spiegelhalter D. WinBUGS -- a Bayesian modeling framework: concepts, structure, and extensibility. Statistics and Computing. 2000;10:325–337. [Google Scholar]
- 13.Morgan MA, Parsels LA, Zhao L, et al. Mechanism of Radiosensitization by the Chk1/2 Inhibitor AZD7762 Involves Abrogation of the G2 Checkpoint and Inhibition of Homologous Recombinational DNA Repair. Cancer Research. 2010;70:4972–4981. doi: 10.1158/0008-5472.CAN-09-3573. [DOI] [PMC free article] [PubMed] [Google Scholar]
- 14.Trott KR, Kummermehr J. Split dose recovery of a mouse tumour and its stroma during fractionated irradiation. British Journal of Radiology. 1982;55:841–846. doi: 10.1259/0007-1285-55-659-841. [DOI] [PubMed] [Google Scholar]
- 15.Hewitt HB, Blake ER. The growth of transplanted tumors in pre-irradiated sites. Br.J. Cancer. 1968;22(4):808–824. doi: 10.1038/bjc.1968.95. [DOI] [PMC free article] [PubMed] [Google Scholar]
- 16.Gelman A, Carlin JB, Stern HS, Rubin DB. Bayesian Data Analysis. 3rd ed. Chapman and Hall; New York: 1996. pp. 161–176. [Google Scholar]