Abstract
At 0.12 mmol/L γ-glutamyl p-nitroaniline (GGPNA), an improved integrated method was developed for kinetic analysis of γ-glutamyltransferase (GGT) reaction process and the integration with the classical initial rate method to measure serum GGT. For the improved integrated method, an integrated rate equation, which used the predictor variable of reaction time and considered inhibitions by both GGPNA and products, was nonlinearly fit to GGT reaction processes. For the integration strategy, classical initial rates were estimated when GGPNA consumption percentages were below 50%; otherwise, maximal reaction rates of GGT were estimated by the improved integrated method and converted into initial rates according to the differential rate equation at 0.11 mmol/L GGPNA. The integration strategy was validated using optimized GGT kinetic parameters and 10-s intervals to record reaction curves within 8.0 min. By the integration strategy, there was a linear response from 0.9 to 32.0 U/L GGT, coefficients of variation were below 3.5% for GGT from 8.0 to 32.0 U/L (n=5), and GGT activities in clinical sera responded linearly to their classical initial rates at 2.00 mmol/L GGPNA with an expected slope. Therefore, the integration strategy was successful in measuring GGT at 0.12 mmol/L GGPNA.
Keywords: Integration strategy, Chromogenic substrate, Data processing, γ-Glutamyltransferase, Kinetic analysis, Serum enzyme assay
1. Introduction
Serum enzymes are important in laboratory medicine. The classical initial rate method, which is commonly used to measure serum enzymes, analyzes reaction data before the instantaneous reaction rates show obvious decreases from the average rate at the beginning of reaction. As a result, the classical initial rate method requires substrate concentrations higher than the Michaelis-Menten constant (K m) of an enzyme for desirable linear ranges. For automated assays of serum enzymes in clinical laboratories to enhance throughput and reliability, chromogenic substrates are widely used, but such substrates usually tolerate low solubility, inhibition/activation on enzymes, and/or high cost. To avoid such potential disadvantages, chromogenic substrates are always utilized at low concentrations. In these cases, the linear ranges to measure serum enzymes by the classical initial rate method are usually unsatisfactory. As an example, serum γ-glutamyltransferase (GGT; E.C. 2.3.2.2) has important diagnostic roles (Whitfield, 2001; Ruttmann et al., 2005; Turgut et al., 2006; Lim et al., 2007; Giral et al., 2008; Jo et al., 2009). To measure serum GGT, γ-glutamyl p-nitroaniline (GGPNA) is used as a chromogenic substrate (Shaw et al., 1972; Fossati et al., 1986). However, the K m of GGT for GGPNA is very high, while GGPNA solubility is very low, so that the linear ranges to measure GGT with GGPNA at practical concentrations are inevitably unsatisfactory. Therefore, alternative methods are desired for serum enzyme assays when chromogenic substrates have to be used at low concentrations.
Kinetic analysis of enzyme reaction process is an alternative method for enzyme assay, but classical methods for kinetic analysis of enzyme reaction process usually yield unreliable results (Atkins and Nimmo, 1973; Newman et al., 1974; Orsi and Tipton, 1979). Recently, an improved integrated method was developed for kinetic analysis of enzyme reaction process, using integrated rate equations with the predictor variable of reaction time to fit experimental reaction curves (Liao et al., 2001; 2003; 2005; 2006; 2007; Walsh et al., 2010). To measure enzymes, this improved integrated method gave a higher upper limit of linear response at substrate concentrations even lower than K m, but it had the disadvantage of low analysis efficiency at lower enzyme activities because, for most enzymes, reaction curves should be monitored until at least a 50% consumption of substrates. Fortunately, there is an integration strategy to solve this problem (Liao et al., 2009; Liu et al., 2009). For this integration strategy, experimental reaction curves are recorded as usual, and the method for analyzing an enzyme reaction curve is switched from the classical initial rate method to the improved integrated method upon satisfaction of a pre-defined cutoff. In detail, a reaction curve is analyzed by the classical initial rate method to derive the classical initial rate as the enzyme activity when the pre-defined switch cutoff is not satisfied; otherwise, the reaction curve is analyzed by the improved integrated rate method to estimate the maximum reaction rate (V m) and this V m is subsequently converted into an initial rate, according to the differential rate equation at a preset substrate concentration (PSC), to serve as the enzyme activity. Surely, this switch cutoff should be unique and dependent on enzyme activities. This integration strategy to measure enzyme activity has expanded linear ranges and practical efficiency at substrate concentrations comparable to or lower than K m. Hence, it is desirable to achieve this improved integrated method for an enzyme on a chromogenic substrate, to determine a switch cutoff, and then to optimize kinetic parameters, as well as experimental conditions, to validate the integration strategy for enzyme assay.
Measurement of GGT with GGPNA manifests the disadvantages of the classical initial rate method because GGPNA has low solubility, GGT has low affinity for GGPNA, and there are inhibitions of GGT by both substrates and products (London et al., 1976; Cook and Peters, 1986; Cook et al., 1987; Dvorakova et al., 1996; Stein et al., 2001; Castonguay et al., 2007). Diversified reactions of GGT on GGPNA and inhibitions of GGT by GGPNA and products complicate the kinetics of the GGT reaction on GGPNA, which results in difficulty in establishing the improved integrated method for the GGT reaction. In the present study, therefore, we investigated the improved integrated method for the GGT reaction at a GGPNA concentration with no solubility problem but obvious inhibitions on GGT, and then the integration strategy for the assay of serum GGT.
2. Materials and methods
2.1. Reagents and animals
Noniondet P40 and GGPNA were from Sigma-Aldrich (St. Louis, MO, USA). Other reagents of analytical grade were from Chongqing Beibei Chemical Factory, China. Leftover clinical sera were collected in a nearby hospital, stored at 4 °C, and analyzed within 24 h. Mice were from the Experimental Animal Center of our university. Experiments with clinical sera and mice were approved by the Ethics Commissions of Chongqing Medical University, China. Mouse kidneys were homogenized with 100 mmol/L sodium phosphate buffer (PBS) at pH 7.4 plus 0.1% Noniondet P40 at 4 °C, and the supernatant after centrifugation at 4 °C was kept at 4 °C before analyses within 12 h.
2.2. Monitoring of reaction curves and estimation of classical initial rates
In 1.20 ml of reaction mixtures, final glycinylglycine at 75 mmol/L and PBS (pH 7.4) at 100 mmol/L were used. Before GGT was added to initiate a reaction, other components, including GGPNA, were mixed and incubated at (25.0±0.5) °C for 10 min. Fifteen seconds after reaction initiation, absorbance at 405 nm <1.300 was recorded, at 2-s intervals and within 10 min unless otherwise stated, on a spectrophotometer linked to a computer (Liao et al., 2009). One unit of GGT was deemed to be the amount able to produce 1 µmol p-nitroaniline per min.
The classical initial rate was the average rate from 50 to 160 s after reaction initiation. For the integration strategy, the final GGPNA was 0.12 mmol/L and no more than 150 μl of mouse kidney homogenate or 100 μl of clinical serum was included in the reaction mixture. In order to check the validity of the integration strategy, GGT activities in clinical sera were determined by both the classical initial rate method at 2.00 mmol/L GGPNA and the integration strategy at 0.12 mmol/L GGPNA. Regression analyses of GGT activities in clinical sera by the integration strategy at 0.12 mmol/L GGPNA and the classical initial rate method at 2.00 mmol/L GGPNA both yielded a slope. The consistency of the slope with the ratios of converting factors (CFs) at the aforementioned two GGPNA concentrations, calculated via Eq. (2) as described below, supports the validity of the integration strategy.
2.3. Estimation of initial rate by the improved integrated method
There was a negligible change of absorbance due to nonenzymatic reaction within 10 min. Assigning the instantaneous absorbance in a reaction curve under analysis to A, the maximal absorbance to A m, the absorptivity of p-nitroaniline to ε, glycinylglycine concentration to c A, GGT K m for GGPNA to K m D, and the competitive inhibition constant of glycinylglycine on GGT to K i A, the differential rate equation for GGT reaction was integrated into Eq. (1) (see Appendix) (London et al., 1976):
 . .
|
(1) |
In Eq. (1), a was a constant to account for the lag time for steady-state reaction. With A m as a nonlinear parameter adjusted at the step of 0.001 for data transformation according to the left part in Eq. (1), nonlinear fitting of Eq. (1) to an experimental reaction curve gave the slope to index V m. Based on the preset GGPNA and glycinylglycine concentrations, C 1 was below 1 and C 1×(A m−A)/ε was below 0.12 mmol/L, while c A was over 74 mmol/L. Hence, ln(c A+C 1×(A m−A)/ε) is a constant, but ln((A m−A)/ε) has much larger changes during GGT reaction. Consequently, K m D and K i A potentially had great effects on V m and required optimizations while other kinetic parameters were those for hog kidney GGT (London et al., 1976).
After V m was estimated, the PSC was fixed at 0.11 mmol/L to calculate the initial rate (V i) from V m by multiplying V m with the CF defined in Eq. (2). In Eq. (2), the concentration of glycinylglycine as acceptor was taken as a constant at 75 mmol/L, and other kinetic parameters except K m D and K i A were those as reported by London et al. (1976).
 . .
|
(2) |
2.4. Integration strategy
The switch cutoff should be defined for the integration strategy. For reliable V m, the improved integrated method required at least 50% consumption of GGPNA. Clinical sera in reaction mixtures had different absorbances at 405 nm. Forty-five seconds after reaction initiation, the increase of absorbance due to the release of p-nitroaniline from GGPNA was usually below 0.050 with most sera. Therefore, for the integration strategy, the cutoff to switch from the classical initial rate method to the improved integrated method for analyzing reaction data was the increase of absorbance over 0.560 within the stated reaction duration, which corresponded to slightly more than 50% consumption of GGPNA. This switch cutoff corresponded to an initial rate of about 10 U/L GGT.
In the integration strategy, the classical initial rate was estimated when GGPNA consumption did not reach the preset cutoff, while the improved integrated method was used to estimate the initial rate when GGPNA consumption reached the preset cutoff. Absorptivity of p-nitroaniline was fixed at 9.87 [(mmol/L)·cm]−1 (London et al., 1976).
2.5. Programming and statistic analyses
The software written in Visual Basic 6.0 was used. A subprogram for the improved integrated method with GGT reaction was added and K m D and K i A were adjusted manually. By the improved integrated method, the detection limit was the initial rate with deviation within 3% from that estimated with data of 80% GGPNA consumption (Liao et al., 2009; Liu et al., 2009). The lower and upper limits of the linear response were those exhibiting deviations below twice the standard error of estimate (s) from the linear plot if the lower limit was over the detection limit; otherwise, the lower limit was the detection limit itself. Results were expressed as mean±standard deviation and compared by Student’s t-test at P<0.05 with functions in Microsoft Excel.
3. Results and discussion
3.1. Optimizations of GGT kinetic parameters
To realize the integration strategy, two linear response plots, by the classical initial rate method and the improved integrated method, should become one continuous linear plot covering expanded ranges. Hence, there should be consistent slopes of linear response and an overlapped region of initial rates measurable with consistent results by the two individual methods (Liao et al., 2009; Liu et al., 2009).
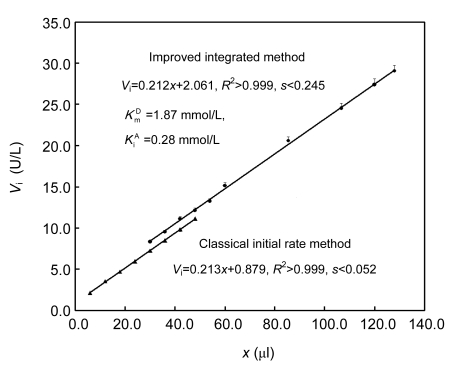
Of hog kidney GGT, K m D was 1.87 mmol/L and K i A was 0.28 mmol/L (London et al., 1976). Using this combination of K m D and K i A, the improved integrated method was feasible to measure GGT activities. However, the integration strategy was non-valid with these two kinetic parameters because the two linear plots by the two individual methods were separated (Fig. 1). For the consistency in both slopes of the linear response and initial rates within an overlapped region, K m D and K i A in Eq. (1), as well as PSC in Eq. (2), should be optimized. By the integration strategy with other one-enzyme reactions, the optimized PSC was about 93% of the initial substrate concentrations (Liao et al., 2009; Liu et al., 2009). GGT from different sources showed different kinetic parameters (London et al., 1976; Cook and Peters, 1986; Cook et al., 1987; Dvorakova et al., 1996; Stein et al., 2001; Castonguay et al., 2007). Hence, using 2-s intervals to monitor GGT reaction curves within 10 min to enhance confidence in achieving an overlapped region of initial rates measurable by the two individual methods, K m D and K i A were optimized firstly with PSC fixed at 93% of the initial GGPNA concentration.
Fig. 1.
Linear responses by the classical initial rate method and the improved integrated method using reported kinetic parameters for hog GGT
V i: initial rate; x: amount of GGT from kidney homogenate
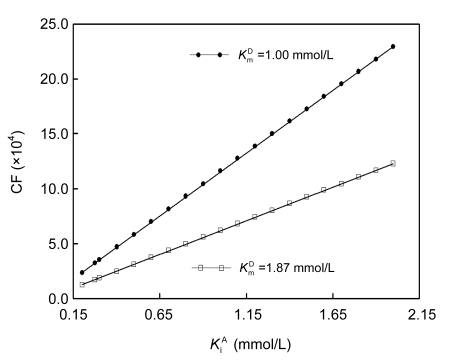
Using different combinations of K m D and K i A, both within 2.50 mmol/L, for kinetic analyses of GGT reaction curves, consistent slopes of the linear response and overlapped regions of initial rates measurable by the two individual methods were observed. However, there were still no consistent initial rates within the overlapped regions. A higher K m D yielded a larger V m, but a smaller CF defined in Eq. (2), and a higher K i A yielded a smaller V m, but a higher CF (Fig. 2). Hence, K m D and K i A had opposite effects on initial rates estimated by the improved integrated method; K i A for a preset K m D, or vice versa, should be optimized for kinetic analyses of GGT reaction curves to estimate initial rates so that the integration strategy can be validated.
Fig. 2.
Response of converting factor (CF) calculated via Eq. (2) to K i A
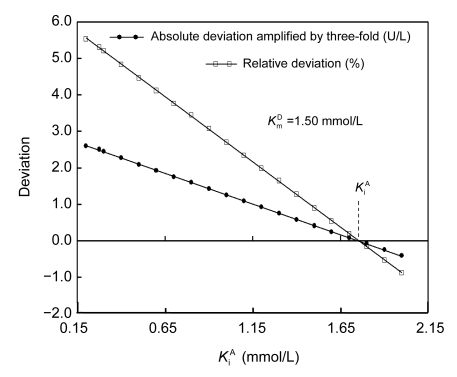
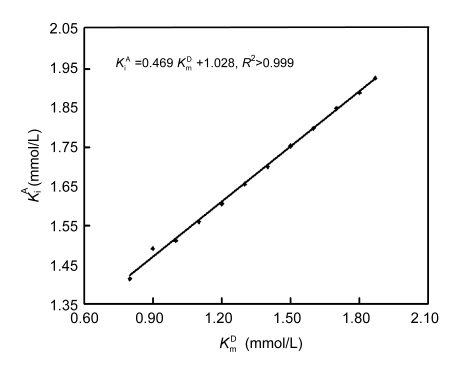
For any preset K m D, which varied from 0.80 to 2.00 mmol/L, there was always an optimal K i A to produce consistent slopes for the linear responses and negligible differences in initial rates within the aforementioned overlapped regions measurable by the two individual methods (Fig. 3). More importantly, there was a linear response of this optimal K i A for the consistent initial rates within the overlapped regions to preset K m D (Fig. 4); the optimal K i A was 1.90 mmol/L for K m D preset at 1.87 mmol/L. Therefore, it was feasible to validate the integration strategy with GGT by optimizing kinetic parameters as long as both reaction duration and intervals to monitor reaction curves were optimized; K i A at 1.90 mmol/L and K m D at 1.87 mmol/L were used throughout for kinetic analyses of GGT reaction curves, unless otherwise stated.
Fig. 3.
Optimization of K i A to validate the integration strategy with a preset K m D
Fig. 4.
Response of optimum K i A to preset K m D to validate the integration strategy
3.2. Optimizations of reaction duration and intervals to monitor reaction curves
In general, experimental conditions that simultaneously produce higher values of the upper limit of the linear response by the classical initial rate method and lower values of the detection limit by the improved integrated method are preferred, so that there are wider overlapped regions of the initial rates measurable by the two individual methods (Liao et al., 2009; Liu et al., 2009). The improved integrated method with GGT requires reaction data of over 50% substrate consumption (data not shown); this requirement restricts the initial GGPNA concentrations to be below 0.26 mmol/L because 50% consumption of GGPNA will give an absorbance of about 1.300 as the threshold measurable on common spectrophotometers. Shorter intervals to record reaction curves increase the upper limits of the linear response by the classical initial rate method and longer reaction duration reduces the detection limits by the improved integrated method (Liao et al., 2009; Liu et al., 2009). Hence, shorter intervals and longer duration to monitor reactions are preferred by the integration strategy as long as the analysis efficiency is practical.
The use of regular intervals over 20 s to monitor reactions reduced the upper limit of the linear response of GGT measured by the classical initial rate method, whereas this little affected the upper or lower limit measured by the improved integrated method. By monitoring reaction curves within 6 min at 20-s intervals, there was no overlapped region of GGT initial rates measurable by the two individual methods, and hence the integration strategy was non-valid. When the duration to monitor reaction at 20-s intervals was prolonged to 8 min or the regular intervals for monitoring reaction curves within 6 min were shortened to 10 s, there were consistent slopes of the linear response and a narrow overlapped region of GGT initial rates measurable with consistent results by the two individual methods (Table 1). Hence, GGT reaction curves were monitored within 8.0 min at 10-s intervals for enhanced confidence in validating the integration strategy.
Table 1.
Effects of regular intervals and reaction duration on the integration strategy
| Condition | Method | Equation | Upper limit (U/L) | Lower limit (U/L) |
| RD=6 min dt=10 s | Classical initial rate method | Vi=0.217x+0.879, s<0.15 | 11.0 | 0.45 |
| Improved integrated method | Vi=0.215x+0.889, s<0.21 | 32.0 | ~9.0* | |
| Integration strategy | Vi=0.216x+0.788, s<0.29 | 32.0 | 0.87 | |
| RD=6 min dt=20 s | Classical initial rate method | Vi=0.214x+0.920, s<0.17 | 10.0 | 0.51 |
| Improved integrated method | Vi=0.213x+0.933, s<0.21 | 32.0 | ~10.0* | |
| Integration strategy | Not available | |||
| RD=8 min dt=10 s | Classical initial rate method | Vi=0.217x+0.879, s<0.16 | 11.0 | 0.48 |
| Improved integrated method | Vi=0.215x+0.852, s<0.20 | 32.0 | ~9.0* | |
| Integration strategy | Vi=0.215x+0.738, s<0.20 | 32.0 | 0.93 | |
| RD=8 min dt=20 s | Classical initial rate method | Vi=0.211x+1.120, s<0.17 | 10.0 | 0.51 |
| Improved integrated method | Vi=0.213x+0.939, s<0.23 | 32.0 | ~9.0* | |
| Integration strategy | Vi=0.214x+0.930, s<0.30 | 32.0 | 0.90 | |
| RD=8 min dt=30 s | Classical initial rate method | Vi=0.208x+1.080, s<0.21 | 9.0 | 0.63 |
| Improved integrated method | Vi=0.204x+1.470, s<0.24 | 32.0 | ~10.0* | |
| Integration strategy | Not available | |||
The same series of reaction curves were analyzed after adjusting the regular intervals and/or the reaction duration. All linear response equations gave R 2>0.99
indicated the detection limit was higher than the lower limit and hence the detection limit itself was used as the lower limit
RD: reaction duration; dt: regular interval; V i: initial rate; x: amount of GGT from kidney homogenate
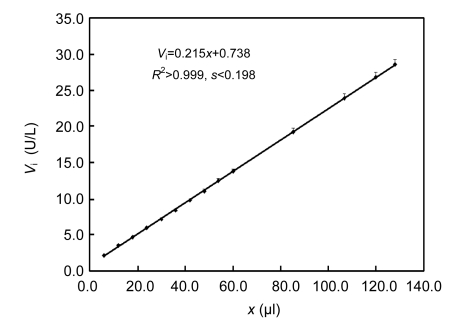
By the integration strategy under conditions as optimized above, initial rates from 0.9 to 32.0 U/L responded linearly to amounts of GGT from mouse kidney (Fig. 5), whose upper limit was increased by nearly three-fold and the lower limit was comparable to that by the classical initial rate method alone at the same GGPNA level. The within-run coefficients of variation (CVs) were below 3.5% for GGT varying from 8.0 to 32.0 U/L (n=5 for each sample). Therefore, the integration strategy was effective to GGT on GGPNA and was potentially applicable to measure GGT in clinical sera.
Fig. 5.
Linear responses of initial rates (V i) by the integration strategy to GGT amounts (x) in mouse kidney homogenate using data recorded at 10-s intervals within 8.0 min
3.3. Preliminary application of the integration strategy to clinical sera
Optimal K m D and K i A were tested with three clinical sera whose GGT activities were measurable by the two individual methods. Using an optimized K i A according to the relationship in Fig. 4 for a K m D varying from 0.80 to 2.00 mmol/L, there were still consistent initial rates measurable by the two individual methods. Hence, K m D and K i A, optimized above, were potentially effective for clinical sera.
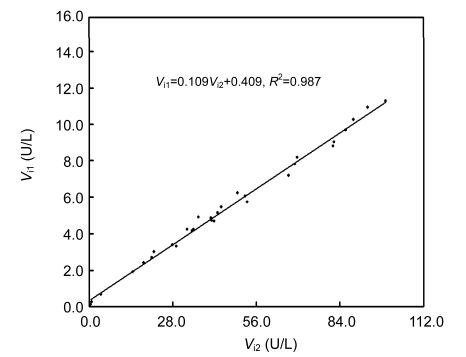
It is putative that the same amount of an enzyme should have the same V m independent of concentrations of a chromogenic substrate. Thirty-one clinic sera with the widest distribution of classical initial rates of GGT at 2.00 mmol/L GGPNA were selected after screening of a pool of over 150 clinical sera to check the validity of the integration strategy. Of these 31 clinical sera, initial rates of GGT by the integration strategy responded linearly to classical initial rates at 2.00 mmol/L GGPNA with a slope of 0.109 (Fig. 6). Calculated via Eq. (2), the ratio between CF at 0.12 mmol/L GGPNA and that at 2.0 mmol/L GGPNA was 0.110, which was consistent with the aforementioned slope. The consistency of this slope with expectations strongly supports the validity of the integration strategy. Lipids, bilirubin, and hemoglobin in clinical sera had negligible interference with GGT assay by the integration strategy when the background absorbance was below 0.650; otherwise, background absorbance should be corrected to monitor reaction curves with more than 50% consumption of GGPNA.
Fig. 6.
Regression of initial rates of GGT in clinical sera by the integration strategy at 0.12 mmol/L GGPNA on classical initial rates of these GGT at 2.00 mmol/L GGPNA
V i1: initial rate of the integration strategy at 0.12 mmol/L GGPNA; V i2: initial rate of the classical initial rate method at 2.00 mmol/L GGPNA
3.4. Further discussion
To measure enzymes, the improved integrated method prefers substrate concentrations close to K m, supporting that GGPNA is unfavorable for GGT assay due to high K m. At 0.12 mmol/L GGPNA, however, the integration strategy effectively expanded the linear range at practical analysis efficiency, and the use of 10-s intervals to monitor reactions enabled operation of multiple sera in parallel on autoanalyzers to enhance the throughput. Therefore, the integration strategy was successful in measuring GGT at GGPNA concentrations much lower than K m.
By the classical initial rate method, no chromogenic substrates for serum lipase assay are satisfactory due to their low solubility (Tsao et al., 2007; Yamada and Fujita, 2007); chromogenic maltotrioside substrates for direct assay of serum α-amylase are also unsatisfactory due to the cost (Winn-Deen et al., 1988; Gella et al., 1997). Taken together, when concentrations of chromogenic substrates are limited by their solubility, cost, substrate inhibition/activation, and/or measurable ranges on instruments, the integration strategy is an effective and general alternative to measure serum enzymes with expanded linear ranges and practical efficiency, and the optimizations of reaction duration and regular intervals to monitor reaction curves can be general guidelines to validate the integration strategy at low concentrations of chromogenic substrates.
Appendix: Integrated rate equations of GGT reaction
The following symbols are defined:
A: instantaneous absorbance of GGT reaction mixture containing background;
A m: maximal product absorbance containing background;
c A: concentration of glycinylglycine (acceptor);
c D: concentration of GGPNA (donor);
CF: converting factor for V m to V i;
K m: Michaelis-Menten constant;
K m A: K m of glycinylglycine (acceptor);
K m DA: K m of donor acting as acceptor;
K m D: K m of donor (GGPNA);
K i A: competitive inhibition constant of acceptor;
V i: initial rate;
c P: instantaneous concentration of p-nitroaniline;
V m: maximal reaction rate of GGT.
 , ,
|
(A1) |
 , ,
|
(A2) |
 , ,
|
(A3) |
 , ,
|
(A4) |
 . .
|
(A5) |
Reaction kinetics for GGT followed Eq. (A6) (London et al., 1976):
 . .
|
(A6) |
During the GGT reaction, the concentrations of GGPNA (c D) were decreasing, and the concentrations of p-nitroaniline (c P) were increasing, whereas the concentrations of the acceptor glycinylglycine (c A) were constant because the initial concentration of GGPNA accounted for less than 2% of the initial value of c A. Hence, after the rearrangement of Eq. (A6), there was Eq. (A7) that was further rearranged into Eq. (A8):
 , ,
|
(A7) |
 . .
|
(A8) |
In the GGT reaction mixture, the production of 1 mol of p-nitroaniline consumed 1 mol of the donor GGPNA and there was negligible change of absorbance in 10 min without GGT. Consequently, dc P was equal to −dc D and Eq. (A8) was converted into Eq. (A9):
 . .
|
(A9) |
And the integration of both parts in Eq. (A9) within the reaction duration under analysis gave Eq. (A10) with a as the constant to account for the lag time of steady-state reaction:
 . .
|
(A10) |
Assigning the left part in Eq. (A10) to y, Eq. (A11) for data transformation was obtained:
 . .
|
(A11) |
Assuming that there was a constant background absorbance, Eq. (A12) was fit to GGT reaction curves for estimating V m after data transformation according to Eq. (A11):
| y=a−Vm×t. | (A12) |
Footnotes
Project supported by the National Natural Science Foundation of China (No. 30200266) and the Program for New Century Excellent Talents in University of Ministry of Education of China (No. NCET-09-928)
References
- 1.Atkins GL, Nimmo IA. The reliability of Michaelis-Menten constants and maximum velocities estimated by using the integrated Michaelis-Menten equation. Biochem J. 1973;135(3):779–784. doi: 10.1042/bj1350779. [DOI] [PMC free article] [PubMed] [Google Scholar]
- 2.Castonguay R, Halim D, Morin M, Furtos A, Lherbet C, Bonneil E, Thibault P, Keillor JW. Kinetic characterization and identification of the acylation and glycosylation sites of recombinant human γ-glutamyltranspeptidase. Biochemistry. 2007;46(43):12253–12262. doi: 10.1021/bi700956c. [DOI] [PubMed] [Google Scholar]
- 3.Cook ND, Peters TJ. The simultaneous hydrolysis of glutathione and glutamine by rat kidney γ-glutamyltransferase. Biochim Biophys Acta. 1986;884(1):207–210. doi: 10.1016/0304-4165(86)90245-x. [DOI] [PubMed] [Google Scholar]
- 4.Cook ND, Upperton KP, Challis BC, Peters TJ. The donor specificity and kinetics of the hydrolysis reaction of γ-glutamyltransferase. Biochim Biophys Acta. 1987;914(3):240–245. doi: 10.1016/0167-4838(87)90283-4. [DOI] [PubMed] [Google Scholar]
- 5.Dvorakova L, Krusek J, Stastny F, Lisy V. Analysis of kinetic properties of γ-glutamyl transpeptidase from rat kidney. Gen Physiol Biophys. 1996;15(5):403–413. [PubMed] [Google Scholar]
- 6.Fossati P, Melzi d′Eril GV, Tarenghi G, Prencipe L, Berti G. A kinetic colorimetric assay of γ-glutamyl-transferase. Clin Chem. 1986;32(8):1581–1584. [PubMed] [Google Scholar]
- 7.Gella FJ, Gubern G, Vidal R, Canalias F. Determination of total and pancreatic α-amylase in human serum with 2-chloro-4-nitrophenyl-α-d-maltotrioside as substrate. Clin Chim Acta. 1997;259(1-2):147–160. doi: 10.1016/S0009-8981(96)06481-9. [DOI] [PubMed] [Google Scholar]
- 8.Giral P, Jacob N, Dourmap C, Hansel B, Carrié A, Bruckert E, Girerd X, Chapman MJ. Elevated γ-glutamyltransferase activity and perturbed thiol profile are associated with features of metabolic syndrome. Arterioscler Thromb Vasc Biol. 2008;28(3):587–593. doi: 10.1161/ATVBAHA.107.157891. [DOI] [PubMed] [Google Scholar]
- 9.Jo SK, Lee WY, Rhee EJ, Won JC, Jung CH, Park CY, Oh KW, Park SW, Kim SW. Serum γ-glutamyl transferase activity predicts future development of metabolic syndrome defined by 2 different criteria. Clin Chim Acta. 2009;403(1-2):234–240. doi: 10.1016/j.cca.2009.03.035. [DOI] [PubMed] [Google Scholar]
- 10.Liao F, Liu WL, Zhou QX, Zeng ZC, Zuo YP. Assay of serum arylesterase activity by fitting to the reaction curve with an integrated rate equation. Clin Chim Acta. 2001;314(1-2):67–76. doi: 10.1016/S0009-8981(01)00631-3. [DOI] [PubMed] [Google Scholar]
- 11.Liao F, Tian KC, Yang X, Zhou QX, Zeng ZC, Zuo YP. Kinetic substrate quantification by nonlinear fitting reaction curve to integrated Michaelis-Menten equation. Anal Bioanal Chem. 2003;375(6):756–762. doi: 10.1007/s00216-003-1829-x. [DOI] [PubMed] [Google Scholar]
- 12.Liao F, Zhu XY, Wang YM, Zuo YP. The comparison of the estimation of enzyme kinetic parameters by fitting reaction curve to the integrated Michaelis-Menten rate equations of different predictor variables. J Biochem Biophys Methods. 2005;62(1):13–24. doi: 10.1016/j.jbbm.2004.06.010. [DOI] [PubMed] [Google Scholar]
- 13.Liao F, Zhao YS, Zhao LN, Tao J, Zhu XY, Liu L. The evaluation of a direct kinetic method for serum uric acid assay by predicting the background absorbance of uricase reaction solution with an integrated method. J Zhejiang Univ-Sci B. 2006;7(6):497–502. doi: 10.1631/jzus.2006.B0497. [DOI] [PMC free article] [PubMed] [Google Scholar]
- 14.Liao F, Zhao LN, Zhao YS, Tao J, Zuo YP. Integrated rate equation considering product inhibition and its application to kinetic assay of serum ethanol. Anal Sci. 2007;23(4):439–444. doi: 10.2116/analsci.23.439. [DOI] [PubMed] [Google Scholar]
- 15.Liao F, Yang DY, Tang JQ, Yang XL, Liu BZ, Zhao YS, Zhao LN, Liao H, Yu MA. The measurement of serum cholinesterase activities by an integration strategy with expanded linear ranges and negligible substrate-activation. Clin Biochem. 2009;42(9):926–928. doi: 10.1016/j.clinbiochem.2008.11.016. [DOI] [PubMed] [Google Scholar]
- 16.Lim JS, Lee DH, Park JY, Jin SH, Jacobs DR. A strong interaction between serum γ-glutamyltransferase and obesity on the risk of prevalent type 2 diabetes: results from the third national health and nutrition examination survey. Clin Chem. 2007;53(6):1092–1098. doi: 10.1373/clinchem.2006.079814. [DOI] [PubMed] [Google Scholar]
- 17.Liu BZ, Zhao YS, Zhao LN, Xie YL, Zhu S, Li ZR, Liu Y, Lu W, Yang XL, Xie GM, et al. An integration strategy to estimate the initial rates of enzyme reactions with much expanded linear ranges using uricases as models. Anal Chim Acta. 2009;631(1):22–28. doi: 10.1016/j.aca.2008.10.021. [DOI] [PubMed] [Google Scholar]
- 18.London JW, Shaw LM, Fetterolf D, Garfinkel D. Determination of the mechanism and kinetic constants for hog kidney γ-glutamyltransferase. Biochem J. 1976;157(3):609–617. doi: 10.1042/bj1570609. [DOI] [PMC free article] [PubMed] [Google Scholar]
- 19.Newman PFJ, Atkins GL, Nimmo IA. The effects of systematic error on the accuracy of Michaelis constant and maximum velocities estimated by using the integrated Michaelis-Menten equation. Biochem J. 1974;143(3):779–781. doi: 10.1042/bj1430779. [DOI] [PMC free article] [PubMed] [Google Scholar]
- 20.Orsi BA, Tipton KF. Kinetic analysis of progress curves. Methods Enzymol. 1979;63:159–183. doi: 10.1016/0076-6879(79)63010-0. [DOI] [PubMed] [Google Scholar]
- 21.Ruttmann E, Brant LJ, Concin H, Diem G, Rapp K, Ulmer H. γ-Glutamyltransferase as a risk factor for cardiovascular disease mortality. An investigation in a cohort of 163 944 Austrian adults. Circulation. 2005;112(14):2130–2137. doi: 10.1161/CIRCULATIONAHA.105.552547. [DOI] [PubMed] [Google Scholar]
- 22.Shaw LM, London JW, Fetterolf D, Garfinkel D. γ-Glutamyltransferase: kinetic properties and assay conditions when γ-glutamyl-4-nitroanilide and its 3-carboxy derivative are used as donor substrates. Clin Chem. 1972;23(1):79–85. [PubMed] [Google Scholar]
- 23.Stein RL, DeCicco C, Nelson D, Thomas B. Slow-binding inhibition of γ-glutamyl transpeptidase by γ-boroGlu. Biochemistry. 2001;40(19):5804–5811. doi: 10.1021/bi010147i. [DOI] [PubMed] [Google Scholar]
- 24.Tsao FH, Shanmuganayagam D, Zachman DK, Khosravi M, Folts JD, Meyer KC. A continuous fluorescence assay for the determination of calcium-dependent secretory phospholipase A2 activity in serum. Clin Chim Acta. 2007;379(1-2):119–123. doi: 10.1016/j.cca.2006.12.023. [DOI] [PubMed] [Google Scholar]
- 25.Turgut O, Yilmaz A, Yalta K, Karadas F, Birhan YM. γ-Glutamyltransferase is a promising biomarker for cardiovascular risk. Med Hypotheses. 2006;67(5):1060–1064. doi: 10.1016/j.mehy.2006.04.010. [DOI] [PubMed] [Google Scholar]
- 26.Walsh R, Martin E, Darvesh S. A method to describe enzyme-catalyzed reactions by combining steady state and time course enzyme kinetic parameters. Biochim Biophys Acta. 2010;1800(1):1–5. doi: 10.1016/j.bbagen.2009.10.007. [DOI] [PubMed] [Google Scholar]
- 27.Whitfield JB. γ-Glutamyl transferase. Crit Rev Clin Lab Sci. 2001;38(4):263–355. doi: 10.1080/20014091084227. [DOI] [PubMed] [Google Scholar]
- 28.Winn-Deen ES, David H, Sigler G, Chavez R. Development of a direct assay for alpha-amylase. Clin Chem. 1988;34(10):2005–2008. [PubMed] [Google Scholar]
- 29.Yamada M, Fujita T. New procedure for the measurement of pancreatic lipase activity in human serum using a thioester substrate. Clin Chim Acta. 2007;383(1-2):85–90. doi: 10.1016/j.cca.2007.04.021. [DOI] [PubMed] [Google Scholar]


