

Abstract
Winegrape is an important perennial crop in California, USA. Each year California winegrape farming consumes about 20 million kilograms of pesticides that have been a pollutant source to the fresh water systems of the state. The variation of pesticide use among winegrape growers has been significant. It has been observed that some growers have developed effective ways to reduce pesticide use, yet control pests efficiently to ensure harvest. Identification of the growers with low and high pesticide use is very helpful to extension programs that aim on reducing pesticide environmental risk. In this study, an index approach is proposed to quantitatively measure pesticide use intensity at grower level. An integrated pesticide use index is developed by taking pesticide quantity and toxicity into account. An additive formula and a multiplying formula were used to calculate the pesticide use index, i.e., PUI and PUIM. It was found that both PUI and PUIM were capable of identifying the low and high pesticide users while PUI was slightly more conservative than PUIM. All pesticides used in California winegrape farming were taken into account for calculating the indices. Madera County, one of the largest winegrape producers in California, was taken as an example to test the proposed approach. In year 2000, among the total 208 winegrape growers, 28 with PUI≤10 and 34 with 10<PUI≤20 were identified as low pesticide users who were characterized with both low quantity and low toxicity of pesticide use. Most of the growers had small-sized vineyards, i.e., one field and small planted areas. Furthermore, they had very low pesticide use intensity, used only 1–2 types of pesticides (mainly fungicides), applied few pesticides (1–3 only), and emphasized the use of low toxicity compounds. Meanwhile, 19 growers with PUI>60, identified as high pesticide users, had large-sized vineyards, i.e., more fields and large planted areas. They used all types of pesticides and many compounds, which indicated that their pest controls heavily depended on pesticides rather than on-farm management. Through the case study, the proposed approach proved to be useful for analyzing the growers’ pesticide use intensities and interpreting their pesticide use behaviors, which led to a new start point for further investigation of searching ways to reduce pesticide environmental risk.
Keywords: Pesticide use index, Toxicity, Compound, Pesticide environmental risk, California
1. Introduction
California’s 2.6 billion-dollar output of winegrape farming needs pesticide application to ensure harvest. Each year about 20 million kilograms of pesticides are used for winegrape in California. Madera County is one of the largest winegrape producers. In 2000, there were 2.4×10⁴ ha of vineyards in the county, and 2.386×10⁶ kg pesticides were used for winegrape farming, ranking among the top counties of California.
The large amount of pesticides used in California carries significant risk to the environment, ecosystem, and public health. A number of important water bodies in California, such as the San Joaquin River, have been contaminated with pesticides (Domagalski and Dubrovsky, 1992; Domagalski, 1996; 1997a; 1997b; Zhang et al., 1997). Many efforts have been made to protect the scarce fresh water resources in the state (Clark et al., 1998). Contamination of pesticides to surface water and ground acqua had also been reported in many places of the world (Thrupp, 1990; 1991; Leonard, 2000; Reus et al., 2002; Kong et al., 2004). In order to balance pesticide application and environmental protection, emphasis on low-risk farming to reduce pesticide use through alternative farm management practices has gained more and more encouragements from governmental agencies, scientists, farm management advisers, farmers, and the public (Lewis et al., 1997a; 1997b; Fitt, 2000; Gamliel et al., 2000; MacHardy, 2000). Some government departments, such as the United States’ Environmental Protection Agency (US EPA), California’s Department of Food and Agriculture (CDFA), and California’s Department of Pesticide Registration (CDPR), have made great efforts in reducing pesticide environmental risk. Several programs in the extension of low-risk farming practices, such as Biologically Integrated Orchard Systems (BIOS) (Santer, 1995; Epstein et al., 2001), have been initiated in California. Success of these programs requires identifying the farmers with low pesticide use and analyzing their farming management practices, because their practices might serve as valuable models to the rest of the farming community.
Farming management practice varies among crops, geographic regions, and individual farmers, which results in various intensities in pesticide use. For example, in 2000, the pesticide use intensity of winegrape farming was 129.17 kg/ha in Merced and 99.12 kg/ha in Madera, while it was 63.07 kg/ha in Santa Barbara and 36.84 kg/ha in Napa. Among the other main cropping counties in California the intensity was as follows: Sacramento 103.54 kg/ha, Monterey 88.92 kg/ha, Fresno 81.87 kg/ha, Kern 73.88 kg/ha, Sonoma 68.63 kg/ha, Mendocino 65.95 kg/ha, and San Luis Obispo 6.84 kg/ha. It can be seen that the highest intensity was 14 times more than the lowest.
It has been proved that effective farming management practices can reduce the dependence on pesticides. Hendricks (1995) studied the relationship between grower’s practice and pesticide use in Merced County and found that almond growers altered many aspects of farm management by developing production strategies, which could successfully reduce or eliminate insecticide use. The interrelated alterations in floor management, orchard sanitation, and harvest timing are the core of an extension program called BIOS (Santer, 1995). The locally adapted almond growing practices initiated by BIOS proved to be a useful way for reducing insecticide use (Hendricks, 1995; Pence and Grieshop, 2001). The direct outcome for those participants of BIOS was to decrease dependence on agrochemicals (pesticides and fertilizers), enrich knowledge on local ecological processes, and understand how orchard management interacts with the local ecological processes (Bugg and van Horn, 1998). Epstein et al. (2000) reported that the BIOS program introduced an alternative to reduce the use of organophosphates not only in dormant seasons, originally recommended by University of California’s Integrated Pest Management (UC IPM) program, but also in growing seasons. In the following years after BIOS was implemented, Merced County achieved the largest percentage reduction in organophosphate usage (Epstein et al., 2000). California owns the most complete pesticide use reporting (PUR) system in the world and a huge PUR database has been developed. Detailed information of farmers’ pesticide use at field level can be found in PUR database. Thus, the database has been widely used in farming pest control, pesticide application, and environmental studies. However, use of the information of the PUR database to identify on-farm innovations in reducing pesticide environmental risk has not yet been reported.
A number of studies have been devoted to assessing pesticide environmental risk (SETAC, 1994; Levitan and Merwin, 1995; Solomon et al., 1996; Giesy et al., 1999; Cory, 2000; Hall et al., 2000; Levitan, 2000). Vercruysse and Steurbaut (2002) proposed several indices to assess pesticide risks for workers, bystanders, and aquatic organisms. Based on the separate indices, a comprehensive index for general assessment of environmental risks was also developed. Solomon et al. (2000) proposed an ecological risk assessment method by using probability distribution functions to independently describe exposure concentrations and toxicological responses of aquatic organisms to pesticide compounds. An environmental yardstick had been developed in the Netherlands as a practical indicator for farmers to select pesticides with the least environmental impacts (Reus and Leendertse, 2000). Eight indicators had been compared for the evaluation of pesticide environmental risk in Europe (Reus et al., 2002). Most of these evaluations were conducted on the pesticide level and none was on the grower level.
This study aims to develop an index approach for assessing the pesticide use of winegrape growers in order to identify on-farm innovations that help to reduce pesticide environmental risk. There are two important aspects in pesticide usage: the application dosage of pesticides (quantity) and the toxicity of the pesticide applied. In reality, there are more than 150 pesticides used in winegrape farming in Madera County, and each individual grower has his own preference in pesticide application. Furthermore, different compounds have different toxicities after releasing to environment. Therefore, different compounds, various dosages, different toxicities of the compounds, and incomparability among the compounds create complexity in assessing pesticide use at the grower level. The proposed index approach tries to provide a tool for this kind of pesticide use assessment. In developing the approach, the hypothesis relies on the following assumptions: those growers with large application dosage of pesticide and those with a preference for using higher toxic pesticides have larger impacts on the environment. Based on the case study in Madera County, the proposed approach for assessing grower pesticide usage and identifying low and high pesticide users at grower and field levels is presented and discussed in the following sections.
2. Materials and methods
2.1. Principles
In agricultural practice, it has been observed that some farmers are likely to look for alternative farming management strategies, and some farmers have already found useful ways to reduce pesticide use while keeping a profitable economic output. It is very necessary to identify low and high pesticide users. The low pesticide users can serve as candidates for further investigation to identify valuable farming management practices that can be used as model farming systems for extension programs. The high pesticide users can serve as main targets of the extension programs. If the pesticide usages of the high users are significantly reduced through the extension of the experiences and practices of the low users, the total use of pesticides would be remarkably reduced, and hence the risks of pesticides on environment would also be reduced.
In order to develop an applicable approach for assessing pesticide use at the grower level, a case study was carried out based on the data of years 1999, 2000, and 2001 of Madera County. The data source is PUR database. For the low pesticide users mentioned in the paper, the criteria involve two aspects: quantity and toxicity.
By quantity, low pesticide user means that the dosage of pesticides applied in a specific area (hectare) within a period (year) is low. Some farmers used the same pesticide several times in their fields, while others used only it once a year. For a comparable scale of measuring pesticide use, kilogram per hectare (kg/ha) planted within a year was used to indicate the pesticide use intensity in the winegrape farming systems in Madera County. Therefore, the low pesticide user in the following analysis means low intensity at the grower level. Since different pesticide compounds have different effects in pest control, application amounts of different pesticides are not simply comparable. Thus, when several compounds are in use, it is not meaningful to compare the overall intensity for the assessment.
The toxicities of different pesticides are different. Therefore, the amount of pesticides used in an area unit cannot be used as the only criteria, because it cannot meet the purpose of evaluating the growers’ farming practice and identifying the low pesticide users. Since the purpose of identifying low pesticide users is to search farming models for extension programs of reducing pesticide environmental risk, toxicities of compounds must be taken into account. Therefore, the quantity and toxicity of the pesticide were considered and given equal importance in the following analysis.
2.2. Pesticide use index
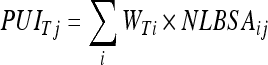
In order to establish an index to evaluate pesticide use at grower level, the quantity and toxicity of pesticide were used as the weights. Since a number of pesticide compounds were in use and the incomparability among the compounds is obvious, an integrated index was used for the evaluation. The index can be constructed in either an additive form or multiplicative one, which are
| PUIj=WQ×PUIQj+WT×PUITj, | (1) |
| PUIMj=PUIQj×PUITj, | (2) |
where PUIj is the integrated index of pesticide use constructed in additive form for the jth grower, and PUIMj is the integrated index constructed in multiplying form. PUIQj is the quantity index contributed by the amounts of pesticides used, PUITj is the toxicity index contributed by the toxicities of pesticides used, and W Q and W T are, respectively, the weights of the quantity index and the toxicity index. Since equal importance was given to the quantity and toxicity of the pesticide in formulating the index, W Q and W T were respectively defined as 0.5.
Generally speaking, the index composed by either the additive or multiplying form is supposed to indicate the same low pesticide user. Thus, the two indices should be able to correctly reflect the pesticide use level for identifying the low and high pesticide users. In order to verify this hypothesis, results from the two indices were compared in Section 3.6.
The quantity index and the toxicity index in Eqs. (1) and (2) can be computed as follows:
 , ,
|
(3) |
 , ,
|
(4) |
where W Qi is the quantity weight of the ith pesticide; W Ti is the toxicity weight of the ith pesticide; LBSAij is the jth grower’s pesticide use intensity of the ith pesticide, in the dimension of kg/ha.
In Madera County, more than 150 pesticides were used in 1999–2001. Each pesticide has a different intensity in magnitude of use. If this dimension difference was omitted, it is very possible that only those pesticides with large application dosage would be noticed. In order to give each compound the same importance in this dimension, the use intensities of all the compounds were normalized before computing the indices.
Regional average (i.e., the county average in the case) is an important indicator of pesticide use level, and was used as a benchmark in the study. The growers with pesticide use intensity higher than the regional average should be viewed as high pesticide users. Thus, it is necessary to normalize the pesticide use intensity of each grower according to the county average by using the following formula:
| NLBSAij=LBSAij/LBSAci, | (5) |
where NLBSAij is the jth grower’s normalized pesticide use intensity of the ith pesticide and LBSAci is the county average of the ith compound used. Thus, Eqs. (3) and (4) for PUIQj and PUITj can be rewritten as follows:
 , ,
|
(6) |
 . .
|
(7) |
The higher PUIQi and PUITj, the higher the grower pesticide use level was, which indicates that the grower brought higher risk potential to environment through pesticide use in his farming practice.
One problem arises when applying PUIQj and PUITj to compute PUIj, which is caused by considering equal importance to them in Eqs. (1) and (2), while they might have different scales after computing from Eqs. (6) and (7). Thus, PUIQj and PUITj need to be projected into the same scale before computing PUIj, which is to scale the data column according to the maximum of the column, i.e., in the following formulae:
| PUIqj=PUIQj/PUIQm, | (8) |
| PUItj=PUITj/PUITm, | (9) |
where PUIqj and PUItj are the scaled PUIQj and PUITj of the jth grower, PUIQm and PUITm are the maxima of PUIQj and PUITj, respectively. Thus, Eqs. (1) and (2) can be rewritten as follows for the jth grower:
| PUIj=PUIqj+PUItj, | (10) |
| PUIMj=PUIqj×PUItj. | (11) |
The integrated pesticide use index means that the higher either PUIj or PUIMj, the higher pesticide use level for the jth grower/field, and vise versa. The higher pesticide use level implies the higher environmental risk of the grower’s pesticide use. Thus, to identify low pesticide users becomes to identify the growers with low PUI. Ranking the growers according to their PUIs, low and high pesticide users in the region can be easily classified.
2.3. Quantity weight determination
The above index is based on the quantity weight (W Qi) and toxicity weight (W Ti) for the ith pesticide compound. Thus, it is essential to determine the weights. For quantity weight, the following arguments were used when referring to pesticide environmental risk. Within a specific geographic area, such as the county in the study, the larger the amount of pesticide use, the greater impact the pesticide has on environment; hence, the higher priority of attention should be given to the pesticide in achieving the reduction of pesticide use to lower environmental risk. The argument provides a method to treat the quantity weight for establishing the index. Those pesticides with a larger amount of total use in the county have a higher weight and hence are given more attention to. Those pesticides with only a few kilograms of use have a lower weight than those with, for example, several thousand kilograms of use in formulating the quantity index.
As for Madera County, sulfur was the largest pesticide compound used in winegrape farming in the years of the study. The total amount of sulfur use was high, up to 1.832×10⁶ kg in 2000, accounting for above 90% of the total amount of pesticides used in the county. Table 1 lists the top 40 pesticides used in winegrape in Madera County during 1999–2001. And Fig. 1 plots the total amount of each pesticide in descending order.
Table 1.
Top 40 pesticides used for winegrape production in Madera County, California during 1999–2001
| Order | Chemical code | Chemical name | Total amount of use (kg) |
|||
| 1999 | 2000 | 2001 | Average | |||
| 1 | 560 | Sulfur | 1 568 043.4 | 1 847 072.9 | 1 350 594.0 | 1 588 570.1 |
| 2 | 173 | Cryolite | 37 608.3 | 28 288.9 | 15 802.8 | 27 233.3 |
| 3 | 2273 | Sodium tetrathiocarbonate | 34 437.7 | 23 619.5 | 3 753.0 | 20 603.4 |
| 4 | 1855 | Glyphosate, isopropylamine salt | 15 838.4 | 22 532.8 | 15 088.6 | 17 819.9 |
| 5 | 151 | Copper hydroxide | 22 745.8 | 15 638.0 | 11 992.7 | 16 792.1 |
| 6 | 445 | Propargite | 13 825.5 | 12 410.9 | 5 162.6 | 10 466.4 |
| 7 | 531 | Simazine | 7 687.4 | 8 873.8 | 7 698.7 | 8 086.6 |
| 8 | 1601 | Paraquat dichloride | 4 817.3 | 7 540.6 | 7 310.4 | 6 556.1 |
| 9 | 358 | Lime-sulfur | 11 569.7 | 3 454.2 | 575.8 | 5 199.9 |
| 10 | 1868 | Oryzalin | 7 083.4 | 5 755.6 | 108.9 | 4 316.0 |
| 11 | 748 | Alkylaryl poly(oxyethylene) glycol | 2 778.8 | 5 334.7 | 3 054.1 | 3 722.5 |
| 12 | 1973 | Oxyfluorfen | 3 308.2 | 3 953.8 | 2 798.5 | 3 353.5 |
| 13 | 629 | Ziram | 6 626.0 | 2 076.0 | 1 118.2 | 3 273.4 |
| 14 | 714 | Copper | 2 915.6 | 5 298.0 | 1 164.5 | 3 126.0 |
| 15 | 99 | Calcium hydroxide | 1 773.9 | 1 506.1 | 3 811.0 | 2 363.7 |
| 16 | 765 | Petroleum oil, unclassified | 1 149.7 | 845.1 | 750.2 | 250.5 |
| 17 | 231 | Diuron | 870.0 | 2 608.9 | 2 338.9 | 1 939.2 |
| 18 | 1314 | Poly-i-para-menthene | 2 079.0 | 2 814.5 | 698.6 | 1 864.1 |
| 19 | 158 | Copper oxychloride sulfate | 1 905.4 | 3 282.8 | 167.7 | 1 785.3 |
| 20 | 2019 | Norflurazon | 1 944.5 | 1 754.6 | 1 464.7 | 1 721.3 |
| 21 | 1728 | Napropamide | 0.0 | 604.0 | 2 010.1 | 1 307.0 |
| 22 | 211 | Mancozeb | 1 700.0 | 1 131.0 | 1 030.5 | 1 287.2 |
| 23 | 1857 | Fenamiphos | 700.2 | 1 745.4 | 1 298.4 | 1 248.0 |
| 24 | 2327 | Glyphosate-trimesium | 776.3 | 766.6 | 1 860.3 | 1 134.4 |
| 25 | 763 | Petroleum distillates | 714.8 | 1 743.0 | 885.7 | 1 114.5 |
| 26 | 616 | Metam-sodium | 0.0 | 960.1 | 1 200.1 | 1 080.1 |
| 27 | 1159 | Modified phthalic glycerol alkyd resin | 1 500.4 | 1 287.2 | 426.8 | 1 071.4 |
| 28 | 597 | Trifluralin | 614.9 | 1 635.0 | 383.9 | 877.9 |
| 29 | 3519 | Methyl soyate | 61.4 | 1 939.1 | 523.1 | 841.2 |
| 30 | 3957 | Tebufenozide | 0.0 | 703.4 | 883.7 | 793.6 |
| 31 | 2245 | Myclobutanil | 702.0 | 996.1 | 559.2 | 752.4 |
| 32 | 1552 | Benomyl | 1 026.6 | 1 096.2 | 73.8 | 732.2 |
| 33 | 1743 | Nonylphenoxy poly(ethyleneoxy) ethanol | 485.8 | 701.9 | 963.7 | 717.1 |
| 34 | 2081 | Iprodione | 845.1 | 750.2 | 250.5 | 615.3 |
| 35 | 3850 | Tebuconazole | 374.4 | 941.8 | 466.8 | 594.4 |
| 36 | 2337 | Encapsulated δ-endotoxin of Bacillus thuringiensis var. kurstaki in killed pseudomonas fluorescens | 889.9 | 659.2 | 149.8 | 566.3 |
| 37 | 806 | 2,4-D, dimethylamine salt | 577.9 | 702.1 | 408.8 | 562.9 |
| 38 | 342 | Isopropyl alcohol | 514.4 | 659.6 | 448.4 | 540.8 |
| 39 | 346 | Dicofol | 693.3 | 773.6 | 27.2 | 498.1 |
| 40 | 335 | Phosmet | 535.6 | 446.9 | 0 | 491.2 |
Fig. 1.

Average amounts of pesticides used for winegrape farming in Madera County during 1999–2001
The orders of the chemicals show the ranks of the pesticides according to the amount of use. Names of the chemicals for the corresponding orders are given in Table A1
In order to determine the quantity weight, the total weight of all pesticides was defined as 100 (
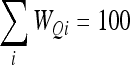 |
) and the weight for each individual compound was estimated according to its total amount of use. For the three years of analysis, the average of the total amount was used for the computation. However, this computation could be highly biased for the first compound, i.e., sulfur, because the amount of sulfur use was too large (accounting for above 90% of the total). Clearly, this was not expected for establishing the pesticide use index. To improve the result, one solution is to compromise the computation according to the curve shown in Fig. 1. In fact, the usages of the top 10 compounds were about 1.709×10⁶ kg, accounting for 97% of the county’s total. A simulated trend for the top 10 compounds was generated according to the curve shown in Fig. 1. Then the curve was smoothed to highlight the general trend. A three-term average is the general way for this purpose. After smoothing, the total amount of all compounds (TAU) can be computed as
 , ,
|
(12) |
where TAUi is the use amount of the ith compound. Since the total weight is 100, the weight for each unit (WRQ) can be calculated as
| WRQ=100/TAU. | (13) |
Finally, the quantity weight for the ith compound can be estimated as:
| WQi=WRQ×TAUi. | (14) |
Fig. 2 plots the quantity weight from top to bottom for the compounds. As can be seen, the top compound (sulfur, a fungicide) has a quantity weight of 6.47, which changes gradually to 3.46 for the 10th top compound (oryzalin, a herbicide), and 1.49 for the 20th top compound (norflurazon, a herbicide).
Fig. 2.

Quantity weight (W Q) of each compound for the pesticide use index computation
The orders of the chemicals show the ranks of the pesticides according to the amount of use. Names of the chemicals for the corresponding orders are given in Table A1
2.4. Toxicity weight determination
The toxicity weight needs to be determined according to the toxicity of each compound. However, a complication arises when the target of toxicity is considered, i.e., what organism does the toxicity apply to? As a matter of fact, different life species have different tolerances for different compounds. For the study in Madera County, the website www.pesticideinfo.org was used and the pesticide compound dictionary (Meister et al., 2001) was referenced for the evaluation of pesticide toxicity. The website is a national pesticide information website that contains a database for all available compounds. The database has several items related to toxicity, of which two are very important for the study: pesticide action network (PAN) bad actor chemicals and acute toxicity. The former denotes the chemicals that are either one or more of the following: highly acute toxicant, cholinesterase inhibitor, known/probable carcinogen, known ground-water pollutant or known reproductive or developmental toxicant. Because there are no authoritative lists of endocrine disrupting (ED) chemicals, EDs were not yet considered. And the latter describes the EPA toxicity criteria of the chemicals according to the rat median lethal dose (LD50), which classified the chemical toxicity levels into high, moderate, slight, and no acute toxicities. The column of toxicity rank in Table 2 was the evaluation for the toxicity weight in the study, with six for very high toxicity, and one for low toxicity. Table 3 shows the determination of the toxicity rank given in Table 2.
Table 2.
Toxicity and chemical types of the top 40 pesticides
| Order | Chemical code | Name of chemical | PAN bad actor chemical | Acute toxicity | Toxicity rank* | Use type |
| 1 | 560 | Sulfur | Not listed | Slight | 2 | F |
| 2 | 173 | Cryolite | Not listed | Slight | 2 | I |
| 3 | 2273 | Sodium tetrathiocarbonate | Not listed | NA | 1 | Fu |
| 4 | 1855 | Glyphosate, isopropylamine salt | Not listed | NA | 1 | H |
| 5 | 151 | Copper hydroxide | Not listed | Slight | 2 | F |
| 6 | 445 | Propargite | Highly toxic | High | 6 | I |
| 7 | 531 | Simazine | Highly toxic | Slight | 3 | H |
| 8 | 1601 | Paraquat dichloride | Highly toxic | High | 6 | H |
| 9 | 358 | Lime-sulfur | Not listed | NA | 1 | I |
| 10 | 1868 | Oryzalin | Not listed | Slight | 2 | H |
| 11 | 748 | Alkylaryl polyoxyethylene glycol | Not listed | NA | 1 | A |
| 12 | 1973 | Oxyfluorfen | Not listed | Slight | 2 | H |
| 13 | 629 | Ziram | Highly toxic | Moderate | 5 | F |
| 14 | 714 | Copper | Not listed | NA | 1 | F |
| 15 | 99 | Calcium hydroxide | Not listed | Slight | 2 | A |
| 16 | 765 | Petroleum oil, unclassified | Not listed | NA | 1 | I |
| 17 | 231 | Diuron | Highly toxic | Slight | 3 | H |
| 18 | 1314 | Poly-i-para-menthene | Not listed | NA | 1 | PGR |
| 19 | 158 | Copper oxychloride sulfate | Not listed | Slight | 2 | F |
| 20 | 2019 | Norflurazon | Highly toxic | Slight | 3 | H |
| 21 | 1728 | Napropamide | Not listed | Slight | 2 | H |
| 22 | 211 | Mancozeb | Highly toxic | Not acute toxic | 3 | F |
| 23 | 1857 | Fenamiphos | Highly toxic | High | 6 | I |
| 24 | 2327 | Glyphosate-trimesium | Not listed | NA | 1 | H |
| 25 | 763 | Petroleum distillates | Not listed | NA | 1 | I |
| 26 | 616 | Metam-sodium | Highly toxic | NA | 3 | Fu |
| 27 | 1159 | Modified phthalic glycerol alkyd resin | Not listed | NA | 1 | A |
| 28 | 597 | Trifluralin | Not listed | Slight | 2 | H |
| 29 | 3519 | Methyl soyate | Not listed | NA | 1 | A |
| 30 | 3957 | Tebufenozide | Not listed | Slight | 2 | I |
| 31 | 2245 | Myclobutanil | Highly toxic | Slight | 3 | F |
| 32 | 1552 | Benomyl | Highly toxic | Slight | 3 | F |
| 33 | 1743 | Nonylphenoxy poly(ethyleneoxy) ethanol | Not listed | Slight | 2 | F |
| 34 | 2081 | Iprodione | Not listed | NA | 1 | A |
| 35 | 3850 | Tebuconazole | Not listed | NA | 1 | A |
| 36 | 2337 | Encapsulated δ-endotoxin of Bacillusthuringiensis var. kurstaki in killed pseudomonas fluorescens | Not listed | Slight | 2 | I |
| 37 | 806 | 2,4-D, dimethylamine salt | Highly toxic | High | 6 | H |
| 38 | 342 | Isopropyl alcohol | Not listed | Slight | 2 | M |
| 39 | 346 | Dicofol | Highly toxic | High | 6 | I |
| 40 | 335 | Phosmet | Highly toxic | Moderate | 5 | I |
NA: no available weight-of-the-evidence summary assessment; F: fungicide; I: insecticide; Fu: fumigant; H: herbicide; PGR: plant growth regulator; A: adjuvant; M: microbiocide
Determination of the toxicity rank shown in Table 3
Table 3.
Determination of toxicity rank
| Toxicity rank | PAN bad actor chemical | Acute toxicity |
| 6 | Highly toxic | High |
| 5 | Highly toxic | Moderate |
| 4 | Not listed | Moderate |
| 3 | Highly toxic | Slight or NA |
| 2 | Not listed | Slight |
| 1 | Not listed | NA |
NA: no available weight-of-the-evidence summary assessment
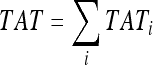
Then the total toxicity value (TAT) for all compounds can be computed as
 , ,
|
(15) |
where TATi is the toxicity rank of the ith compound. Since total toxicity weight is 100, the weight for each unit of toxicity (WRT) can be calculated as
| WRT=100/TAT. | (16) |
Therefore, the toxicity weight for the ith compound (W Ti) can be calculated as
| WTi=WRT×TATi. | (17) |
Fig. 3 plots the toxicity weights for the pesticide compounds used for winegrape production in Madera County. In Fig. 3, it can be seen that there are six toxicity levels for the compounds. The highest toxicity weight is about 1.5 and the lowest about 0.25.
Fig. 3.

Toxicity weight (W T) of each pesticide compound used for winegrape farming in Madera County, California
The orders of the chemicals show the ranks of the pesticides according to the amount of use. Names of the chemicals for the corresponding orders are given in Table A1
2.5. Pesticide chemical types
According to the application purposes, pesticides used for winegrape farming in the county can be categorized into four types: fungicide, insecticide, herbicide, and others. Here the others include plant growth regulators such as gibberellins, adjuvants such as trifloxystrobin, and microbiocides. In order to distinguish the relative importance of each compound in formulating the impacts on environment, evaluation of each of the four types needs to be conducted. Thus, according to pesticide types, the total PUI can be decomposed into four components for analyzing the contribution of each chemical type to the PUI:
| PUIj=PUIFj+PUIIj+PUIHj+PUIOj, | (18) |
where PUIFj is the fungicide PUI of the jth grower. PUIIj, PUIHj, and PUIOj are the PUIs of insecticide, herbicide, and other chemicals, respectively.
Since the aim of the study is to identify low pesticide users at grower level, a stable PUI is needed for the identification. For this, the PUI needs to be calculated for at least three years. Due to the availability, data from the years of 1999 to 2001 were used for the calculation. The average PUI for the three years was used as an indicator of low pesticide users.
2.6. Data source and analysis procedure
The data source of the pesticide compounds used in the study is from California PUR database (CDPR, 2000; 2001), which possesses the complete pesticide application records at the field level for all of California. For the study, the available data were from 1990 to 2001, which are sufficient to test the applicability of the proposed approach. For each year over 2.5 million records of the pesticide applications were recorded in the PUR database, which was integrated into geographic information system (GIS) software ArcView GIS as an extension of PUR-GIS Application. At the same time, the database was anchored on the Oracle 8i SQL for fast data query. Therefore, both the PUR-GIS Application and the Oracle 8i SQL were used as tools for data mining.
The above analysis involved the following working procedures:
Using ArcView PUR-GIS Application to obtain data of pesticides used for winegrape farming in Madera County for the years of 1999–2001. Several summary outputs can be created by the PUR-GIS Application. Among the outputs, the field summary and chemical summary reports were used for the study because the two reports informed on how many fields were there in each year and how many pesticides were used for winegrape farming. The two summary outputs were exported into a dbf file for further analysis.
Using an Oracle SQL code to obtain pesticide use data at field level from the PUR database. Since each pesticide had an output file, totally 160 files were obtained from the SQL query.
Using a C++ program to join the SQL output files. The SQL output files from Step 2 only contained the data for the fields with the pesticide use. In order to have a convenient way of analysis, the files for all the fields were joined.
Importing the joint files into an EXCEL sheet to show the pesticide use for all the fields.
Computing grower pesticide use from the EXCEL sheet. Some growers had several fields while others only have one field.
Computing the quantity and toxicity weights for each compound.
Normalizing the pesticide use intensity (kg/ha) for the growers.
Computing the PUI for quantity and toxicity, and for each pesticide type.
Scaling the quantity and toxicity PUIs.
Computing the integrated PUI to evaluate growers’ pesticide use levels.
3. Results and discussion
3.1. Pesticide use intensities of the growers
Winegrape farming in Madera is diverse. Totally there were 733 fields of winegrape in the county in year 2000 and the fields were distributed among 208 growers. Some growers had more than one field while others had only one. For example, grower identification (ID) 2090264 had 16 fields growing winegrape with 872.51 ha, while grower ID 2402258 only has one field with 64.75 ha. The grower with the largest acreage of vineyard was grower ID 3904325, who had 1 779.41 ha of vineyard. The size of the field was also significantly different, with maximum of 259 ha owned by grower ID 2090312 who had only one field.
Fig. 4 shows the PUIs of the growers in an ascending direction. Among the 208 growers, the PUIs of 62 growers (accounting for 29.81%) were ≤20 in 2000. These growers could be termed as low pesticide users. The percentages of the low pesticide users with PUI≤20 in 2001 and 1999 were 27.96% and 15.10%, respectively. On the other hand, the high pesticide users were those growers who had a high PUI, for example, PUI>60. As shown in Table 4, the PUIs of 8 growers were higher than 80 in 2000, accounting for 3.84% of the total. The percentages in 2001 and 1999 were 9.48% and 21.23%, respectively. Another feature shown in Table 4 was that the number of the high pesticide users tended to decrease in the period under study. In 1999 there were 82 growers with PUI>60. The number decreased to 19 growers in 2000 and 38 growers in 2001. As contrast, the number of the low pesticide users was increasing. In 1999, there were 61 growers with PUI≤30 (Table 4). The number increased to 107 in 2000 and 99 in 2001, respectively. This indicates that reduction of pesticide use intensity has been extensively emphasized in winegrape farming in the recent decade.
Fig. 4.

Pesticide use indices for the growers of winegrape farming in Madera County, California in 2000
Orders of the growers are given according their PUI values
Table 4.
Number of growers in each PUI group
| PUI group | Number of growers |
Percentage of the total |
||||
| 1999 | 2000 | 2001 | 1999 | 2000 | 2001 | |
| ≤10 | 15 | 28 | 21 | 7.08 | 13.46 | 9.95 |
| 10–20 | 17 | 34 | 38 | 8.02 | 16.35 | 18.01 |
| 20–30 | 29 | 45 | 40 | 13.68 | 21.63 | 18.96 |
| 30–40 | 20 | 38 | 25 | 9.43 | 18.27 | 11.85 |
| 40–50 | 25 | 25 | 32 | 11.79 | 12.02 | 15.17 |
| 50–60 | 24 | 19 | 17 | 11.32 | 9.13 | 8.06 |
| 60–80 | 37 | 11 | 18 | 17.45 | 5.29 | 8.53 |
| 80–100 | 21 | 5 | 7 | 9.91 | 2.40 | 3.32 |
| >100 | 24 | 3 | 13 | 11.32 | 1.44 | 6.16 |
| Total | 212 | 208 | 211 | 100.00 | 100.00 | 100.00 |
3.2. Acreage and field number of each PUI group
Statistical analysis on the growers in each PUI group is given in Table 5 for acreage and Table 6 for number of fields. Though winegrape is a perennial crop, growers needed to remove some aged and less productive fields each year. Meanwhile, each year there were newly planted fields in order to keep winegrape farming and vinery industry sustainable. This situation made both the acreage and field number of winegrape dynamic. Under the three study years, the largest winegrape acreage occurred in 2000, at 24 017.12 ha (Table 5), but the largest field number was in 2001, with 738 fields (Table 6). The average acreage per field was 33.12, 32.72, and 32.24 ha in the three consecutive years. Table 5 indicates that the winegrape acreage owned by low pesticide users (PUI≤20) was steadily increased, being 1 625.38, 2 328.71, and 2 753.69 ha in 1999, 2000, and 2001, accounting for 6.91%, 9.70%, and 11.57% respectively. In contrast, the acreage owned by very high pesticide users (PUI>80) accounted for 40.73%, 9.75%, and 22.99% in the three years, respectively, showing a declining tendency.
Table 5.
Hectares planted of the growers in each PUI group
| PUI group | Hectares planted of the growers |
Percentage of the total |
||||
| 1999 | 2000 | 2001 | 1999 | 2000 | 2001 | |
| ≤10 | 1 290.02 | 622.40 | 731.15 | 5.49 | 2.59 | 3.07 |
| 10–20 | 335.36 | 1 706.31 | 2 022.54 | 1.43 | 7.10 | 8.50 |
| 20–30 | 1 466.22 | 4 661.23 | 6 113.66 | 6.24 | 19.41 | 25.69 |
| 30–40 | 3 828.78 | 4 536.57 | 2 626.02 | 16.28 | 18.89 | 11.04 |
| 40–50 | 1 803.29 | 3 683.58 | 3 091.18 | 7.67 | 15.34 | 12.99 |
| 50–60 | 1 390.95 | 4 531.89 | 1 696.16 | 5.92 | 18.87 | 7.13 |
| 60–80 | 3 820.65 | 1 935.78 | 2 043.35 | 16.25 | 8.06 | 8.59 |
| 80–100 | 2 828.76 | 1 005.18 | 709.01 | 12.03 | 4.19 | 2.98 |
| >100 | 6 749.12 | 1 334.18 | 4 762.69 | 28.70 | 5.56 | 20.01 |
| Total | 23 513.16 | 24 017.12 | 23 795.76 | 100.00 | 100.00 | 100.00 |
Table 6.
Field numbers of the growers in each PUI group
| PUI group | Field number of the grower |
Percentage of the total |
||||
| 1999 | 2000 | 2001 | 1999 | 2000 | 2001 | |
| ≤10 | 47 | 36 | 31 | 6.62 | 4.90 | 4.20 |
| 10–20 | 22 | 52 | 90 | 3.10 | 7.08 | 12.20 |
| 20–30 | 46 | 135 | 157 | 6.48 | 18.39 | 21.27 |
| 30–40 | 60 | 121 | 72 | 8.45 | 16.49 | 9.76 |
| 40–50 | 47 | 94 | 119 | 6.62 | 12.81 | 16.12 |
| 50–60 | 50 | 128 | 53 | 7.04 | 17.44 | 7.18 |
| 60–80 | 122 | 89 | 49 | 17.18 | 12.13 | 6.64 |
| 80–100 | 88 | 41 | 32 | 12.39 | 5.59 | 4.34 |
| >100 | 228 | 38 | 135 | 32.11 | 5.18 | 18.29 |
| Total | 710 | 734 | 738 | 100.00 | 100.00 | 100.00 |
Analysis on field numbers (Table 6) reveals that in 1999 nearly three forths of the fields were in the hands of high pesticide users. However, the percentages of fields owned or managed by low and moderate pesticide users showed a trend of gradual increase in the following two years, implying that more and more growers started to reduce pesticide use in their winegrape farming.
3.3. PUI components of low pesticide users
Analysis on PUI components is very important for identifying the pesticide use behaviors of the growers. Table 7 shows the PUI components of the low pesticide users (PUI≤20) in 2000. There were 62 growers in this group, of which 28 growers were the extremely low pesticide users, with PUI≤10, and 34 were slightly low pesticide users (10<PUI≤20). Table 7 indicates: (1) both PUIQ and PUIT of these growers were very low, indicating that the growers might have adopted a strategy of low amount and low toxicity of pesticide use in their winegrape farming; (2) the fact of PUIQ higher than PUIT implies that the growers emphasized more quantity than toxicity in selecting pesticides; and (3) most of the growers used only fungicide in their fields, a few growers used very little insecticide and herbicide, which indicates that low pesticide users might have adopted a better farm management strategy to control insects and weeds while still struggling with fungi in their vineyards.
Table 7.
Pesticide use indices of the low pesticide users in Madera County in 2000
| Order | Grower ID | PUI | PUIQ | PUIT | PUIF | PUII | PUIH | Hectares | nfield | nchem |
| 1 | 2098790@* | 0.36 | 0.19 | 0.17 | 0.36 | 0.00 | 0.00 | 0.61 | 1 | 1 |
| 2 | 2090355@* | 1.11 | 0.51 | 0.60 | 0.30 | 0.81 | 0.00 | 8.09 | 1 | 2 |
| 3 | 2090331* | 1.15 | 0.51 | 0.64 | 0.16 | 0.23 | 0.28 | 30.76 | 1 | 4 |
| 4 | 2096325@* | 1.32 | 1.07 | 0.25 | 1.32 | 0.00 | 0.00 | 120.39 | 2 | 2 |
| 5 | 2090003 | 1.79 | 1.69 | 0.10 | 1.79 | 0.00 | 0.00 | 57.47 | 3 | 1 |
| 6 | 2090272* | 2.76 | 2.60 | 0.16 | 2.76 | 0 | 0 | 4.45 | 1 | 1 |
| 7 | 2090704 | 3.03 | 2.88 | 0.15 | 1.82 | 0.00 | 1.21 | 7.28 | 2 | 2 |
| 8 | 2090752 | 3.04 | 1.78 | 1.26 | 1.91 | 0.00 | 0.00 | 22.26 | 1 | 5 |
| 9 | 2090806 | 3.07 | 2.90 | 0.18 | 3.07 | 0.00 | 0.00 | 30.35 | 1 | 1 |
| 10 | 2090104 | 4.16 | 3.92 | 0.24 | 4.16 | 0.00 | 0.00 | 16.19 | 1 | 1 |
| 11 | 2091273* | 4.85 | 4.57 | 0.28 | 4.85 | 0.00 | 0.00 | 4.45 | 1 | 1 |
| 12 | 2090831 | 4.95 | 2.96 | 1.99 | 0.00 | 0.00 | 3.35 | 2.02 | 1 | 9 |
| 13 | 2090289 | 5.02 | 4.56 | 0.46 | 1.97 | 0.29 | 2.76 | 18.21 | 2 | 4 |
| 14 | 2090066* | 5.10 | 4.09 | 1.01 | 0.00 | 5.10 | 0.00 | 46.54 | 1 | 1 |
| 15 | 2090431* | 5.15 | 4.35 | 0.81 | 4.61 | 0.00 | 0.00 | 10.12 | 1 | 2 |
| 16 | 2090500 | 5.52 | 3.31 | 2.21 | 2.09 | 0.81 | 1.92 | 16.19 | 1 | 7 |
| 17 | 2091013@ | 5.59 | 4.44 | 1.15 | 1.16 | 0.00 | 4.03 | 20.23 | 1 | 6 |
| 18 | 2090278 | 6.65 | 2.86 | 3.78 | 1.51 | 4.70 | 0.00 | 22.66 | 2 | 11 |
| 19 | 2090994 | 6.73 | 5.73 | 1.00 | 6.73 | 0.00 | 0.00 | 4.05 | 1 | 3 |
| 20 | 2091304@ | 6.98 | 6.02 | 0.96 | 0.42 | 0.00 | 3.31 | 18.21 | 1 | 4 |
| 21 | 2091234@ | 7.33 | 6.91 | 0.42 | 7.33 | 0.00 | 0.00 | 24.28 | 1 | 1 |
| 22 | 2090363@ | 7.62 | 6.86 | 0.75 | 7.62 | 0.00 | 0.00 | 6.47 | 1 | 3 |
| 23 | 2090255 | 7.76 | 7.31 | 0.45 | 7.76 | 0.00 | 0.00 | 30.76 | 1 | 1 |
| 24 | 2090539 | 8.52 | 8.03 | 0.49 | 8.52 | 0.00 | 0.00 | 21.04 | 2 | 1 |
| 25 | 2090394 | 8.58 | 7.51 | 1.07 | 2.31 | 0.00 | 6.28 | 29.14 | 2 | 4 |
| 26 | 2090769* | 9.40 | 8.54 | 0.87 | 9.40 | 0.00 | 0.00 | 16.19 | 1 | 3 |
| 27 | 2090447 | 9.76 | 7.31 | 2.45 | 7.50 | 0.00 | 0.00 | 14.97 | 1 | 8 |
| 28 | 2091811@ | 9.90 | 7.90 | 2.00 | 0.00 | 8.80 | 0.00 | 19.02 | 1 | 3 |
| 29 | 2090531 | 10.01 | 6.99 | 3.02 | 6.07 | 1.01 | 0.00 | 12.95 | 1 | 7 |
| 30 | 2090732* | 10.49 | 6.39 | 4.11 | 10.49 | 0.00 | 0.00 | 15.38 | 1 | 2 |
| 31 | 2091701 | 10.5 | 9.71 | 0.79 | 1.16 | 0.00 | 9.34 | 8.09 | 1 | 3 |
| 32 | 2090483* | 10.85 | 10.30 | 0.55 | 0.00 | 0.00 | 10.85 | 17.08 | 1 | 2 |
| 33 | 2090497 | 10.92 | 10.29 | 0.63 | 10.92 | 0.00 | 0.00 | 8.09 | 1 | 1 |
| 34 | 2405610 | 11.87 | 8.86 | 3.01 | 3.02 | 1.61 | 4.36 | 247.26 | 3 | 8 |
| 35 | 2090682 | 12.25 | 10.95 | 1.30 | 7.14 | 1.79 | 3.32 | 16.19 | 1 | 3 |
| 36 | 2090618 | 12.31 | 10.56 | 1.76 | 3.15 | 9.16 | 0.00 | 2.83 | 1 | 4 |
| 37 | 2090760 | 12.43 | 11.81 | 0.62 | 8.07 | 0.00 | 4.36 | 40.47 | 1 | 2 |
| 38 | 2090138 | 12.54 | 10.98 | 1.56 | 2.74 | 0.09 | 8.18 | 242.81 | 5 | 16 |
| 39 | 2090059 | 12.56 | 10.29 | 2.27 | 8.79 | 3.48 | 0.00 | 126.26 | 4 | 5 |
| 40 | 2090779@ | 12.67 | 11.99 | 0.69 | 10.78 | 0.00 | 1.89 | 80.13 | 1 | 2 |
| 41 | 2090686 | 12.84 | 11.55 | 1.28 | 10.74 | 0.00 | 2.10 | 18.01 | 3 | 4 |
| 42 | 2090099 | 13.55 | 11.68 | 1.87 | 0.00 | 0.00 | 13.4 | 16.19 | 1 | 5 |
| 43 | 2090509 | 13.76 | 11.79 | 1.97 | 11.89 | 1.70 | 0.00 | 15.38 | 1 | 3 |
| 44 | 2090956 | 14.41 | 12.66 | 1.75 | 3.64 | 0.00 | 10.43 | 15.38 | 1 | 5 |
| 45 | 2090584 | 14.56 | 11.06 | 3.51 | 10.80 | 0.28 | 2.55 | 62.04 | 2 | 5 |
| 46 | 2090186 | 14.96 | 14.24 | 0.72 | 8.71 | 0.00 | 6.25 | 4.45 | 2 | 2 |
| 47 | 2090885 | 15.00 | 13.58 | 1.42 | 10.83 | 0.51 | 0.00 | 8.09 | 1 | 4 |
| 48 | 2090380 | 15.17 | 12.28 | 2.89 | 7.12 | 3.13 | 3.54 | 16.19 | 1 | 11 |
| 49 | 2090891@ | 15.28 | 14.1 | 1.18 | 9.87 | 0.00 | 5.42 | 18.62 | 1 | 3 |
| 50 | 2090408 | 15.35 | 11.49 | 3.85 | 10.20 | 0.98 | 3.38 | 4.17 | 1 | 8 |
| 51 | 2090429* | 15.59 | 14.80 | 0.79 | 10.92 | 0.00 | 4.67 | 16.19 | 1 | 2 |
| 52 | 2090788@ | 15.91 | 14.49 | 1.42 | 14.48 | 0.47 | 0.95 | 60.70 | 2 | 3 |
| 53 | 2090139 | 15.96 | 12.49 | 3.47 | 3.84 | 0.24 | 9.08 | 137.59 | 4 | 10 |
| 54 | 2090105 | 16.27 | 14.32 | 1.95 | 3.11 | 0.00 | 12.12 | 40.47 | 1 | 13 |
| 55 | 2090251 | 16.60 | 13.94 | 2.66 | 3.64 | 0.92 | 11.59 | 121.41 | 1 | 5 |
| 56 | 2090227* | 17.01 | 15.66 | 1.35 | 5.50 | 0 | 11.11 | 55.08 | 1 | 6 |
| 57 | 2091038 | 17.81 | 15.38 | 2.43 | 7.70 | 0.00 | 9.60 | 13.76 | 1 | 7 |
| 58 | 2090352 | 18.42 | 15.99 | 2.43 | 6.64 | 0.84 | 8.84 | 7.28 | 1 | 8 |
| 59 | 1070383@ | 18.72 | 14.81 | 3.91 | 5.59 | 0.00 | 13.13 | 56.66 | 1 | 5 |
| 60 | 2090324 | 18.82 | 16.78 | 2.04 | 8.15 | 7.33 | 3.35 | 89.84 | 2 | 4 |
| 61 | 1010090 | 19.58 | 17.71 | 1.87 | 18.10 | 0.00 | 0.00 | 62.73 | 1 | 5 |
| 62 | 2090306 | 19.90 | 14.17 | 5.73 | 2.77 | 0.00 | 11.74 | 48.56 | 1 | 9 |
n field: field number; n chem: chemical number
New growers
Disappeared growers
Statistical analyses on field acreage, field number, and pesticide number reveal that most of the low pesticide users only owned one field with small acreage and used only 1–3 compounds. Only 6 of the 62 growers’ vineyards were larger than 100 ha, 8 growers’ vineyards were between 50 and 100 ha, and the rest (48 growers’ vineyards) were less than 50 ha (Table 7). As for field number, only 6 of the 62 growers owned no less than 3 fields (no one owned more than 5 fields) and 10 owned 2 fields. Probably because of few fields and small acreage, it was easier for the growers to practice good on-farm management and reduce insecticide and herbicide use. However, most of them used fungicide, which indicated that fungi were more difficult to control without the aid of pesticides. There were two growers (grower IDs 2090831 and 2091811) who did not use fungicide in 2000. As a matter of fact, new growers who started winegrape farming and the growers who would change their vineyards into other crops in the following year might not use pesticides. In order to examine this possibility, the 62 growers were tracked for the three consecutive years. It was found that overall there were 12 new growers and 13 growers stopped winegrape farming in the following year. Therefore, the majority of the low pesticide users stayed in the winegrape farming sector, and their behaviors of using less pesticide might indicate that good on-farm management helped them to minimize the dependence of pesticide. Thus, these low pesticide users could serve as candidates for further investigation to identify the models for extension of low pesticide use.
3.4. PUI components of high pesticide users
The PUI components of high pesticide users are shown in Table 8, which gives a very different picture of pesticide use among the growers. These high pesticide users heavily depended on not only fungicide, but also insecticide, herbicide, and other chemicals. Though quantity still contributed more than toxicity to PUI, the percentage of toxicity index in PUI was obviously higher than that in Table 7. It means that high quantity was accompanied with high toxicity in the growers’ behaviors of pesticide use. In other words, these growers used not only large quantities of pesticides, but also highly toxic pesticides in their winegrape farming.
Table 8.
Pesticide use indices of the high pesticide users in Madera County in 2000
| Order | Grower ID | PUI | PUIQ | PUIT | PUIF | PUII | PUIH | Hectares | nfield | nchem |
| 1 | 2090307 | 50.22 | 39.54 | 10.68 | 14.67 | 14.58 | 8.13 | 16.19 | 2 | 14 |
| 2 | 1040595 | 50.98 | 41.76 | 9.22 | 15.99 | 11.87 | 14.26 | 64.75 | 2 | 17 |
| 3 | 1070404 | 52.35 | 42.71 | 9.65 | 4.54 | 7.22 | 40.59 | 17.81 | 3 | 6 |
| 4 | 2091202 | 52.36 | 42.62 | 9.74 | 14.83 | 9.13 | 19.61 | 974.08 | 13 | 23 |
| 5 | 2090436 | 53.00 | 47.28 | 5.72 | 22.48 | 7.63 | 17.38 | 16.19 | 1 | 11 |
| 6 | 2090334 | 53.54 | 42.79 | 10.75 | 16.39 | 16.71 | 19.37 | 135.97 | 3 | 12 |
| 7 | 2090249 | 53.58 | 48.62 | 4.95 | 36.84 | 0.26 | 14.76 | 93.89 | 4 | 8 |
| 8 | 2090020 | 54.34 | 47.33 | 7.01 | 14.56 | 10.03 | 21.60 | 152.57 | 6 | 19 |
| 9 | 2090062 | 54.58 | 40.15 | 14.42 | 10.12 | 22.29 | 20.52 | 326.18 | 11 | 22 |
| 10 | 2090060 | 55.19 | 47.02 | 8.17 | 19.74 | 15.55 | 16.51 | 743.21 | 21 | 27 |
| 11 | 2090819 | 55.45 | 41.81 | 13.64 | 16.88 | 16.81 | 20.78 | 20.64 | 4 | 13 |
| 12 | 2090096 | 55.92 | 46.13 | 9.79 | 16.78 | 22.74 | 15.64 | 411.16 | 10 | 18 |
| 13 | 2090282 | 56.72 | 51.29 | 5.43 | 30.69 | 2.59 | 21.60 | 22.26 | 1 | 9 |
| 14 | 2090600 | 56.80 | 46.38 | 10.43 | 38.80 | 16.41 | 0.00 | 287.33 | 3 | 9 |
| 15 | 2402258 | 57.13 | 48.42 | 8.71 | 16.33 | 17.32 | 20.77 | 64.75 | 1 | 17 |
| 16 | 2090264 | 57.75 | 49.70 | 8.05 | 20.57 | 4.03 | 20.55 | 872.51 | 17 | 18 |
| 17 | 2090424 | 59.38 | 45.68 | 13.70 | 17.77 | 18.08 | 20.94 | 58.68 | 3 | 16 |
| 18 | 2090218 | 59.41 | 49.36 | 10.05 | 16.07 | 9.02 | 30.23 | 13.76 | 3 | 15 |
| 19 | 2090398 | 59.59 | 51.03 | 8.56 | 5.14 | 10.70 | 26.09 | 239.98 | 20 | 14 |
| 20 | 1082220 | 60.17 | 48.17 | 12.00 | 15.57 | 16.11 | 18.66 | 281.66 | 9 | 23 |
| 21 | 2091217 | 60.33 | 45.53 | 14.81 | 34.52 | 14.24 | 8.78 | 35.61 | 1 | 18 |
| 22 | 2090017 | 62.78 | 47.72 | 15.07 | 21.95 | 30.08 | 7.12 | 151.76 | 8 | 17 |
| 23 | 2080421 | 62.85 | 51.66 | 11.19 | 20.21 | 5.89 | 27.94 | 157.83 | 6 | 16 |
| 24 | 2001362 | 64.88 | 56.20 | 8.68 | 12.72 | 20.25 | 22.49 | 266.45 | 6 | 18 |
| 25 | 2090115 | 64.93 | 54.55 | 10.38 | 25.69 | 0.58 | 36.63 | 186.16 | 18 | 19 |
| 26 | 2090270 | 64.93 | 56.24 | 8.69 | 8.39 | 10.06 | 31.55 | 46.54 | 2 | 12 |
| 27 | 2090333 | 65.69 | 53.10 | 12.59 | 14.10 | 19.34 | 31.25 | 118.57 | 5 | 16 |
| 28 | 2090109 | 76.85 | 66.04 | 10.80 | 8.46 | 2.66 | 64.57 | 16.19 | 1 | 14 |
| 29 | 2090503 | 77.42 | 55.07 | 22.34 | 17.61 | 16.97 | 37.12 | 541.47 | 31 | 16 |
| 30 | 2090277 | 77.49 | 63.81 | 13.68 | 24.08 | 7.63 | 38.79 | 133.55 | 2 | 16 |
| 31 | 1020037 | 81.59 | 69.60 | 11.99 | 36.86 | 11.43 | 23.45 | 487.41 | 15 | 17 |
| 32 | 2090133 | 83.18 | 67.40 | 15.78 | 22.06 | 14.17 | 35.15 | 11.33 | 3 | 23 |
| 33 | 2090132 | 88.65 | 68.72 | 19.93 | 45.75 | 20.36 | 18.75 | 145.08 | 12 | 12 |
| 34 | 2090871 | 95.30 | 76.50 | 18.80 | 21.78 | 12.96 | 49.71 | 82.15 | 4 | 28 |
| 35 | 2090131 | 96.78 | 75.34 | 21.45 | 21.42 | 13.95 | 48.24 | 279.23 | 7 | 35 |
| 36 | 1060326 | 111.51 | 96.70 | 14.80 | 18.05 | 33.39 | 33.50 | 330.43 | 17 | 15 |
| 37 | 2090070 | 119.16 | 99.99 | 19.17 | 8.82 | 21.70 | 70.74 | 928.47 | 19 | 24 |
| 38 | 2090802 | 142.15 | 42.51 | 99.64 | 30.00 | 100.95 | 4.73 | 75.27 | 2 | 23 |
n field: field number; n chem: chemical number
Table 8 also reveals that the high pesticide users were generally those big winegrape growers with large acreages and more fields. There were 38 growers with PUI>50 in 2000. Five of them had winegrape acreage more than 500 ha and another seventeen between 100 and 500 ha. Twelve growers owned more than 10 fields. In contrast to the low pesticide users, these high pesticide users usually applied more than 10 pesticides in their fields, and the pesticides that they applied covered all types, i.e., fungicide, insecticide, herbicide, and others (Table 8).
The identification of these high pesticide users is very helpful, because extension specialists can focus their efforts on these growers in order to increase the efficiency of pesticide use and reduce pesticide environmental risk. In this case, both reduction of application amount and emphasis on using low toxicity pesticides are alternative strategies for the high pesticide users.
3.5. Relationship between toxicity index and quantity index
Examination of the relationship between the toxicity index and quantity index is useful for analyzing pesticide application patterns among the winegrape growers in Madera County. Fig. 5 shows the relationship for the integrated PUI, fungicide index, insecticide index, and herbicide index.
Fig. 5.

Relationship between quantity index and toxicity index for all the growers of winegrape farming in Madera County in 2000
(a) Integrated PUI; (b) Fungicide index; (c) Insecticide index; (d) Herbicide index
Fig. 5a shows two opposite behavior patterns of low and high pesticide users. Using small quantity and low toxic pesticides is the behavior pattern of low pesticide users while using large quantity and high toxic pesticides is the pattern of high pesticide users. It hints that some growers had found efficient ways to control pests in their vineyards by using less pesticides and applying low toxic compounds, while other growers still heavily depended on pesticides in their winegrape farming.
Fig. 5b shows the relationship between quantity and toxicity of fungicide, which is very similar to Fig. 5a. It can be seen that fungicides were usually used in large quantity and many fungicides were highly toxic. Fig. 5c shows a different relation between quantity and toxicity for insecticides, because most growers chose either large quantity or high toxicity, but not both. In other words, while growers used insecticides in their vineyards, a large quantity was usually accompanied with low toxicity, and vise versa. The close relationship between quantity and toxicity of herbicide is shown in Fig. 5d, which is quite similar with Figs. 5a and 5b. This is probably attributed to the fact that weed is also a difficult problem in winegrape farming, especially for large growers in the county.
3.6. Comparison of two methods for pesticide use index
Comparison of the two methods (additive and multiplied forms) in constructing the pesticide use index is very important to verify the applicability of the proposed approach. Fig. 6 and Table 9 give the comparison of PUI and PUIM. A very close relation between the PUI and PUIM can be seen in Fig. 6, indicating that PUI and PUIM are almost the same, and both can reflect the pesticide use levels of winegrape growers. Since the compositions of both PUI and PUIM are the quantity index (PUIQ) and toxicity index (PUIT) of pesticide use, and both PUIQ and PUIT have the values between 0 and 100, thus PUI has a value between 0 and 200, while PUIM is between 0 and 10 000. Regression of PUIM to PUI gives the following equations:
| For PUI=0–60, PUIM=0.1283×PUI2.1562, R2=0.99; | (19) |
| For PUI=60–200, PUIM=0.1818×PUI2.0572, R2=0.99. | (20) |
Fig. 6.

Comparison of the pesticide use index in the additive (PUI) and the multiplicative (PUIM) methods
The dots are the original data of PUI and PUIM, while the line denotes the regression trend simulating the PUIM from the PUI using Eqs. (19) and (20)
Table 9.
Comparison of PUI and PUIM in identifying the low pesticide users in 2001
| Order | Rank according to PUI |
Order | Rank according to PUIM |
||||
| Grower ID | PUI | PUIM | Growers ID | PUI | PUIM | ||
| 1 | 2090450 | 1.51 | 0.39 | 1 | 2090788 | 1.79 | 0.30 |
| 2 | 2090788 | 1.79 | 0.30 | 2 | 2090450 | 1.51 | 0.39 |
| 3 | 1080751 | 3.57 | 1.98 | 3 | 2090305 | 3.70 | 1 |
| 4 | 2090305 | 3.70 | 1.00 | 4 | 2090465 | 6.28 | 1.29 |
| 5 | 2090284 | 4.70 | 3.13 | 5 | 1080751 | 3.57 | 1.98 |
| 6 | 2090054 | 5.28 | 4.04 | 6 | 2090284 | 4.70 | 3.13 |
| 7 | 2091013 | 5.67 | 7.79 | 7 | 2090054 | 5.28 | 4.04 |
| 8 | 2090500 | 5.88 | 4.46 | 8 | 2090500 | 5.88 | 4.46 |
| 9 | 2091234 | 6.04 | 6.19 | 9 | 2091234 | 6.04 | 6.19 |
| 10 | 2090465 | 6.28 | 1.29 | 10 | 2090394 | 6.63 | 6.42 |
| 11 | 2090394 | 6.63 | 6.42 | 11 | 2091013 | 5.67 | 7.79 |
| 12 | 2090824 | 7.21 | 12.97 | 12 | 1030724 | 7.25 | 8.91 |
| 13 | 1030724 | 7.25 | 8.91 | 13 | 2090373 | 7.25 | 8.91 |
| 14 | 2090373 | 7.25 | 8.91 | 14 | 2090539 | 7.37 | 9.22 |
| 15 | 2090539 | 7.37 | 9.22 | 15 | 2090601 | 7.58 | 10.19 |
| 16 | 2090601 | 7.58 | 10.19 | 16 | 2090720 | 8.92 | 12.94 |
| 17 | 2090113 | 8.51 | 17.03 | 17 | 2090824 | 7.21 | 12.97 |
| 18 | 2090720 | 8.92 | 12.94 | 18 | 2090186 | 9.66 | 13.46 |
| 19 | 2090531 | 9.61 | 19.38 | 19 | 2090709 | 9.64 | 15.75 |
| 20 | 2090709 | 9.64 | 15.75 | 20 | 2090113 | 8.51 | 17.03 |
| 21 | 2090186 | 9.66 | 13.46 | 21 | 2090531 | 9.61 | 19.38 |
| 22 | 2090255 | 10.49 | 27.26 | 22 | 2090447 | 17.42 | 20.79 |
| 23 | 2091765 | 10.85 | 29.45 | 23 | 2090497 | 11.33 | 21.75 |
| 24 | 2090497 | 11.33 | 21.75 | 24 | 2090408 | 11.73 | 23.32 |
| 25 | 2090278 | 11.61 | 33.64 | 25 | 2090994 | 15.05 | 24.68 |
| 26 | 2090408 | 11.73 | 23.32 | 26 | 2090306 | 12.08 | 24.74 |
| 27 | 2090437 | 11.77 | 34.44 | 27 | 2090845 | 19.20 | 25.83 |
| 28 | 2090059 | 11.96 | 35.47 | 28 | 2090255 | 10.49 | 27.26 |
| 29 | 2090306 | 12.08 | 24.74 | 29 | 2090456 | 12.99 | 28.08 |
| 30 | 2090686 | 12.55 | 38.71 | 30 | 2091765 | 10.85 | 29.45 |
| 31 | 2090456 | 12.99 | 28.08 | 31 | 2090278 | 11.61 | 33.64 |
| 32 | 2090822 | 13.44 | 34.46 | 32 | 2090538 | 14.55 | 34.1 |
| 33 | 2090956 | 13.72 | 44.64 | 33 | 2090437 | 11.77 | 34.44 |
| 34 | 2090926 | 14.21 | 50.10 | 34 | 2090822 | 13.44 | 34.46 |
| 35 | 2090155 | 14.34 | 37.84 | 35 | 2090059 | 11.96 | 35.47 |
| 36 | 2090538 | 14.55 | 34.10 | 36 | 2090155 | 14.34 | 37.84 |
| 37 | 2090994 | 15.05 | 24.68 | 37 | 2090686 | 12.55 | 38.71 |
| 38 | 2090665 | 15.07 | 54.68 | 38 | 2090385 | 15.79 | 42.98 |
| 39 | 2090359 | 15.08 | 56.77 | 39 | 2090956 | 13.72 | 44.64 |
| 40 | 2090138 | 15.28 | 51.97 | 40 | 2090926 | 14.21 | 50.10 |
| 41 | 2090084 | 15.39 | 51.78 | 41 | 2090084 | 15.39 | 51.78 |
| 42 | 2090398 | 15.60 | 59.33 | 42 | 2090138 | 15.28 | 51.97 |
| 43 | 2090385 | 15.79 | 42.98 | 43 | 2090104 | 18.27 | 53.14 |
| 44 | 2090256 | 16.25 | 61.26 | 44 | 2090665 | 15.07 | 54.68 |
| 45 | 2090937 | 16.36 | 61.16 | 45 | 2090359 | 15.08 | 56.77 |
| 46 | 2091038 | 16.50 | 67.48 | 46 | 2090124 | 17.90 | 58.07 |
| 47 | 2090811 | 16.85 | 70.89 | 47 | 2090831 | 18.22 | 58.63 |
| 48 | 2090891 | 16.94 | 71.07 | 48 | 2090398 | 15.60 | 59.33 |
| 49 | 2090516 | 17.01 | 71.17 | 49 | 2090937 | 16.36 | 61.16 |
| 50 | 2090447 | 17.42 | 20.79 | 50 | 2090256 | 16.25 | 61.26 |
| 51 | 2090663 | 17.69 | 71.27 | 51 | 2090988 | 19.29 | 63.10 |
| 52 | 2090124 | 17.90 | 58.07 | 52 | 2091038 | 16.50 | 67.48 |
| 53 | 2090091 | 17.97 | 75.74 | 53 | 2090811 | 16.85 | 70.89 |
| 54 | 2090831 | 18.22 | 58.63 | 54 | 2090891 | 16.94 | 71.07 |
| 55 | 2090104 | 18.27 | 53.14 | 55 | 2090516 | 17.01 | 71.17 |
| 56 | 2090716 | 18.59 | 86.21 | 56 | 2090663 | 17.69 | 71.27 |
| 57 | 2090845 | 19.20 | 25.83 | 57 | 2090091 | 17.97 | 75.74 |
| 58 | 2090988 | 19.29 | 63.10 | 58 | 2090716 | 18.59 | 86.21 |
| 59 | 1070178 | 19.92 | 96.29 | 59 | 2090251 | 20.82 | 86.61 |
| 60 | 2090535 | 22.62 | 87.64 | ||||
| 61 | 2090584 | 23.72 | 90.93 | ||||
| 62 | 1040595 | 20.53 | 95.77 | ||||
| 63 | 1070178 | 19.92 | 96.29 | ||||
| 64 | 2090289 | 27.37 | 97.51 | ||||
| 65 | 2091069 | 22.27 | 98.10 | ||||
The high correlation between PUI and PUIM verifies that the proposed pesticide use index, constructed as either the additive or the multiplicative form, has the capability to correctly reflect the pesticide use levels of the growers for identification of the low and high pesticide users.
In Table 9 the results of using PUI and PUIM to identify low pesticide users are presented. Table 9 indicates that 21 growers’ PUI values were ≤10 and another 38 growers’ PUI values were between 10 and 20. These 59 growers could be classified as the low pesticide users because their PUI values were ≤20. The comparison in Table 9 clearly shows that all the 65 growers had a PUIM value ≤100. Since PUIM ranged from 0 to 10000, the growers with PUIM≤100 could also be classified as the low pesticide users. Moreover, the growers with PUI≤20 were exactly those with PUIM≤100, though slightly different in their relative orders in the rank. However, there were 65 growers with PUIM≤100, of which 6 growers had a PUI value >20. These 6 growers could not be classified as the low pesticide users by PUI, because of their slightly higher PUI values. Therefore, it seems that it is more conservative to construct the pesticide use index from the additive form than from the multiplicative one.
Comparison of the two indices was also done in identifying high pesticide users. There were 38 growers with PUI>60, while all of them had a PUIM value >900. However, when the growers were ranked according to their PUIM values, it was found that 36 growers having a PUI value >60. Thus, the identification by PUIM kept two growers out of the group of high pesticide users when compared with the identification by PUI. The result once again confirms that PUI is more conservative than PUIM in identification of high pesticide users, though both indices are capable in the identification.
4. Conclusions
Pesticide usage for winegrape farming varies greatly in Madera County. Some farmers had high intensity of pesticide use while others had low intensity. Some farmers used a number of pesticides in their fields, but others used only one or two. These multi-intensities and multi-chemicals interacted with different toxicities, making it very complicated to comprehensively evaluate pesticide use at the grower level. In order to identify low and high pesticide users, an approach was proposed in the paper to compute an integrated pesticide use index. Both pesticide quantity and toxicity were considered as factors for establishment of the index. The index was formulated by the pesticide application intensity measured in kg/ha planted and the weights from quantity and toxicity of the compounds used.
Using the proposed approach, the pesticide usage in Madera County during 1999–2001 was analyzed. The low and high pesticide users in the county were identified, and their pesticide use patterns and pest management strategies were also analyzed. Relationships between the quantity index and the toxicity index of the integrated PUI and its components (fungicide, insecticide, and herbicide) were examined. Results from the analysis indicate that those growers with PUI≤20 can be identified as low pesticide users. In 2000 there were 62 growers with 88 fields and 2 328.73 ha vineyards falling into the category of low pesticide users. In contrast, the high pesticide users can be termed as the growers with PUI>60. In 2000, there were 19 growers with 168 fields and 4 275.15 ha being classified as the high pesticide users. The high pesticide users usually applied more than 10 pesticides in their fields, as a contrast to the low pesticide users who usually applied less than 5 pesticides.
The analysis also reveals that the number of low pesticide users steadily increased while the high pesticide users decreased in the three years under study. This indicates that the reduction of pesticide use was on the way in the county. It was also found that there was a close relationship between the quantity and toxicity contributing to the pesticide use index, with the contribution of quantity index slightly higher than that of toxicity index. The low pesticide users not only used a small quantity of pesticides, but also intended to apply the compounds with low toxicity. They mainly depended on fungicides as their main pest control measures and used few insecticides and herbicides. The high pesticide users had both high quantity and high toxicity features, indicating that they not only used a large quantity of pesticides, but also intended to use the highly toxic compounds. Considering that they had more fields and acreages, the high pesticide users might emphasize more in pest control than in the negative impacts of pesticides on environment.
Since the pesticide use index can be constructed from either additive (PUI) or multiplicative (PUIM) method, comparison of the two methods was done in identifying low and high pesticide users. The results indicate that though both PUI and PUIM were highly capable, PUI was more conservative or strict than PUIM in identifying the low and high pesticide users.
Though the data used in the analysis were several years back, the case study could still provide an alternative to identify the on-farm innovation of growers for reducing pesticide environmental risk. Therefore, it can be concluded that the proposed method is useful for analyzing pesticide use at the grower level, and identifying low and high pesticide users for further investigation of searching ways to reduce pesticide environmental risk. The low pesticide users could be further analyzed to identify their alternative farm management strategies relating to pest controls for some models worthy of extension. The extension of models for reducing pesticide risk should be focused on high pesticide users who usually own large acreages of farming. Therefore, the proposed approach is expected to be helpful for improving pesticide risk management and reducing pesticide environmental risk.
Acknowledgments
The authors would like to thank Ms. Emily OKLAY (a former colleague at UC Davis) for her preliminary analysis of pesticide use in California. We are grateful to Dr. Paul Richard MILLER (Department of Pomology, UC Davis), Dr. Mark CADY (California Alliance for Families), Dr. Chris HEINTZ (Director of California Almond Board), Dr. Gary OBENAUF (California Prune Board), and Dr. Dawit ZELEKE (Nature Conservancy’s Sacramento River Project) for their assistance in understanding pesticide use in Madera County. We would like also to thank Dr. Karen ROSS (president of California Association of Winegrape Growers), Dr. Charlie GOODMAN (Pesticide Consultation and Analysis, California Department of Food and Agriculture), and Dr. Chuan-jiang TAO (Director of the Health and Environment Division, Institute for the Control of Agricultural Chemicals, Ministry of Agriculture, China) for their encouragement and support.
Appendix
Table A1.
Names of pesticide chemicals and their corresponding orders used in winegrape farming in Madera County of California from the PUR database
| Order | Chemical code | Chemical name |
| 1 | 81 | Dicloran |
| 2 | 86 | Bacillus thuringiensis (Berliner) |
| 3 | 89 | 2-Butoxyethanol |
| 4 | 99 | Calcium hydroxide |
| 5 | 104 | Captan |
| 6 | 105 | Carbaryl |
| 7 | 142 | Citric acid |
| 8 | 151 | Copper hydroxide |
| 9 | 158 | Copper oxychloride sulfate |
| 10 | 162 | Copper sulfate (basic) |
| 11 | 173 | Cryolite |
| 12 | 175 | Copper oxide (ous) |
| 13 | 198 | Diazinon |
| 14 | 211 | Mancozeb |
| 15 | 216 | Dimethoate |
| 16 | 225 | Diphacinone |
| 17 | 231 | Diuron |
| 18 | 238 | Dinoseb |
| 19 | 253 | Chlorpyrifos |
| 20 | 310 | Gibberellins |
| 21 | 335 | Phosmet |
| 22 | 342 | Isopropyl alcohol |
| 23 | 346 | Dicofol |
| 24 | 358 | Lime-sulfur |
| 25 | 367 | Malathion |
| 26 | 369 | Maneb |
| 27 | 383 | Methomyl |
| 28 | 445 | Propargite |
| 29 | 473 | Petroleum hydrocarbons |
| 30 | 484 | Aluminum phosphide |
| 31 | 505 | Propionic acid |
| 32 | 507 | Propylene glycol |
| 33 | 510 | Pyrethrins |
| 34 | 531 | Simazine |
| 35 | 554 | Strychnine |
| 36 | 560 | Sulfur |
| 37 | 597 | Trifluralin |
| 38 | 616 | Metam-sodium |
| 39 | 626 | Zinc phosphide |
| 40 | 629 | Ziram |
| 41 | 654 | Diammonium phosphate |
| 42 | 662 | Urea |
| 43 | 667 | Zinc sulfate |
| 44 | 714 | Copper |
| 45 | 726 | Potassium nitrate |
| 46 | 748 | Alkylaryl polyoxyethylene glycol |
| 47 | 759 | Edta, tetrasodium salt |
| 48 | 763 | Petroleum distillates |
| 49 | 765 | Petroleum oil, unclassified |
| 50 | 806 | 2,4-D, dimethylamine salt |
| 51 | 871 | Phosphoric acid |
| 52 | 878 | Alkylaryl polyether alcohol |
| 53 | 881 | Alkylaryl polyoxyethylene ether |
| 54 | 909 | Sodium xylene sulfonate |
| 55 | 941 | Dodecylbenzene sulfonic acid |
| 56 | 979 | Limonene |
| 57 | 1006 | Triethanolamine |
| 58 | 1015 | Cottonseed oil |
| 59 | 1066 | Diethylamine salt of coconut fatty acid |
| 60 | 1156 | Oleic acid |
| 61 | 1159 | Modified phthalic glycerol alkyd resin |
| 62 | 1173 | Alkylphenoxy polyethoxy ethanol |
| 63 | 1198 | Free fatty acids and/or amine salts |
| 64 | 1210 | Glycol ethers |
| 65 | 1218 | Alkyl benzene sulfonic acid |
| 66 | 1244 | Octylphenoxy polyethoxy ethanol |
| 67 | 1306 | Potassium hydroxide |
| 68 | 1314 | Poly-i-para-menthene |
| 69 | 1329 | Benzoic acid |
| 70 | 1339 | Magnesium sulfate |
| 71 | 1363 | Ammonium sulfate |
| 72 | 1376 | Alkyl polyethylene glycol ether |
| 73 | 1389 | Tall oil acids |
| 74 | 1399 | Bentonite |
| 75 | 1400 | Lactose |
| 76 | 1444 | Polyoxyethylene mixed fatty acid ester |
| 77 | 1482 | Butyl alcohol |
| 78 | 1552 | Benomyl |
| 79 | 1579 | Trisodium phosphate |
| 80 | 1596 | Potash soap |
| 81 | 1598 | Coconut diethanolamide |
| 82 | 1601 | Paraquat dichloride |
| 83 | 1698 | Polyoxyethylene polypropoxy propanol |
| 84 | 1728 | Napropamide |
| 85 | 1743 | Chem1743 |
| 86 | 1757 | Edta, sodium salt |
| 87 | 1766 | Ethoxylated linear alcohols |
| 88 | 1788 | Chem1788 |
| 89 | 1821 | Starch |
| 90 | 1855 | Glyphosate, isopropylamine salt |
| 91 | 1857 | Fenamiphos |
| 92 | 1861 | Dimethyl polysiloxane |
| 93 | 1868 | Oryzalin |
| 94 | 1874 | Chem1874 |
| 95 | 1876 | Fenbutatin oxide |
| 96 | 1882 | Soybean fatty acids, dimethylamine salt |
| 97 | 1884 | Chem1884 |
| 98 | 1917 | Silicone defoamer |
| 99 | 1918 | Tetrapotassium pyrophosphate |
| 100 | 1929 | Pendimethalin |
| 101 | 1973 | Oxyfluorfen |
| 102 | 1980 | Fenarimol |
| 103 | 1986 | Chem1986 |
| 104 | 2018 | Polyoxyethylene polymer |
| 105 | 2019 | Norflurazon |
| 106 | 2023 | Oxyalkylated alcohol |
| 107 | 2024 | Chem2024 |
| 108 | 2045 | Chem2045 |
| 109 | 2048 | Alkyl oxy polyethoxy ethanol |
| 110 | 2052 | Chem2052 |
| 111 | 2068 | Dicapryl sodium sulfosuccinate |
| 112 | 2071 | Kerosene |
| 113 | 2073 | Nonylphenoxy hydroxypoly(oxyethylene) |
| 114 | 2081 | Iprodione |
| 115 | 2106 | Petroleum distillates, refined |
| 116 | 2111 | Polyacrylamide polymer |
| 117 | 2123 | Alkyl polyoxy alkylene ether |
| 118 | 2124 | Compounded silicone |
| 119 | 2136 | Chem2136 |
| 120 | 2158 | Chem2158 |
| 121 | 2177 | Sethoxydim |
| 122 | 2198 | Alkylaryl polyethylene glycol ether |
| 123 | 2234 | Fenpropathrin |
| 124 | 2245 | Myclobutanil |
| 125 | 2254 | Avermectin |
| 126 | 2260 | Triflumizole |
| 127 | 2266 | Oleic acid, methyl ester |
| 128 | 2268 | Nerolidol |
| 129 | 2269 | Farnesol |
| 130 | 2270 | Urea dihydrogen sulfate |
| 131 | 2273 | Sodium tetrathiocarbonate |
| 132 | 2277 | Cinnamaldehyde |
| 133 | 2301 | Glyphosate, monoammonium salt |
| 134 | 2327 | Glyphosate-trimesium |
| 135 | 2334 | Diethylene glycol |
| 136 | 2337 | Chem2337 |
| 137 | 2360 | Chem2360 |
| 138 | 2610 | Chem2610 |
| 139 | 2629 | Kaolin |
| 140 | 2775 | Phosphatidylcholine |
| 141 | 2912 | Tall oil |
| 142 | 2997 | Glyphosate |
| 143 | 3052 | Ammonium nitrate |
| 144 | 3247 | Isopropylamine dodecylbenzene sulfonate |
| 145 | 3519 | Methyl soyate |
| 146 | 3520 | Chem3520 |
| 147 | 3689 | Methyl silicone resins |
| 148 | 3738 | Polymerized acrylic acid |
| 149 | 3743 | Polyoxyethylene dinonyl phenol |
| 150 | 3744 | Polyoxyethylene dioleate |
| 151 | 3841 | Silicone-polyether copolymer |
| 152 | 3849 | Imidacloprid |
| 153 | 3850 | Tebuconazole |
| 154 | 3858 | Chem3858 |
| 155 | 3859 | Chem3859 |
| 156 | 3862 | Chem3862 |
| 157 | 3946 | Glufosinate-ammonium |
| 158 | 3957 | Tebufenozide |
| 159 | 3959 | Pyridaben |
| 160 | 3970 | Chem3970 |
| 161 | 3984 | Thiazopyr |
| 162 | 3988 | Chem3988 |
| 163 | 3998 | β-Pinene polymer |
| 164 | 3999 | Nonylphenol polyethylene glycol ether |
| 165 | 4000 | Cyprodinil |
| 166 | 4009 | Heptamethyltrisiloxane ethoxylated (8 EO) |
| 167 | 4015 | Alkyl (C8,C10) polyglycoside |
| 168 | 4023 | Chem4023 |
| 169 | 4037 | Azoxystrobin |
| 170 | 5015 | Ammonium propionate |
| 171 | 5016 | Chem5016 |
| 172 | 5022 | E-11-tetradecen-1-yl acetate |
| 173 | 5023 | Z-11-tetradecen-1-yl acetate |
| 174 | 5037 | Potassium bicarbonate |
| 175 | 5231 | Chem5231 |
| 176 | 5321 | Trifloxystrobin |
| 177 | 5324 | Lauric acid |
| 178 | 5325 | Chem5325 |
| 179 | 5399 | Styrene butadiene polymer |
| 180 | 5447 | QST 713 strain of dried Bacillus subtilis |
| 181 | 5451 | Kresoxim-methyl |
| 182 | 5557 | Forchlorfenuron |
| 183 | 5599 | Chem5599 |
| 184 | 5740 | Chem5740 |
| 185 | 5815 | Fluazifop-p-butyl |
| 186 | 90104 | Captan, other related |
Chem1743: nonylphenoxy polyethyleneoxy ethanol; Chem1788: poly(methylene para-nonylphenoxy)-poly(oxypropylene) propanol; Chem1874: α-alkyl-ω-hydroxypoly(oxyethylene) ethanol; Chem1884: α-alkyl-ω-hydroxypoly(oxyethylene) poly(oxyethylene); Chem1986: N,N-bis-(2-(ω-hydroxypoly(oxyethylene) ethyl) alkylamine, alkyl derived from coconut oil fatty acids; Chem2024: alkylaryl polyoxyethylene glycol phosphate ester; Chem2045: petroleum oil, paraffin based, see chemical code 401; Chem2052: α-(p-nonylphenyl)-ω-hydroxypoly(oxyethylene) with an average of 9–10 mol of ethylene oxide; Chem2136: alkyl oxy-polyoxyethylene and alkyl phenyloxy-polyoxyethylene; Chem2158: alkyl polyoxyethylene ethers, polymerized resins and fatty acids; Chem2337: encapsulated δ-endotoxin of Bacillus thuringiensis var. kurstaki in killed pseudomonas fluorescens; Chem2360: proprietary blend of linear secondary alcohols reacted with ethylene oxide; Chem2610: 2-(3-hydroxypropyl)-hepta-methyl trisiloxane, ethoxylated, acetate; Chem3520: polyalkene oxide modified heptamethyl trisiloxane; Chem3858: Bacillus thuringiensis (Berliner), subsp. kurstaki, serotype 3a,3b; Chem3859: Bacillus thuringiensis (Berliner), subsp. kurstaki, strain EG2348; Chem3862: Bacillus thuringiensis (Berliner), subsp. kurstaki, strain SA-11; Chem3970: Bacillus thuringiensis (Berliner), subsp. kurstaki, strain SA-12; Chem3988: Bacillus thuringiensis (Berliner), subsp. kurstaki, genetically engineered strain EG7841 lepidopteran active toxin; Chem4023: Bacillus thuringiensis (Berliner), subsp. kurstaki, strain HD-1; Chem5016: p-nonylphenyl polyoxyethylene (4–14 mol) dihydrogen phosphate ester; Chem5231: organosilicone, polyoxyalkylene ether copolymer; Chem5325: Bacillus thuringiensis var. kurstaki, genetically engineered strain EG7826; Chem5599: 2,6,8-trimethyl-4-nonyloxy polyethylene oxyethanol; Chem5740: α-alkyl (C12–C15) ω-hydroxypoly(oxyethylene), sodium salt
Footnotes
Project (No. 200903054) supported by the Chinese National Commonweal Research Project on Agriculture: Comprehensive Techniques for Pesticide Risk Assessment in China
References
- 1.Bugg RL, van Horn M. Ecological Soil Management and Soil Fauna: Best Practices in California Vineyards. In: Hamilton R, Tassie L, Hayes P, editors. Proceedings of the Viticulture Seminar: Viticultural Best Practices; Mildura, Victoria, Australia: Mildura Arts Centre; 1998. pp. 22–34. [Google Scholar]
- 2.CDPR (California Department of Pesticide Regulation) Summary of Pesticide Use Report Data Indexed by Chemical and by Commodity: 1990–1999. Sacramento, CA: CDPR; 2000. p. 108. [Google Scholar]
- 3.CDPR (California Department of Pesticide Regulation) Pesticide Use Reporting, an Overview of California Unique Full Reporting System. Sacramento, CA: CDPR; 2001. p. 58. [Google Scholar]
- 4.Clark MS, Ferris H, Klonsky K, Lanini WT, van Bruggen AHC, Zalom FG. Agronomic, economic, and environmental comparison of pest management in conventional and alternative tomato and corn systems in northern California. Agric Ecosyst Environ. 1998;68(1-2):51–71. doi: 10.1016/S0167-8809(97)00130-8. [DOI] [Google Scholar]
- 5.Cory JS. Assessing the risks of releasing genetically modified virus insecticides: progress to date. Crop Prot. 2000;19(8-10):779–785. doi: 10.1016/S0261-2194(00)00104-6. [DOI] [Google Scholar]
- 6.Domagalski J. Pesticides and pesticide degradation products in stormwater runoff: Sacramento River Basin, California. Water Res Bull. 1996;32(5):953–964. doi: 10.1111/j.1752-1688.1996.tb04065.x. [DOI] [Google Scholar]
- 7.Domagalski J. Pesticides in Surface and Ground Water of the San Joaquin-Tulare Basins, California: Analysis of Available Data, 1996 through 1992. Sacramento, CA: US Geological Survey (USGS); 1997. p. 74. [Google Scholar]
- 8.Domagalski J. Results of a prototype surface water network design for pesticides developed for the San Joaquin River Basin, California. J Hydrol. 1997;192(1-4):33–50. doi: 10.1016/S0022-1694(96)03124-1. [DOI] [Google Scholar]
- 9.Domagalski JL, Dubrovsky NM. Pesticide residues in ground water of the San Joaquin Valley, California. J Hydrol. 1992;130(1-4):299–338. doi: 10.1016/0022-1694(92)90115-C. [DOI] [Google Scholar]
- 10.Epstein L, Bassein S, Zalom FG. Almond and stone fruit growers reduce OP, increase pyrethroid use in dormant sprays. California Agric. 2000;54(6):14–19. doi: 10.3733/ca.v054n06p14. [DOI] [Google Scholar]
- 11.Epstein L, Bassein S, Zalom FG, Wilhoit LR. Changes in pest management practice in almond orchards during the rainy season in California, USA. Agric Ecosyst Environ. 2001;83(1-2):111–120. doi: 10.1016/S0167-8809(00)00201-2. [DOI] [Google Scholar]
- 12.Fitt GP. An Australian approach to IPM in cotton: integrating new technologies to minimize insecticide dependence. Crop Prot. 2000;19(8-10):793–800. doi: 10.1016/S0261-2194(00)00106-X. [DOI] [Google Scholar]
- 13.Gamliel A, Austerweil M, Kritzman G. Non-chemical approach to soilborne pest management organic amendments. Crop Prot. 2000;19(8-10):847–853. doi: 10.1016/S0261-2194(00)00112-5. [DOI] [Google Scholar]
- 14.Giesy JP, Solomon KR, Coates JR, Dixon KR, Giddings JM, Kenaga EE. Chlorpyrifos: ecological risk assessment in North American aquatic environments. Rev Environ Contam Toxicol. 1999;160:1–129. doi: 10.1007/978-1-4612-1498-4_1. [DOI] [PubMed] [Google Scholar]
- 15.Hall LWJ, Scott MC, Killen WD, Unger MA. A probabilistic ecological risk assessment of tributyltin in surface waters of the Chesapeake Bay watershed. Hum Ecol Risk Assess. 2000;6(1):141–179. doi: 10.1080/10807030091124482. [DOI] [Google Scholar]
- 16.Hendricks LC. Almond growers reduce pesticide use in Merced County field trials. California Agric. 1995;49(1):5–10. doi: 10.3733/ca.v049n01p5. [DOI] [Google Scholar]
- 17.Kong DY, Zhu ZL, Shi LL, Shan ZJ, Cai DJ. Effect of pesticides on groundwater under sweet potato-based cropping systems in Northern China. J Agro-Environ Sci. 2004;23(5):1017–1020. (in Chinese) [Google Scholar]
- 18.Leonard PK. Resistance risk evaluation: a European regulatory perspective. Crop Prot. 2000;19(8-10):905–909. doi: 10.1016/S0261-2194(00)00118-6. [DOI] [Google Scholar]
- 19.Levitan L. “How to” and “why”: assessing the environ-social impacts of pesticides. Crop Prot. 2000;19(8-10):629–636. doi: 10.1016/S0261-2194(00)00083-1. [DOI] [Google Scholar]
- 20.Levitan L, Merwin I. Assessing the relative environmental impacts of agricultural pesticides: the quest for a holistic method. Agric Ecosyst Environ. 1995;55(3):153–168. doi: 10.1016/0167-8809(95)00622-Y. [DOI] [Google Scholar]
- 21.Lewis KA, Newbold MJ, Hall AM, Broom CE. Eco-rating system for optimizing pesticide use at farm level: Part 1: theory and development. J Agric Eng Res. 1997;68(3):271–279. doi: 10.1006/jaer.1997.0202. [DOI] [Google Scholar]
- 22.Lewis KA, Newbold MJ, Broom CE. Eco-rating system for optimizing pesticide use at farm level: Part 2: evaluation, examples and piloting. J Agric Eng Res. 1997;68(3):281–289. doi: 10.1006/jaer.1997.0203. [DOI] [Google Scholar]
- 23.MacHardy WE. Current status of IPM in apple orchards. Crop Prot. 2000;19(8-10):801–806. doi: 10.1016/S0261-2194(00)00107-1. [DOI] [Google Scholar]
- 24.Meister RT, Sine C, Sharp DT, et al. Farm Chemical Handbook 2001. Willoughby, OH, USA: Meister Publishing Company; 2001. p. 685. [Google Scholar]
- 25.Pence RA, Grieshop JI. Mapping the road for voluntary change: partnerships in agricultural extension. Agric Hum Val. 2001;18(2):209–217. doi: 10.1023/A:1011183810989. [DOI] [Google Scholar]
- 26.Reus JAWA, Leendertse PC. The environmental yardstick for pesticides: a practical indicator used in the Netherlands. Crop Prot. 2000;19(8-10):637–641. doi: 10.1016/S0261-2194(00)00084-3. [DOI] [Google Scholar]
- 27.Reus J, Leendertse P, Bockstaller C, Fomsgaard I, Gutsche V, Lewise K, Nilsson C, Pussemier L, Trevisan M, van der Werf H, et al. Comparison and evaluation of eight pesticide environmental risk indicators developed in Europe and recommendations for future use. Agric Ecosyst Environ. 2002;90(2):177–187. doi: 10.1016/S0167-8809(01)00197-9. [DOI] [Google Scholar]
- 28.Santer L. BIOS for Almonds: A Practical Guide to Biologically Integrated Orchard Systems Management. Davis, CA: Community Alliance with Family Farmers Foundation and the Almond Board of California; 1995. p. 104. [Google Scholar]
- 29.SETAC (Society of Environmental Toxicology and Chemistry) Pesticide Risk and Mitigation. Final Report of the Aquatic Risk Assessment and Mitigation Dialog Group. Pensacola, FL: SETAC Foundation for Environmental Education; 1994. p. 220. [Google Scholar]
- 30.Solomon KR, Baker DB, Richards P, Dixon KR, Klaine SJ, La Point TW, Kendall RJ, Giddings JM, Giesy JP, Hall LWJ, et al. Ecological risk assessment of atrazine in North American surface waters. Environ Toxicol Chem. 1996;15(1):31–76. doi: 10.1002/etc.5620150105. [DOI] [PubMed] [Google Scholar]
- 31.Solomon K, Giesy J, Jones R. Probabilistic risk assessment of agrochemicals in the environment. Crop Prot. 2000;19(8-10):649–655. doi: 10.1016/S0261-2194(00)00086-7. [DOI] [Google Scholar]
- 32.Thrupp LA. Entrapment and escape from fruitless insecticide use: lessons from the banana sector of Costa Rica. Int J Environ Studies. 1990;36(3):173–189. doi: 10.1080/00207239008710594. [DOI] [Google Scholar]
- 33.Thrupp LA. Long-term losses from accumulation of pesticide residues: a case of persistent copper toxicity in soils of Costa Rica. Geoforum. 1991;22(1):1–15. doi: 10.1016/0016-7185(91)90026-M. [DOI] [Google Scholar]
- 34.Vercruysse F, Steurbaut W. POCER, the pesticide occupational and environmental risk indicator. Crop Prot. 2002;21(4):307–315. doi: 10.1016/S0261-2194(01)00102-8. [DOI] [Google Scholar]
- 35.Zhang M, Geng S, Ustin SL, Tanji KK. Pesticide occurrence in groundwater in Tulare County, California. Environmental Monitoring and Assessment. 1997;45(2):101–127. doi: 10.1023/A:1005734610694. [DOI] [Google Scholar]