Abstract
The goal of the present study was to study the effects of low- and high-energy intensity-modulated photon beams on the planning of target volume and the critical organs in cases of localized prostate tumors in a cohort of 8 patients. To ensure that the difference between the plans is due to energy alone, all other parameters were kept constant. A mean dose volume histogram (DVH) for each value of energy and for each contoured structure was created and was considered as completely representative for all patients. To facilitate comparison between 6-MV and 15-MV beams, the DVH-s were normalized. The different parameters that were compared for 6-MV and 15-MV beams included mean DVH, different homogeneity indices, conformity index, etc. Analysis of several indices depicts more homogeneous dose for 15-MV beam and more conformity for 6-MV beam. Comparison of all these parameters showed that there was little difference between the 6-MV and 15-MV beams. For rectum, 2 to 4 % more volume received high dose with the 6-MV beam in comparison with the 15-MV beam, which was not clinically significant, since in practice much tighter constraints are maintained, such that Normal Tissue Complication Probability (NTCP) is kept within 5 %. Such tighter constraints might increase the dose to other regions and other critical organs but are unlikely to increase their complication probabilities. Hence the slight advantages of 15-MV beam in providing benefits of better normal-tissue sparing and better coverage cannot be considered to outweigh its well-known risk of non-negligible neutron production.
Keywords: Energy, H-index, HI-index, normal tissue complication probability, prostate intensity-modulated radiation therapy, Sigma-index, tumor control probability
Introduction
Intensity-modulated radiation therapy (IMRT) is one of the treatment choices for localized prostate tumor irradiations. IMRT is often delivered with low-energy photons, viz., below 10 MV. These deep-seated prostate tumors were earlier treated with 3D-conformal radiation therapy (3D-CRT) using high-energy photons (15 to 25 MV). Utilization of low-energy photons in IMRT is known to have certain advantages, like high conformity, negligible neutron contamination, etc. But, there are indications provided by certain investigations, that these low-energy photons may deliver high doses in regions far from the) target.[1] Also, there are some indications in literature of better target coverage and very low risk of induction of secondary malignancies due to neutron contamination in high-energy beams.[1–4] Hence, a complete analysis of the influence of the photon energy on the quality of the IMRT plans is necessary.
For this study, a cohort of 8 prostate patients was selected, and 6-MV and 15-MV step and shoot IMRT plans were compared by calculating relative efficacies of several physical indices,[5] including primitive H-index, modified H-index, primitive HI-index, modified HI-index, S-index, conformity index and mean dose volume histogram (DVH). Two mean DVH's were generated and were considered as completely representative for 6-MV and 15-MV plans, respectively.
Materials and Methods
At our center, the radiation therapy is delivered using Elekta Precise high-energy linear accelerator. Inverse IMRT planning is done using segmental inverse optimizer of Elekta PrecisePlan planning system, version 2.03. Sample IMRT plans were created for all 8 prostate patients, and the dose prescription was 80 Gy in 40 fractions with 6-MV photons. Five co-planar fields at gantry angles of 255, 315, 45, 105, 180 degrees were used. Gross Tumor Volume (GTV), Planning Target Volume (PTV), rectum, bladder and femoral heads were contoured. The dose constraints used for these plans were in accordance with Radiation Therapy Oncology Group (RTOG) protocol and are shown in Table 1a. Segments need to be manually created in this planning system. Thus, the advantage is that, segments too can be kept constant between 6-MV and 15-MV plans. In order to study the effect of energy on the quality of the plans, competing plans were also carried out using 15-MV beams for all patients. To ensure that the similarity or difference was due to energy alone, all other parameters like beam angles, number of beams, number of segments, shapes of the segments, dose constraints, etc., were kept constant for both groups (6 MV and 15 MV). All the patients′ image sets were chosen such that, there was not much variation in their anatomy. All the patients′ Antero-Posterior (AP) and lateral dimensions were very close. The AP diameters were between 22 and 23 cm, and the lateral diameters were between 33 and 34 cm. A dose calculation grid of 3 mm was used for all patients.
Table 1a.
Constraints used for segmental inverse optimizer

GTV included gross prostate and seminal vesicles. PTV was drawn by expanding GTV by 1 cm in all directions except in the posterior direction, where 0.6 cm was used. RECT_IMRT (a portion of rectum) was derived from rectum such that it extended only 3 mm beyond PTV in superior and inferior directions. For the coplanar beams used, this definition of RECT_IMRT was chosen, as it is more sensitive to the optimization and less sensitive to the anatomy.
The following parameters were evaluated for comparison: mean DVH, primitive H-index, modified H-index, primitive HI-index, modified HI-index, S-index and conformity index.
Dose volume histograms (DVH-s) are two-dimensional representations of complex 3D dose distributions inside the patient. DVH-s can be in either differential or cumulative form. Evaluation of homogeneity of dose inside the PTV using DVH-s is of paramount importance, as the cold spots can negatively affect the tumor control[6] probability (TCP). This evaluation is also important to evaluate the efficacy of the treatment plan. All the 6-MV plans were compared with corresponding 15-MV plans on a one-to-one basis. To facilitate DVH comparison, all the DVH-s were normalized such that 95% volume of the PTV was covered by the prescribed dose of 80 Gy. In addition, a mean DVH for each contoured organ (PTV, RECT_IMRT, bladder, rt. femoral head, lt. femoral head) and energy was determined. Mean DVH can be found by averaging the volumes in each dose bin and re-plotting the data as a function of dose. BIOPLAN software developed by Nahum et al.,[7] was used to generate the mean DVH-s.
Many physical indices quantifying the homogeneity and conformity have been used over years. But, many of them have their limitations and fail to predict the homogeneity correctly. Some of them used in this study are defined below.
The conventionally used homogeneity index (H-index) is defined as the ratio of the maximum dose (Dmax) in the PTV to the prescription dose (Dp), with a value closer to 1 indicating better homogeneity. The H-index can be made more robust by using D5 instead of Dmax (modified H-index). As an improvement to H-index and modified H-index, another index called HI-index has been defined as

where D2 and D98 represent doses to 2% and 98% volume of PTV, respectively. Thus, they are representative of nominal maximum and minimum doses. DP is the prescribed dose. This HI-index can be further improved by using D5 and D95 instead of D2 and D98 (modified HI-index). This improvisation can be realized, as these new substitutions clip the usually small-volume high and low dose extremities in the cumulative DVH of the PTV and get only the steeper portion of the curve into the calculation. This work demonstrates the limitation of the H-index. Hence, other parameters were also used in an attempt to find out the appropriate energy.
One promising solution was recently reported by Yoon et al.[5] A new index called Sigma index (S-index), which gives better representation of homogeneity, was introduced by them. This index uses the differential DVH, unlike other indices, which use cumulative DVH. S-index is a measure of the standard deviation of the doses (entire curve) about the mean dose. The S-index can be evaluated using the following expression.
Dmean is the mean dose of the target (PTV in this study) curve. Di is dose to the ith bin having a volume vi. V is the total volume of the target.
Conformity index is defined as the ratio of the volume of the body receiving the prescription dose to the volume of the PTV receiving the same dose.
Results and Discussion
As stated above, all physical indices were evaluated for the two mean DVH-s of 6 MV and 15 MV, respectively.
Comparison of mean DVH-s
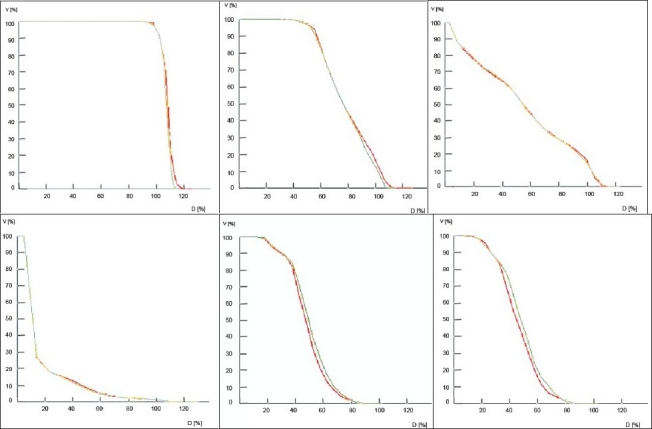
In Figure 1, 6-MV and 15-MV curves are shown in red and green color, respectively. Figure 1a shows the mean DVH-s of PTV for both 6 MV and 15 MV. As mentioned earlier, the PTV DVH-s were normalized, to facilitate comparison, thus resulting in very similar curves for both 6 MV and 15 MV. In the mean DVH-s of rectum, shown in Figure 1b, for doses greater than 80% (approximately > 64 Gy), 2% to 4% more volume received higher dose in 6 MV in comparison to 15 MV. Rectum received a higher entry dose with 6-MV beam than with 15-MV beam. There was no significant difference between 6-MV and 15-MV for bladder, as clearly evident from Figure 1c. BIOPLAN tool does not have cursors to notice the values along the graph line. Hence, the graphs were magnified and the values were measured.
Figure 1.

a: Mean dose volume histogram of Planning Target Volume
b: Mean dose volume histogram of rectum
c: Mean dose volume histogram of bladder
d: Mean dose volume histogram of body
e: Mean dose volume histogram of left femoral head
f: Mean dose volume histogram of right femoral head
In Figure 1d, the mean DVH-s of the body are shown. For 20 % to 60 % of doses, 1% to 1.5% more volume was found to receive high dose with 6-MV beam than with 15-MV beam. For 15% to 20% of doses, approximately 0.5% more volume was found to receive high dose with 15-MV beam than with 6-MV beam. Since, the magnitude of the dose delivered to PTV was very high in this study, the slight differences at very low doses (less than 10%) are not reflected in this figure. But, from the data used to plot this graph, it is clear that greater volume received high dose with the 6-MV beam than with the 15-MV beam.
As evident from Figures 1e and 1f, the mean DVH-s of femoral heads favor 6 MV in comparison with 15 MV. For 42 % to 78% of doses, 4% to 5% more volume of femoral heads received high dose with the 15-MV beam. This is because of the higher depth dose of 15-MV beam.
H, HI, modified H, modified HI, Sigma and conformity indices
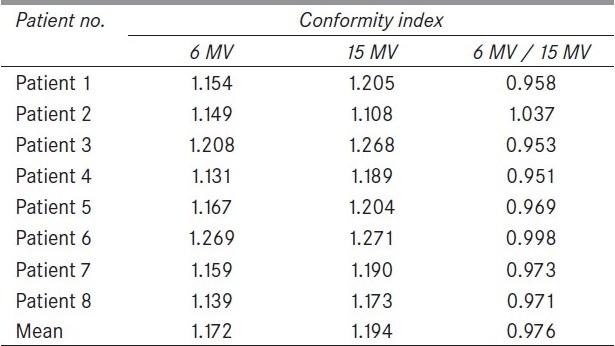
The different homogeneity indices for all the prostate patients and for both 6 and 15-MV energies are summarized in the Table 1, Table 2 and Table 3. Conformity indices are summarized in Table 4. The relative efficacy values for H-index, modified H-index, HI-index, modified HI-index and Sigma index are 1.015, 1.006, 1.031, 1.060 and 1.089, respectively. These clearly depict more homogeneous dose for 15-MV plan than for the 6-MV plan.
Table 1.
H and Mod H-Indices for eight patient intensity-modulated radiation therapy plans with 6 MV and 15 MV X-rays
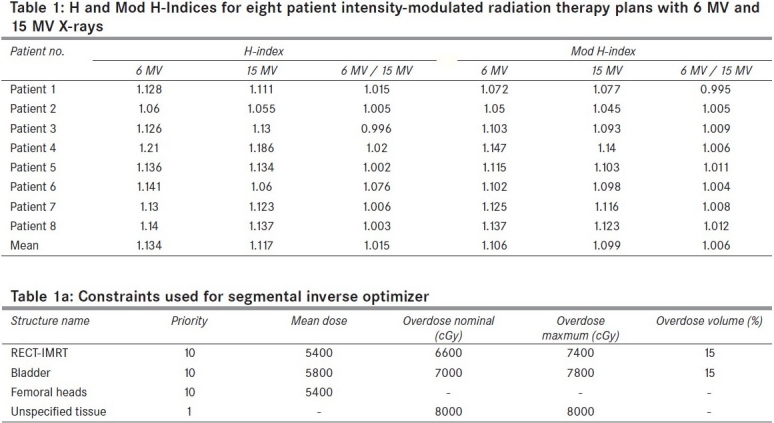
Table 2.
HI and Mod HI-indices for eight patient intensity-modulated radiation therapy plans with 6 MV and 15 MV X-rays

Table 3.
Sigma indices for eight patient intensitymodulated radiation therapy plans with 6 MV and 15 MV X-rays
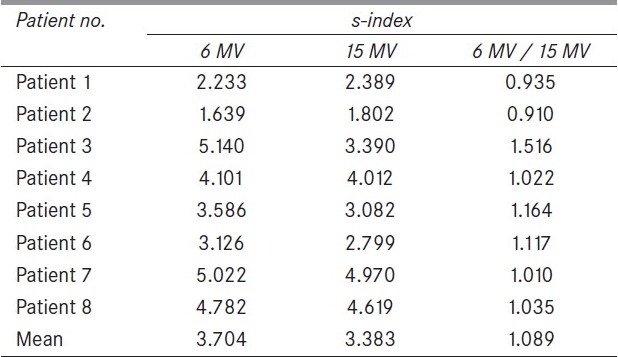
Table 4.
Conformity indices for eight patient intensity-modulated radiation therapy plans with 6 MV and 15 MV X-rays
In Figure 2, the cumulative DVH-s of 6-MV plan for Patient 1 and Patient 3 are shown in red and green solid colors, respectively. It is obvious that the dose homogeneity index of Patient 1 is better than that of Patient 3. But the H-indices are almost similar (1.128 and 1.126), as evident from Table 1. Thus, H-indices fail to predict the correct homogeneity. This work demonstrates the failure of H-index. On the other hand, the S-indices are 2.233 and 5.14 for Patient 1 and Patient 3, as evident from Table 3, predicting good accuracy. The lower the value of the S-index, the better is the homogeneity.
Figure 2.
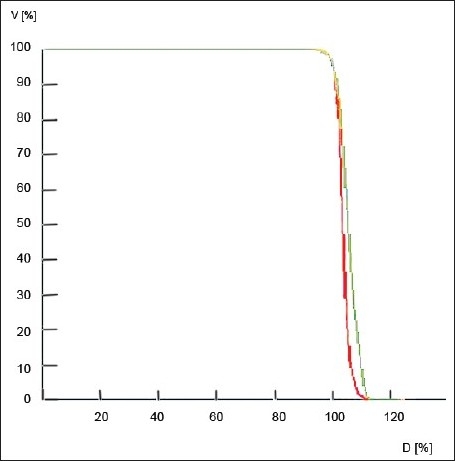
Cumulative dose volume histogram of Patient 1(red) and Patient 3 (green) - 6 MV
Miften et al.,[8] have demonstrated the use of target conformity index (TCI) and normal tissue-sparing index (NTSI) to assist in the process of judging the merit of a clinical treatment plan. But, in this work, the widely accepted conformity index was used to evaluate the conformity of the treatment plans. Table 4 shows the conformity index for all the patients and both beam energies. The mean conformity index was 1.172 and 1.194 for 6 MV and 15 MV, respectively. These small differences indicate that the plans are nearly identical in their conformity of dose to the target.
Conclusions
The mean DVH-s of PTV for both 6 MV and 15 MV show very little difference. These are consistent with the findings of Boer et al.[1] In the dose range greater than 64 Gy, 2 % to 4 % more rectum volume received a higher dose with 6-MV beam because of high entry dose. Femoral heads consistently received more dose with 15-MV beam for all patients as they received a higher depth dose. But, it is unlikely that such small magnitudes of doses can produce any complications. Except for minor differences, the mean DVH-s of body were almost same in both groups.
This work also assessed widely used homogeneity indices like H, HI, modified H and modified HI. The limitations of H-index were demonstrated, as evident from Figure 2. The S-index, proposed recently by Yoon et al.,[3] was successfully used to predict correct homogeneity, as it takes the entire DVH curve into consideration. S-index, was then, successfully used to evaluate the relative homogeneity between 6-MV and 15-MV groups. Thus, the S-index value of 1.089, as seen in Table 3, should be a good estimate of relative homogeneity between 6 MV and 15 MV energies. In addition, H-index, modified H-index, HI-index and modified HI-index were also used to evaluate the relative efficacy. Evaluation of all these parameters clearly depicts less homogeneity for 6 MV than 15 MV group. The sample size was not a bad number, and H-index was also consistent with other parameters though they failed occasionally.
A relative conformity index value of 0.976 between 6-MV and 15-MV energies shows that 6-MV group is more conformal than 15-MV group.
In general, comparison of all above parameters showed that there was little difference between 6-MV and 15-MV groups. In practice, much tighter constraints are maintained in low-energy treatment plans such that the complication probability is kept within 5%. These tighter constraints might increase dose to other regions and other critical organs but are unlikely to increase their complication probabilities. Bladder is a relatively large organ when compared to rectum and also exhibits a higher partial volume effect. Usually, only the posterior part of bladder receives a high dose, and a small increase in dose is unlikely to increase its complication probability significantly. Similarly, femoral heads are at a clinically insignificant distance from PTV (prostate and seminal vesicles) and usually experience small doses. Hence, this work encourages using 6 MV in IMRT for localized prostate tumors. Hence the slight advantages of 15 MV in providing benefits of better normal-tissue sparing and better coverage cannot be considered to outweigh its well-known risk of non-negligible neutron production.
Footnotes
Source of Support: Nil
Conflict of Interest: None declared.
References
- 1.De Boer SF, Kumek Y, Jaggernauth W, Podgorsak MB. The effect of beam energy on the quality of imrt plans for prostate conformal radiotherapy. Technol Cancer Res Treat. 2007;6:139–46. doi: 10.1177/153303460700600211. [DOI] [PubMed] [Google Scholar]
- 2.Sun M, Ma L. Treatment Exceptionally large prostate cancer patients with low energy intensity modulated photons. J Appl Clin Med Phys. 2006;7:43–9. doi: 10.1120/jacmp.v7i4.2263. [DOI] [PMC free article] [PubMed] [Google Scholar]
- 3.Hall EJ. Intensity modulated radiation therapy, protons, and risk of second cancers. Int J Radiat Oncol Bio Phys. 2006;65:1–7. doi: 10.1016/j.ijrobp.2006.01.027. [DOI] [PubMed] [Google Scholar]
- 4.Kry SF, Salehpour M, Followill DS, Stovall M, Kuban DA, White RA, et al. The Calculated Risk of Fatal Secondary Malignancies from Intensity Modulated Radiation Therapy. Int J Radiat Oncol Bio Phys. 2005;62:1195–203. doi: 10.1016/j.ijrobp.2005.03.053. [DOI] [PubMed] [Google Scholar]
- 5.Yoon M, Park SY, Shin D, Lee SB, Pyo HR, Kim DY, et al. A new homogeneity index based on statistical analysis of the dose-volume histogram. J Appl Clin Med Phys. 2007;8:9–17. doi: 10.1120/jacmp.v8i2.2390. [DOI] [PMC free article] [PubMed] [Google Scholar]
- 6.Tome WA, Fowler JF. On cold spots in tumor subvolumes. Med Phys. 2002;29:1590–8. doi: 10.1118/1.1485060. [DOI] [PubMed] [Google Scholar]
- 7.Sanchez-Nieto B, Nahum AE. BIOPLAN: Software for the Biological evaluation of radiotherapy treatment plans. Med Dosim. 2000;25:71–6. doi: 10.1016/s0958-3947(00)00031-5. [DOI] [PubMed] [Google Scholar]
- 8.Miften MM, Das SK, Su M, Marks LB. A dose-volume based tool for evaluating and ranking IMRT treatment plans. J Appl Clin Med Phys. 2004;5:1–14. doi: 10.1120/jacmp.v5i4.1981. [DOI] [PMC free article] [PubMed] [Google Scholar]


