Abstract
Polarization may be sensed by imaging modules. This is done in various engineering systems as well as in biological systems, specifically by insects and some marine species. However, polarization per pixel is usually not the direct variable of interest. Rather, polarization-related data serve as a cue for recovering task-specific scene information. How should polarization-picture post-processing (P4) be done for the best scene understanding? Answering this question is not only helpful for advanced engineering (computer vision), but also to prompt hypotheses as to the processing occurring within biological systems. In various important cases, the answer is found by a principled expression of scene recovery as an inverse problem. Such an expression relies directly on a physics-based model of effects in the scene. The model includes analysis that depends on the different polarization components, thus facilitating the use of these components during the inversion, in a proper, even if non-trivial, manner. We describe several examples for this approach. These include automatic removal of path radiance in haze or underwater, overcoming partial semireflections and visual reverberations; three-dimensional recovery and distance-adaptive denoising. The resulting inversion algorithms rely on signal-processing methods, such as independent component analysis, deconvolution and optimization.
Keywords: polarized light, computational vision, computational photography, scattering, reflection
1. Introduction
An expanding array of animals are found to have a visual system that is polarization-sensitive, using several mechanisms [1,2]. This array includes various marine animals [3–17] as well as air and land species [18–22]. It has been hypothesized and demonstrated that such a capacity can help animals in various tasks, such as navigation (exploiting the polarization field of the sky), finding and discriminating mates, finding prey and communication.
Similarly, machine vision systems may benefit from polarization. Thus, computational methods are being developed for polarization-picture post-processing (defined here as P4). Some tasks are enhancement of images, and extraction of features useful for higher-level operations (segmentation and recognition). In this paper, we focus on inverse problems that can be solved using P4. In these problems, a physical model of effects occurring in the scene can be formulated in a closed form. Inversion of the model quantitatively recovers the scene, overcoming various degradations. In the context of polarization, this approach is used in remote sensing from satellites, astronomy and medical imaging. In contrast, this paper surveys several inverse problems relating to objects, distances and tasks that are encountered or applicable to everyday scenarios. In such commonly encountered cases and life-sizes, we show how polarization provides a useful tool.
2. Descattering
In atmospheric haze or underwater, scene visibility is degraded in both brightness contrast and colour. The benefit of seeing better in such media is obvious, for animals, human operators and machines. The mechanisms of image degradation both in haze and underwater are driven by scattering within the medium. The main difference between these environments is the distance scale. Other differences relate to the colour and angular dependency of light scattering. Due to the similarity of the effects, image formation in both environments can be formulated using the same parametric equations: the mentioned differences between the media are expressed in the values taken by the parameters of these equations.
It is often suggested that P4 can increase contrast in scattering environments. One approach is based on subtraction of different polarization-filtered images [23–25], or displaying the degree of polarization (DOP) [26,27]. This is an enhancement approach, rather than an attempt to invert the image formation process and thus recover the objects. Furthermore, this approach associates polarization mainly with the object radiance. However, rather than the object, light scattered by the medium (atmosphere or water) is often significantly polarized [6,28,29] and dominates the polarization of the acquired light.
(a). Model
In this section, we describe a simple model for image formation in haze or water, including polarization. Then, this model is mathematically inverted to recover the object. Polarization plays an important role in this recovery task [30–35].
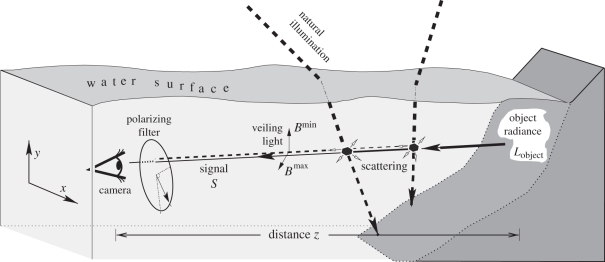
As depicted in figure 1, an image acquired in a medium has two sources. The first source is the scene object at distance z, the radiance of which is attenuated by absorption and scattering. This component is also somewhat blurred by scattering, but we neglect this optical blur, as we explain later. The image corresponding to this degraded source is the signal
| 2.1 |
where Lobject is the object radiance we would have sensed, had there been no scattering and absorption along the line of sight (LOS), and (x,y) are the image coordinates. Here t(z) is the transmissivity of the medium. It monotonically decreases with the distance z.
Figure 1.
Underwater imaging of a scene through a polarizing filter. Light enters the water and scatters towards the camera by particles in the water, creating path radiance (dashed rays). This veiling light increases with the distance z to the object. Light emanating from the object is attenuated and somewhat blurred as z increases, leading to the signal S (solid ray). The partial polarization of the path radiance is significant. Without scattering and absorption along the line of sight (LOS), the object radiance would have been Lobject. (Reproduced with permission from [33]. Copyright © IEEE.)
The second source is ambient illumination. Part of the illumination is scattered towards the camera by particles in the medium. In the literature, this part is termed path radiance [36], veiling light [6,16,37], spacelight [4,6,16,29] and backscatter [38]. In literature dealing with the atmosphere, it is also termed airlight [39]. This component is denoted by B. It monotonically increases with z. The total image irradiance is
| 2.2 |
Clearly, B is a positive additive component. It does not occlude the object. So, how come B appears to veil the scene? Furthermore, the image formation model (equations (2.1) and (2.2)) neglects any optical blur. Thus, how come hazy/underwater images appear blurred? The answer to these puzzles is given in Treibitz & Schechner [40]. Due to the quantum nature of light (photons), the additive component B induces random photon noise in the image. To understand this, recall that photon flux from the scene and the detection of each photon are Poissonian random processes [41]. This randomness yields an effective noise. The overall noise variance [41–43] of the measured pixel intensity is approximately
 |
2.3 |
Here κ and g are positive constants, which are specific to the sensor. Due to equations (2.2) and (2.3), B increases Itotal and thus the noise1 intensity. The longer the distance to the object, the larger B is. Consequently, the image is more noisy there, making it more difficult to see small object details (veiling), even if contrast-stretching is applied by image post-processing. As analysed in Treibitz & Schechner [40], image noise creates an effective blur, despite an absence of blur in the optical process: the recoverable signal has an effective spatial cutoff frequency, induced by noise.
To recover Lobject by inverting equation (2.1), there is first a need to decouple the two unknowns (per image point) S and B, which are mixed by equation (2.2). This is where P4 becomes helpful. Let images be taken through a camera-mounted polarizer. As we will see below, polarization provides two independent equations, to solve for the two mentioned unknowns. Typically, the path radiance B is partially polarized [6,16,23,28,39,44]. Hence, polarization-filtered images can sense smaller or higher intensities of the path radiance B, depending on the orientation of the camera-mounted polarizer (figure 1), relative to the polarization vector of the path radiance. There are two orthogonal orientations of the polarizer for which its transmittance of the path radiance reaches extremum values Bmax and Bmin, where B = Bmax + Bmin. At these orientations, the acquired images are
| 2.4 |
Equation (2.4) assumes that the polarization of the object signal is negligible relative to that of the path radiance. In some cases this assumption may be wrong, particularly at close distances. However, in many practical cases, the approximation expressed by equation (2.4) leads to effective scene recovery. The two equations (2.4) provide the needed constraints to decouple the two unknowns S and B, as described in Kaftory et al. [31], Namer et al. [32], Schechner et al. [34] and Treibitz & Schechner [35].
(b). Inversion
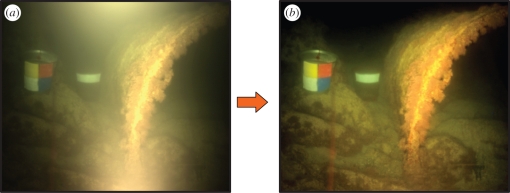
The above model applies both to natural lighting (which is roughly uniform along horizontal lines of sight) and artificial illumination. An example of the latter is shown in figure 2. Here, a polarizer was mounted on the light source, and another polarizer was mounted on the camera. Rotating one of the polarizers relative to the other yielded two images modelled by equation (2.4). They were processed to recover S.
Figure 2.
Polarization-based unveiling of a Mediterranean underwater scene under artificial illumination, at night. (a) Raw image. (b) Recovered signal S. (Reproduced with permission from [35]. Copyright © IEEE.)
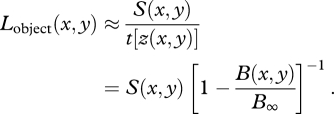
To recover Lobject by inverting equation (2.1), there is first a need to know t(z) per point. How can t(z) be assessed? In natural lighting, where the lighting along the LOS is roughly uniform [33,34],
| 2.5 |
Here B∞ is the value of B in an LOS which extends to infinity in the medium. This value can be calibrated in situ [32–35]. Recall that B is recovered using P4. Consequently, based on equations (2.1) and (2.5), the object radiance can be recovered approximately by
 |
2.6 |
This concludes the descattering process.
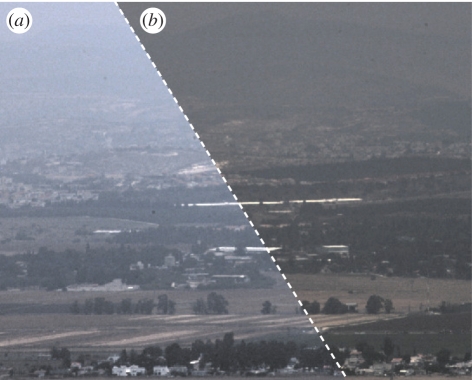
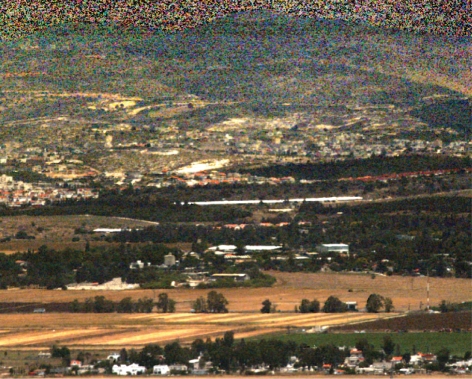
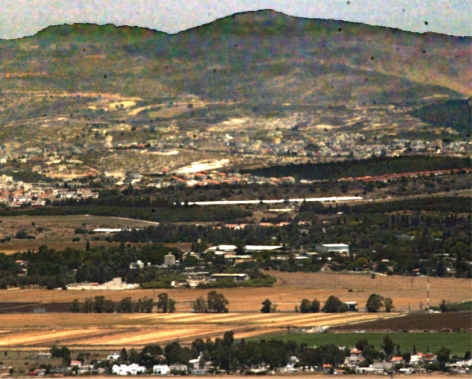
An example of descattering in haze (dehazing) is shown in figures 3 and 4. The recovered image [31] has strong contrast everywhere and vivid colours. The colours are recovered, since the degradation inversion is done per colour channel (wavelength band). This automatically accommodates the dependency of t, B∞ and the DOP on the wavelength band. Despite this, the recovered result is very noisy in the background. This noise is not owing to the mathematical dehazing process. Fundamentally, it is owing to the poor background signal to noise ratio (SNR) of the raw data: owing to the small value of t(z) at large z, the signal (equation (2.1)) is low. Moreover, at these areas the noise is high, owing to increased photon-noise induced by a high B, as described above (equations (2.2) and (2.3)) and in Treibitz & Schechner [40,45]. The noise can be countered in a way described in §3.
Figure 3.
Polarization filtered images taken on a hazy day. (a) Imax; (b) Imin. (Reproduced with permission from [31]. Copyright © IEEE.)
Figure 4.
Scene dehazing using equation (2.6), based on images shown in figure 3. The restoration is noisy, especially in pixels corresponding to the distant mountain. (Reproduced with permission from [31]. Copyright © IEEE.)
3. Three-dimensional recovery
(a). Distance map
Descattering based on P4 has an important by-product: a three-dimensional mapping of the scene. This outcome is explained in this section. As we now show, the path radiance can be estimated based on two polarization-filtered frames. Using equation (2.4),
| 3.1 |
where p is the DOP of the path radiance. This parameter can be calibrated based on images taken in situ [32–35]. Equation (3.1) yields the estimated path radiance
 |
3.2 |
This is an approximate relation, since it relies on the assumption that the object signal is unpolarized.
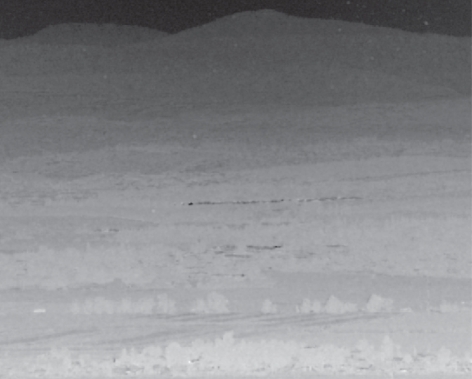
As an example, figure 5 shows a negative image of the path radiance estimated [31] based on the images shown in figure 3. This appears to represent the distance map of the scene: darker pixels are farther from, while brighter pixels are generally closer to the viewer. Actually, there is indeed an equivalence (up to a couple of scale parameters) between B, the distance z and the medium transmissivity t: the transmissivity monotonically decreases with z, while B monotonically increases with z (see equation (2.5)). In case of a uniform medium, the transmissivity is
| 3.3 |
where the constant β is the attenuation coefficient of the medium. This constant coefficient is inversely related to the attenuation distance in the medium: the scale of β is approximately (0.1–1) m−1 underwater and approximately (10−4–10−3) m−1 in haze.
Figure 5.
The estimated path radiance. This map is equivalent to the estimated atmospheric transmissivity, and thus the distance to each scene point. In this image, dark pixels indicate higher path radiance and thus a larger distance to the objects shown in figure 3. (Reproduced with permission from [31]. Copyright © IEEE.)
Using equations (2.5), (3.3) and (3.2), the distance map of the scene, z(x, y), can be estimated as
 |
3.4 |
Equation (3.4) shows how P4 yields an estimate of the distance per image point. This estimation depends on several global parameters (p, β, B∞) which can be assessed based on the image data [32,34,35]. The distance map z(x, y) expresses the observed three-dimensional structure of the scene.
There are additional ways in which P4 can help in three-dimensional recovery. Shape is often derived using triangulation cues: stereoscopic vision and parallax created by motion. It can be helpful to fuse the polarization cue with triangulation (parallax), when seeking three-dimensional recovery of a scene in scattering media. This is done in Sarafraz et al. [46]. Binocular stereo helps the recovery particularly when the path radiance has low DOP. On the other hand, polarization helps the recovery irrespective of object texture or surface markings to which stereoscopic recovery is sensitive. Moreover, a stereoscopic setup can simultaneously acquire two polarization-filtered images, e.g. using a distinct polarizer orientation per camera. This is helpful in dynamic scenes. Sarafraz et al. [46] models the image formation process by combining stereoscopic viewing geometry and scattering effects. The recovery is then expressed as inversion of this model.
An additional way to exploit triangulation for shape recovery is by using structured illumination. In this method, one of the stereo cameras is replaced by a light source, which projects a narrow beam on the scene. Triangulation between the illuminated object spot and the LOS yields the object distance, per image point, while the beam scans the scene. Triangulation becomes more complicated in scattering media, owing to backscatter. Hence, Gupta et al. [30] incorporated backscatter polarization into analysis of structured illumination.
(b). Distance adaptation of noise suppression
We now describe an additional benefit to the observation that the distance, transmissivity and path radiance can be estimated using P4. In figure 4, the dehazed image is noisy in the background, owing to the high values of B and low values of t there [34,35]. Image denoising can enhance images: it attenuates the noise, but this comes at a cost of resolution loss [40]. Consequently, if denoising is to be properly applied in the recovery, then it should only be mild (or not be applied at all) in the scene foreground, where the SNR is high. This way, foreground areas suffer no resolution loss. On the other hand, background regions are very noisy, and may thus benefit from aggressive noise-countering measures. In short, descattering that accounts for noise should apply denoising measures that are adaptive to the object distance (or medium transmissivity). Fortunately, the distance and transmissivity can be derived from the polarization data, as described above.
This principle is the basis of descattering methods that are described in Kaftory et al. [31], Schechner & Averbuch [47]. There, the recovery is not done by directly using equations (2.6) and (3.2). Instead, the recovery task is expressed as an optimization problem. As commonly done in optimization formulation, first, a cost function Ψ is defined for any potential (and generally wrong) guesses of Lobject and B, which are denoted by Lobjectpotential and Bpotential, respectively. The sought optimal solution is the one that minimizes Ψ:
| 3.5 |
The optimal solution  should fit the model (2.4) and (3.1) to the data {Imax, Imin} but at the same time, the sought fields
  should be spatially smooth, not noisy. The two conflicting requirements: data fitting versus smoothness (regularization), are expressed as terms in the cost function
| 3.6 |
Until this point the optimization formulation is standard. The novelty in Kaftory et al. [31] and Schechner & Averbuch [47] is that the conflicting requirements (fitting and smoothness) are mutually compromised in a way which depends on the distance: at farther objects, smoothness is more strongly imposed.
For example, in Schechner & Averbuch [47], the following operator is used to measure non-smoothness, and thus increase the cost function at noisy potential solutions:
| 3.7 |
Here  is the two-dimensional Laplacian operator. A more unsmooth result increases the absolute output of the Laplacian. This increases Ψ. Adaptivity to the object distance is achieved by the weighting operator
  . It depends explicitly on the transmissivity t at each pixel, hence it is implicitly adaptive to the object distance z. Let
| 3.8 |
Recall from equation (3.3) that t(x, y) ∈ [0,1]. Thus, the weighting  emphasizes the regularization (hence smoothness) at points corresponding to distant objects (where t(x, y) → 0), and turns off the regularization at close objects (where t(x, y) → 1). Kaftory et al. [31] uses a more sophisticated regularization term. In any case, the optimal solution (3.5) is found by numerical algorithms that run on a computer. A result [31] is shown in figure 6. Compared with figure 4, the result in figure 6 suppresses noise in the background, without blurring the foreground.
Figure 6.
Optimization-based restoration of the scene in figure 3. It regularizes the solution in a way that adapts to the object distance. The restoration has low noise (compared with figure 4), without excessive blur. (Reproduced with permission from [31]. Copyright © IEEE.)
(c). Three-dimensional object shape, without a medium
Section 3a shows that a medium that scatters partially polarized light encompasses information about the three-dimensional structure of the objects behind it. However, often objects are very close, without a significant medium between them and the camera or eye. Then, other methods should be used to assess the three-dimensional shape of objects. Many established methods rely on triangulation, photometric stereo, shading and shadows. Nevertheless, new methods have recently been developed for three-dimensional recovery, that rely on partial polarization of reflected light.
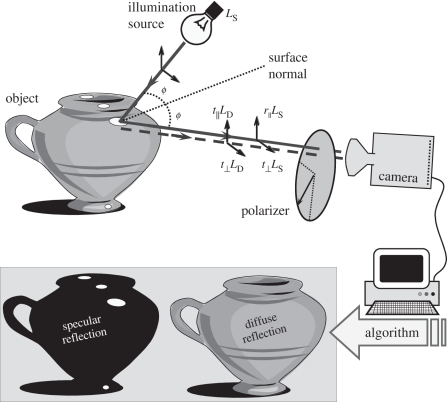
Rahmann & Canterakis [48] observed that the polarization of reflected light yields constraints on the shape of opaque, specular objects. Consider figure 7. An incident light ray is specularly reflected from a surface. The incident ray, the specularly reflected ray and the surface normal all reside in the same plane, termed the plane of incidence (POI). Assuming the incident ray to be unpolarized, the specular reflection is partially polarized. The orientation of the polarization vector is perpendicular to the POI. Hence, measuring the orientation of the polarization vector imposes one constraint on the surface normal. Furthermore, the DOP of specularly reflected light depends on the angle of incidence, which equals the angle between the surface normal and the LOS. For a given material, this dependency is known, since it is dictated by the Fresnel coefficients. Hence, measuring the DOP imposes a second constraint on the surface normal. Integrating the constraints on the surface normals of all observed points yields an estimate of the three-dimensional shape [48]. A similar approach was developed for recovering the shape of specular transparent objects [49], where internal reflections inside the object had to be accounted for.
Figure 7.
A plane of incidence (POI) is defined by the LOS and the surface normal. A source illuminates the object with irradiance LS. Part of the light is specularly reflected, with radiance proportional to the specular reflectance coefficient. This coefficient depends on the polarization component relative to the POI. It also depends on the angle of incidence ϕ. Another portion of the object irradiance is diffusely reflected. Diffuse reflection is created by the penetration of irradiance into the surface. Consequent subsurface scattering yields radiance LD. A portion of LD leaves the surface towards the camera, as dictated by the transmittance coefficient of the surface. Also this coefficient depends on ϕ and the sensed polarization component. P4 can help separate the diffuse and specular reflections, and derive shape information.
Recovering the shape of diffuse objects with the help of P4 has been done in Atkinson & Hancock [50]. In diffuse reflection, the orientation of the polarization vector and the DOP provide constraints on the surface normal, which are different from the constraints stemming from specular reflection. Anyway, polarization-based shape cues [48–50] do not rely on prominent object features, and apply even if the objects are textureless. Hence, they complement triangulation-based methods of shape recovery.
4. Separation of semi-reflections
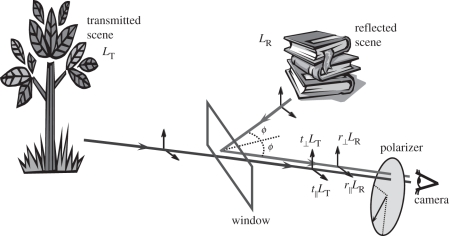
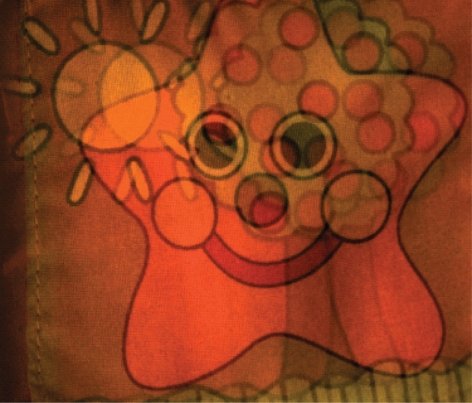
Semi-reflections pose a challenge to vision, either biological or artificial. In nature, such reflections exist in a water–air interface, when looking into or out of water. In man-made environments, they are created by glass windows,2 which superimpose a scene behind the window and a reflection of a scene in front of the window, as illustrated in figure 8. This creates confusing images, as the one shown in figure 9. Several methods were developed to attack this problem. Some of them are based on motion and stereo vision [51,52], but require extensive computations. A simple, straightforward approach is to use P4. A semi-reflecting interface affects the polarization state of reflected and transmitted light in a different manner. This difference can be leveraged to separate [53,54], recover, and label the reflected and transmitted scenes.
Figure 8.
A semi-reflecting surface, such as a glass window, superimposes a transparent scene LT on a reflected scene LR. The superposition is linear, with weights that depend on the reflectance and transmittance coefficients of the semi-reflecting object. These coefficients depend on the fixed angle of incidence ϕ. They also depend on the polarization component, relative to the POI.
Figure 9.
A real-world frame acquired through a transparent window. In addition to the superposition of two scenes, note the secondary reflections (replications), e.g. of the Sun and tree. (Reproduced with permission from [55]. Copyright © IEEE.)
The object behind the semi-reflector is transmitted, thus variables associated with it are denoted by ‘T’. An object on the camera-side of the semi-reflector is reflected, thus variables associated with it are denoted by ‘R’. Specifically, LT is the radiance of the transmitted object (figure 8). Similarly, LR is the radiance of the reflected object, as measured if the semi-reflector was replaced by a perfect mirror. The two unknowns LT (x, y) and LR (x, y) affect the sensed image, per point (x, y). Similarly to §2, solving for the two unknowns is facilitated by using two independent equations, which are based on two polarization-filtered images.
(a). Thin reflector
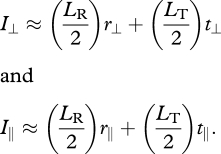
As we describe later in §4b, semi-reflections may be accompanied by multiple spatial shifts. For simplicity, let us ignore, for the moment, this effect. Simple reflection (without observed spatial shifts) occurs in an air–water interface. It also occurs in reflection by thin windows. A ray incident on the reflecting surface is partly reflected and partly transmitted. All rays are in the POI (see figure 8). The POI sets two polarization components: parallel and perpendicular to the POI. For each of these components, the semi-reflector has, respectively, reflectance and transmittance coefficients, r||, r⊥ and t||, t⊥. Using a polarization-sensitive camera, we may take images of the compound scene. The camera-mounted polarizer is oriented at the corresponding parallel and perpendicular directions (figure 8), yielding two images, which are modelled by Schechner et al. [54]
 |
4.1 |
Equation (4.1) assumes that light emanating from the scene objects (prior to reaching the semi-reflector) has negligible partial polarization. In other words, all polarization effects are caused by the semi-reflector. Accordingly, the light intensity carried by LT is equally split between I⊥ and I||. The same split applies to LR. In some cases this assumption may be wrong, particularly when the objects are shiny. However, the approximation expressed by equation (4.1) often leads to effective scene recovery.
The two equations (4.1) provide the information needed to decouple the two unknowns LT and LR, as described in Schechner et al. [54]. If the coefficients {r||, r⊥, t||, t⊥} are properly set, then simply solving the two linear equations (4.1) yields the two unknown scenes:
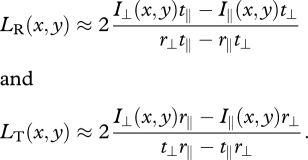 |
4.2 |
We now explain how the coefficients are set. The coefficients {r||, r⊥, t||, t⊥} are derived from the Fresnel coefficients, while accounting for inter-reflections inside the semi-reflector (see [54]). They depend on the media interfacing at the semi-reflecting surface [54] (typically, water, air and glass), which are known.
The coefficients also depend on the angle of incidence ϕ (see figure 8). If this angle is known, then {r||, r⊥, t||, t⊥} are uniquely set. However, ϕ is usually unknown, and needs to be estimated based on the raw images {I⊥, I||}. This is done in Schechner et al. [54] using the following trick. Any wrong estimation of ϕ yields the wrong coefficients {r||, r⊥, t||, t⊥}. This, in turn, yields a wrong recovery via equation (4.2). A wrong recovery is rather easily spotted, since it exhibits a significant crosstalk [54] between the estimated images {LR, LT}. Crosstalk is detected computationally, using cross-correlation. Hence, a simple computational algorithm, which seeks to minimize the correlation between the estimated {LR, LT} automatically rejects wrong solutions. This leads to a correct ϕ.
The method we just described, which uses cross-correlation to find the mixture parameters, implicitly assumes that the original signals LR and LT are independent of each other. Algorithms that make this assumption for the purpose of signal separation are often referred to as independent component analysis (ICA).
(b). Overcoming visual reverberations
Light rays incident on a window are reflected back and forth inside the glass. Such internal reflections affect the contribution of both sources: a spatial effect is created of dimmed and shifted replications. Figure 9 demonstrates this effect in a real photograph taken via a window. In addition to the superimposed scenes (toys of a star versus a tree in the Sun), a shifted and weaker replica of the Sun and tree is clearly seen. This is caused by internal reflections that take place inside a window. In addition to that clear replica, there is also a replica of the other scene (star). Additional higher order replicas exist for both objects, but are often too dim to see. Overall, the acquired photograph contains a superposition not only of the two original scenes, but also of those same scenes displaced to various distances and in different powers. Prior studies (including the one described in §4a) did not account for this effect. There, the model and algorithms focused on the limit case, in which the displacement between the replicas is negligible. This is not a valid situation in general.
Visual spatial displacements created by optical reflections are analogous to temporal displacements created by reflections of temporal sound and radio signals. In analogy to the displaced replica in our study, a sound reflection creates a delayed echo. In the field of acoustics, this effect is generally referred to as reverberations. Hence, we use the term visual reverberations to describe the effect we deal with.
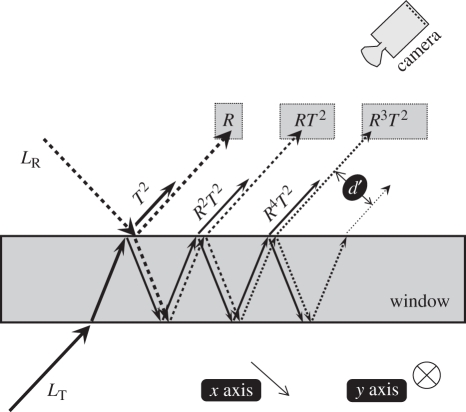
This section generalizes the model and treatment of semi-reflections to deal with this effect. Consider figure 10. A light ray from the object LR reaches the window. There, it undergoes a series of reflections and refractions. The internal reflections inside the window create a series of rays emerging from the window. For example, let us derive the intensities of some of these rays. First, the ray LR partly reflects from the front air–glass interface, yielding a ray the intensity of which is LRR, where R is the reflectance of the interface. The ray LR is also partly transmitted into the glass, with transmittance coefficient T. The ray in the glass hits the back glass–air interface, and partially reflects there. This internally reflected ray returns to the front air–glass interface, and is partially transmitted through the interface to the air, towards the camera. Thus, before it emerged into the air, this ray underwent a total of two transmissions through the front interface, and one reflection at the back interface (figure 10). Thus, the emerging ray has intensity LRRT2. Similarly, the intensities of other reflected rays in the system can be derived.
Figure 10.
Primary and secondary reflections of LT (solid) and LR (dotted). The distance between the emerging rays is d′.
A similar analysis applies to a ray from the object LT, as illustrated in figure 10. This ray also undergoes a series of reflections and refractions, resulting in a series of rays emerging from the window. For example, first, the ray LT partly transmits through the back air–glass interface, and then partly transmits through the front glass–air interface. Thus, these two transmissions yield a ray the intensity of which is LTT2. In addition, the transmitted ray in the glass undergoes two internal reflections (one in the front and the other in the back interface), before it returns to the front glass–air interface, where it is partially transmitted to the air (figure 10), towards the camera. Thus, before it emerged into the air, this ray underwent a total of two transmissions (one at each interface) and two internal reflections (one at each interface). Thus, the emerging ray has intensity LTR2T2. The power of successive secondary reflections rapidly tends to zero.
Since the window is flat, all the rays are in the POI. The distance between successive emerging rays (secondary reflections) is d′. The reflectance coefficients per polarization component are R⊥ and R||, at each interface of the window.3 Similarly, the transmittance coefficients per polarization component are T⊥ and T||, at any one of the two interfaces of the window.4 The closed-form expressions for {R||, R⊥, T||, T⊥} are given in Diamant & Schechner [55].
It is clear from figure 10 that the secondary reflections create a spatial effect. Each object point is sensed simultaneously in different image points, since the energy of an object point is dissipated among different reflection orders. Hence, the transmitted scene undergoes a convolution with a particular point-spread function (PSF). As seen in figure 10, the PSF of the transmitted scene is
| 4.3 |
when measuring only the polarization component parallel to the POI, while δ is the Dirac delta function. Here d is the distance between successive visual echoes of LT, as received by the camera (in pixels). It is given by d = α d′, where d′ is the physical distance (in centimetres) between secondary reflections, depicted in figure 10, and α is the camera magnification. In this model, each object point corresponds to a parallel set of rays, which in turn corresponds to a set of equally interspaced pixels [55].
Similarly, the PSF of the reflected scene is
| 4.4 |
when measuring only the parallel polarization component. The perpendicular components also undergo convolutions: the corresponding PSFs hR⊥ and hT⊥ are derived analogously,5 by using R⊥ and T⊥ instead of R||, T|| in equations (4.3) and (4.4).
The acquired image intensity is a linear superposition of the reflected and transmitted scenes. In §4a, this superposition was pointwise, since in the imaging conditions there, spatial effects were not seen. In contrast, here the superposition is of convolved scenes. Generalizing equation (4.1), the acquired images are
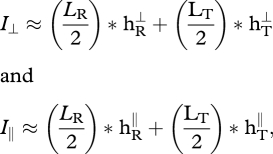 |
4.5 |
where * denotes convolution.
Solving for the two unknowns {LR, LT} is possible using the two equations (4.5), though the solution is more elaborate than equation (4.2). A mathematical way to extract {LR, LT} is described in Diamant & Schechner [55]. A way to solve the problem is using an optimization formulation, similar to the one described in §3b. In analogy to equation (3.5), the optimal sought solution is
| 4.6 |
where {LRpotential, LTpotential} are any potential (and generally wrong) guesses for the reflected and transmitted scenes.
The optimal solution should fit the model (4.5) to the data {I⊥, I||}, but at the same time, the sought field LR should be spatially smooth, not noisy (there is no practical need to impose smoothness on LT, since it is inherently less noisy [55]). As an example, consider figure 9. This is I⊥. The image I|| is somewhat similar. Based on these two images [55], the recovered LR is depicted in figure 11, while LT is shown in figure 12. In both images, the recovery has no apparent crosstalk and no reverberations.
Figure 11.
The reconstructed LR in the experiment corresponding to figure 9. It has neither visual reverberations nor apparent trace of the complementary scene LT, the estimate of which is shown in figure 12. (Reproduced with permission from [55]. Copyright © IEEE.)
Figure 12.
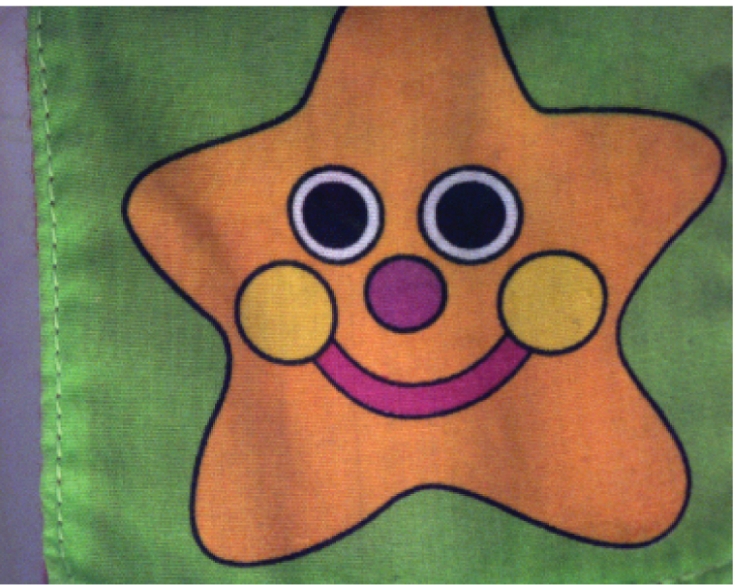
The reconstructed LT in the experiment corresponding to figure 9. It has neither visual reverberations nor apparent trace of the complementary scene LR, the estimate of which is shown in figure 11. (Reproduced with permission from [55]. Copyright © IEEE.)
(c). Separating specular and diffuse reflections
A related problem to semi-reflection from transparent surfaces is reflection from opaque objects. Here, too, the image has two components, as illustrated in figure 7. One component is diffuse reflection. It is strongly affected by the inherent colour of the object, but is rather insensitive to change of viewpoint and the DOP of which is usually low. The other component is specular reflection, the colour of which matches the illumination colour. It is highly sensitive to changes of viewpoint, and its DOP is often significant. Separating and recovering each of these components is important, for several reasons: each of these reflection types gives different cues about the object shape, as described in §3c; specular reflection may confuse triangulation methods, hence removing specularities is useful in this context; and the different colours of these components may confuse vision.
P4 is helpful for inverting the diffuse/specular mixture, hence separating these reflection components. Umeyama and Godin [56] acquired images at different orientations of a polarizer (figure 7). This way, it changes the relative contribution of two components in the images. The acquired images then undergo ICA to solve for the two unknown fields: the specular image and the diffuse image. Nayar et al. [57] fuse colour and polarization data to recover the components.
5. Discussion
The methods described above have been demonstrated in man-made systems involving computers. An interesting question is, whether these methods indicate that animals may also recover scenes using their polarization-sensitive vision. Do some animals see farther in a medium, by descattering the scene using polarization? Are there animals that use polarization in order to assess distances to objects, or estimate the shape of objects, even roughly, in the context of some task (e.g. preying or courting)? Can animals that prey through the surface of seas or lakes (some birds, fish, crocodiles), upwards or downwards, use polarization in order to remove semi-reflections from the surface? Perhaps polarization is used for separating specular from diffuse reflection [19] in nature to provide an advantage in seeking food in the open air?
It is also possible to consider exploitation of these effects to confuse predators. Suppose a predator uses path-radiance polarization for distance assessment. Then, a marine animal that has a polarizing skin would confuse this distance assessment, hence gaining an advantage in avoiding attack by the predator. These are fascinating questions and possibilities. Biological systems do not work as the computational algorithms described in this paper. But, the algorithms prove feasibility: some computational systems can recover scenes using polarization. Biological brains are also computational systems. Perhaps they do it too.
Acknowledgements
This paper surveys the work I have done with several coauthors to whom I am grateful: Yuval Averbuch, Yaron Diamant, Ran Kaftory, Nir Karpel, Nahum Kiryati, Mohit Gupta, Einav Namer, Shahriar Negahdaripour, Amin Sarafraz, Srinivas Narasimhan, Shree Nayar, Joseph Shamir, Sarit Shwartz, Tali Treibitz and Yehoshua Zeevi. Thanks are also due to Justin Marshall, David O'Carroll, Nick Roberts and Nadav Shashar, for the useful discussions at the 2008 Heron Island Polarization Conference. Their insights into the potential relevance to animal vision come across in this paper. Yoav Schechner is a Landau Fellow - supported by the Taub Foundation. This work is supported by the Israel Science Foundation (Grant 1031/08) and the US-Israel Binational Science Foundation (BSF) Grant 2006384. This work was conducted in the Ollendorff Minerva Center. Minerva is funded through the BMBF. This work relates to Department of the Navy Grant N62909-10-1-4056 issued by the office of Naval Research Global. The United States Government has a royalty-free license throughout the world in all copyrightable material contained herein.
Endnotes
One contribution of 20 to a Theme Issue ‘New directions in biological research on polarized light’.
The increase in the intensity (variance) of the noise is not only relative to the signal S. Rather, the absolute level of the noise intensity increases with B, owing to equations (2.2) and (2.3).
Semi-reflections are also created by plastic windows. However, transparent plastic materials are more prone than glass to the photoelastic effect [33]. In this effect, stress in the transparent material changes the polarization of light propagating inside the window. This may confuse polarization-based methods for separation of semi-reflections.
These are not the coefficients r⊥ and r|| used in §4a. The relation between any r and its corresponding R will become clear in the following discussion.
These are not the coefficients t⊥ and t|| used in §4a, since t⊥ and t|| express the overall transmittance of light through the combined effect of both window interfaces.
Note that if d ≈ 0 (thin window), the scene and model analysed in this section degenerate to those discussed in §4a. Specifically, if d = 0, equation (4.3) degenerates to hT|| = t|| δ (x), where t|| is a transmittance used in §4a. In other words, t|| = T||2(1 + R||2 + R||4 …). Similarly, the other coefficients {t⊥, r||, r⊥} used in §4a are obtained by using d = 0 in hT⊥ , hR|| and hR⊥, respectively.
References
- 1.Fischer L., Zvyagin A., Plakhotnik T., Vorobyev M. 2010. Numerical modeling of light propagation in a hexagonal array of dielectric cylinders. J. Opt. Soc. Am. A 27, 865–872 10.1364/JOSAA.27.000865 (doi:10.1364/JOSAA.27.000865) [DOI] [PubMed] [Google Scholar]
- 2.Kleinlogel S., Marshall N. J. 2009. Ultraviolet polarisation sensitivity in the stomatopod crustacean Odontodactylus scyllarus. J. Comp. Physiol. A 195, 1153–1162 10.1007/s00359-009-0491-y (doi:10.1007/s00359-009-0491-y) [DOI] [PMC free article] [PubMed] [Google Scholar]
- 3.Cronin T. W., Shashar N., Caldwell R. L., Marshall J., Cheroske A. G., Chiou T. H. 2003. Polarization vision and its role in biological signaling. Integr. Comp. Biol. 43, 549–558 10.1093/icb/43.4.549 (doi:10.1093/icb/43.4.549) [DOI] [PubMed] [Google Scholar]
- 4.Horväth G., Varjú D. 2004. Polarized light in animal vision. Berlin, Germany: Springer [Google Scholar]
- 5.Johnsen S. 2000. Transparent animals. Sci. Am. 282, 80–89 10.1038/scientificamerican0200-80 (doi:10.1038/scientificamerican0200-80) [DOI] [PubMed] [Google Scholar]
- 6.Lythgoe J. N. 1972. The adaptation of visual pigments to the photic environment. In Handbook of sensory physiology, VII/1 (ed. Dartnall H. J. A.), pp. 566–603 Berlin, Germany: Springer [Google Scholar]
- 7.Mäthger L. M., Shashar N., Hanlon R. T. 2009. Do cephalopods communicate using polarized light reflections from their skin? J. Environ. Biol. 212, 2133–2140 10.1242/jeb.020800 (doi:10.1242/jeb.020800) [DOI] [PubMed] [Google Scholar]
- 8.Michinomae M., Masuda H., Seidou M., Kito Y. 1994. Structural basis for wavelength discrimination in the banked retina of the firefly squid Watasenia scintillans. J. Environ. Biol. 193, 1–12 [DOI] [PubMed] [Google Scholar]
- 9.Parkyn D. C., Austin J. D., Hawryshyn C. W. 2003. Acquisition of polarized-light orientation in salmonids under laboratory conditions. Anim. Behav. 65, 893–904 10.1006/anbe.2003.2136 (doi:10.1006/anbe.2003.2136) [DOI] [Google Scholar]
- 10.Roberts N. W., Chiou T.-H., Marshall N. J., Cronin T. W. 2009. A biological quarter-wave retarder with excellent achromaticity in the visible wavelength region. Nat. Photon. 3, 641–644 10.1038/nphoton.2009.189 (doi:10.1038/nphoton.2009.189) [DOI] [Google Scholar]
- 11.Roberts N. W., Gleeson H. F., Temple S. E, Haimberger T. J., Hawryshyn C. W. 2004. Differences in the optical properties of vertebrate photoreceptor classes leading to axial polarization sensitivity. J. Opt. Soc. Am. A 21, 335–345 10.1364/JOSAA.21.000335 (doi:10.1364/JOSAA.21.000335) [DOI] [PubMed] [Google Scholar]
- 12.Roberts N. W., Needham M. G. 2007. A mechanism of polarized light sensitivity in cone photoreceptors of the goldfish Carassius auratus. Biophys. J. 93, 3241–3248 10.1529/biophysj.107.112292 (doi:10.1529/biophysj.107.112292) [DOI] [PMC free article] [PubMed] [Google Scholar]
- 13.Sabbah S., Lerner A., Erlick C., Shashar N. 2005. Under water polarization vision—a physical examination. Recent Res. Dev. Exp. Theor. Biol. 1, 1–53 [Google Scholar]
- 14.Shashar N., Cronin T. W. 1996. Polarization contrast vision in octopus. J. Environ. Biol. 199, 999–1004 [DOI] [PubMed] [Google Scholar]
- 15.Waterman T. H. 1981. Polarization sensitivity. In Handbook of sensory physiology, VII/6B (ed. Dartnall H. J. A.), pp. 281–469 Berlin, Germany: Springer [Google Scholar]
- 16.Wehner R. 2001. Polarization vision—a uniform sensory capacity? J. Environ. Biol. 204, 2589–2596 [DOI] [PubMed] [Google Scholar]
- 17.Wolff L. B. 1997. Polarization vision: a new sensory approach to image understanding. Image Vis. Comp. 15, 81–93 10.1016/S0262-8856(96)01123-7 (doi:10.1016/S0262-8856(96)01123-7) [DOI] [Google Scholar]
- 18.Dacke M., Nilsson D.-E., Warrant E. J., Blest A. D., Land M. F., O'Carroll D. C. 1999. Built-in polarizers form part of a compass organ in spiders. Nature 401, 470–473 10.1038/46773 (doi:10.1038/46773) [DOI] [Google Scholar]
- 19.Kelber A., Thunell S., Arikawa K. 2001. Polarisation-dependent colour vision in papilio butterflies. J. Environ. Biol. 204, 2469–2480 [DOI] [PubMed] [Google Scholar]
- 20.Labhart T., Meyer E. P. 2002. Neural mechanisms in insect navigation: polarization compass and odometer. Curr. Opin. Neurobiol. 12, 707–714 10.1016/S0959-4388(02)00384-7 (doi:10.1016/S0959-4388(02)00384-7) [DOI] [PubMed] [Google Scholar]
- 21.Muheim R., Phillips J. B., Akesson S. 2006. Polarized light cues underlie compass calibration in migratory songbirds. Nature 313, 837–839 [DOI] [PubMed] [Google Scholar]
- 22.Sweeney A., Jiggins C., Johnsen S. 2003. Insect communication: polarized light as a butterfly mating signal. Nature 423, 31–32 10.1038/423031a (doi:10.1038/423031a) [DOI] [PubMed] [Google Scholar]
- 23.Chang P. C. Y., Flitton J. C., Hopcraft K. I., Jakeman E., Jordan D. L., Walker J. G. 2003. Improving visibility depth in passive underwater imaging by use of polarization. Appl. Opt. 42, 2794–2802 10.1364/AO.42.002794 (doi:10.1364/AO.42.002794) [DOI] [PubMed] [Google Scholar]
- 24.Denes L. J., Gottlieb M., Kaminsky B., Metes P. 1999. AOTF polarization difference imaging. Proc. SPIE 3584, 106–115 10.1117/12.339812 (doi:10.1117/12.339812) [DOI] [Google Scholar]
- 25.Harsdorf S., Reuter R., Töneön S. 1999. Contrast-enhanced optical imaging of submersible targets. Proc. SPIE 3821, 378–383 10.1117/12.364201 (doi:10.1117/12.364201) [DOI] [Google Scholar]
- 26.Rowe M. P., Pugh E. N., Jr, Tyo J. S., Engheta N. 1995. Polarization-difference imaging: a biologically inspired technique for observation through scattering media. Opt. Lett. 20, 608–610 10.1364/OL.20.000608 (doi:10.1364/OL.20.000608) [DOI] [PubMed] [Google Scholar]
- 27.Taylor J. S., Jr, Wolff L. B. 2001. Partial polarization signature results from the field testing of the shallow water real-time imaging polarimeter (SHRIMP). Proc. MTS/IEEE Oceans 1, 107–116 [Google Scholar]
- 28.Können G. P. 1985. Polarized light in nature. New York, NY: Cambridge University Press [Google Scholar]
- 29.Lythgoe J. N., Hemmings C. C. 1967. Polarized light and underwater vision. Nature 213, 893–894 10.1038/213893a0 (doi:10.1038/213893a0) [DOI] [PubMed] [Google Scholar]
- 30.Gupta M., Narasimhan S. G., Schechner Y. Y. 2008. On controlling light transport in poor visibility environments. Proc. IEEE Conf. on Computer Vision and Pattern Recognition, Anchorage, AK, 23–28 June 2008. [Google Scholar]
- 31.Kaftory R., Schechner Y. Y., Zeevi Y. Y. 2007. Variational distance dependent image restoration. Proc. IEEE Conf. on Computer Vision and Pattern Recognition, Minneapolis, MN, 17–22 June 2007. [Google Scholar]
- 32.Namer E., Shwartz S., Schechner Y. Y. 2009. Skyless polarimetric calibration and visibility enhancement. Opt. Exp. 17, 472–493 10.1364/OE.17.000472 (doi:10.1364/OE.17.000472) [DOI] [PubMed] [Google Scholar]
- 33.Schechner Y. Y., Karpel N. 2005. Recovery of underwater visibility and structure by polarization analysis. IEEE J. Ocean. Eng. 30, 570–587 [Google Scholar]
- 34.Schechner Y. Y., Narasimhan S. G., Nayar S. K. 2003. Polarization-based vision through haze. Appl. Opt. 42, 511–525 10.1364/AO.42.000511 (doi:10.1364/AO.42.000511) [DOI] [PubMed] [Google Scholar]
- 35.Treibitz T., Schechner Y. Y. 2009. Active polarization descattering. IEEE Trans. Pattern Anal. Mach. Intell. 31, 385–399 10.1109/TPAMI.2008.85 (doi:10.1109/TPAMI.2008.85) [DOI] [PubMed] [Google Scholar]
- 36.Jerlov N. G. 1976. Marine optics. Amsterdam, The Netherlands: Elsevier [Google Scholar]
- 37.Shashar N., Hagan R., Boal J. G., Hanlon R. T. 2000. Cuttlefish use polarization sensitivity in predation on silvery fish. Vis. Res. 40, 71–75 10.1016/S0042-6989(99)00158-3 (doi:10.1016/S0042-6989(99)00158-3) [DOI] [PubMed] [Google Scholar]
- 38.Jaffe J. S. 1990. Computer modelling and the design of optimal underwater imaging systems. IEEE J. Ocean. Eng. 15, 101–111 [Google Scholar]
- 39.Lynch D. K., Livingston W. 2001. Color and light in nature, 2nd edn. Cambridge, UK: Cambridge University Press [Google Scholar]
- 40.Treibitz T., Schechner Y. Y. 2009. Recovery limits in pointwise degradation. Proc. IEEE Int. Conf. on Computational Photography, San Francisco, CA, 16–17 April 2009. [Google Scholar]
- 41.Inoué S., Spring K. R. 1997. Video microscopy, 2nd edn., ch. 6–8 New York, NY: Plenum Press [Google Scholar]
- 42.Barrett H. H., Swindell W. 1981. Radiological imaging, vol. 1 New York, NY: Academic Press [Google Scholar]
- 43.Ratner N., Schechner Y. Y., Goldberg F. 2007. Optimal multiplexed sensing: bounds, conditions and a graph theory link. Opt. Exp. 15, 17 072 – 17 092 10.1364/OE.15.017072 (doi:10.1364/OE.15.017072) [DOI] [PubMed] [Google Scholar]
- 44.Kattawar G. W., Rakovic M. J. 1999. Virtues of Mueller matrix imaging for underwater target detection. Appl. Opt. 38, 6431–6438 10.1364/AO.38.006431 (doi:10.1364/AO.38.006431) [DOI] [PubMed] [Google Scholar]
- 45.Treibitz T., Schechner Y. Y. 2009. Polarization: beneficial for visibility enhancement? Proc. IEEE Conf. on Computer Vision and Pattern Recognition, Miami, FL, 20–25 June 2009. [Google Scholar]
- 46.Sarafraz A., Negahdaripour S., Schechner Y. Y. 2009. Enhancing images in scattering media utilizing stereovision and polarization. Proc. IEEE Workshop on Applications of Computer Vision. [Google Scholar]
- 47.Schechner Y. Y., Averbuch Y. 2007. Regularized image recovery in scattering media. IEEE Trans. Pattern Anal. Mach. Intell. 29, 1655–1660 10.1109/TPAMI.2007.1141 (doi:10.1109/TPAMI.2007.1141) [DOI] [PubMed] [Google Scholar]
- 48.Rahmann S., Canterakis N. 2001. Reconstruction of specular surfaces using polarization imaging. Proc. IEEE Conf. on Computer Vision and Pattern Recognition, 149–155 [Google Scholar]
- 49.Miyazaki D., Ikeuchi K. 2007. Shape estimation of transparent objects by using inverse polarization ray tracing. IEEE Trans. Pattern Anal. Mach. Intell. 29, 2018–2029 10.1109/TPAMI.2007.1117 (doi:10.1109/TPAMI.2007.1117) [DOI] [PubMed] [Google Scholar]
- 50.Atkinson G. A., Hancock E. R. 2007. Shape estimation using polarization and shading from two views. IEEE Trans. Pattern Anal. Mach. Intell. 29, 2001–2017 10.1109/TPAMI.2007.1099 (doi:10.1109/TPAMI.2007.1099) [DOI] [PubMed] [Google Scholar]
- 51.Be'ery E., Yeredor A. 2008. Blind separation of superimposed shifted images using parameterized joint diagonalization. IEEE Trans. Image Process. 17, 340–353 10.1109/TIP.2007.915548 (doi:10.1109/TIP.2007.915548) [DOI] [PubMed] [Google Scholar]
- 52.Tsin Y., Kang S. B., Szeliski R. 2006. Stereo matching with linear superposition of layers. IEEE Trans. Pattern Anal. Mach. Intell. 28, 290–301 10.1109/TPAMI.2006.42 (doi:10.1109/TPAMI.2006.42) [DOI] [PubMed] [Google Scholar]
- 53.Farid H., Adelson E. H. 1999. Separating reflections from images by use of independent component analysis. J. Opt. Soc. Am. A 16, 2136–2145 10.1364/JOSAA.16.002136 (doi:10.1364/JOSAA.16.002136) [DOI] [PubMed] [Google Scholar]
- 54.Schechner Y. Y., Shamir J., Kiryati N. 2000. Polarization and statistical analysis of scenes containing a semi-reflector. J. Opt. Soc. Am. A 17, 276–284 10.1364/JOSAA.17.000276 (doi:10.1364/JOSAA.17.000276) [DOI] [PubMed] [Google Scholar]
- 55.Diamant Y., Schechner Y. Y. 2008. Overcoming visual reverberations. Proc. IEEE Conf. on Computer Vision and Pattern Recognition, Anchorage, AK, 23–28 June 2008. [Google Scholar]
- 56.Umeyama S., Godin G. 2004. Separation of diffuse and specular components of surface reflection by use of polarization and statistical analysis of images. IEEE Trans. Pattern Anal. Mach. Intell. 26, 639–647 10.1109/TPAMI.2004.1273960 (doi:10.1109/TPAMI.2004.1273960) [DOI] [PubMed] [Google Scholar]
- 57.Nayar S. K., Fang X., Boult T. 1997. Separation of reflection components using color and polarization. Int. J. Comput. Vis. 21, 163–186 10.1023/A:1007937815113 (doi:10.1023/A:1007937815113) [DOI] [Google Scholar]


