Abstract
Background
Pediatric trauma involving the bones of the face is associated with severe injury and disability. Although much is known about the epidemiology of facial fractures in adults, little is known about national injury patterns and outcomes in children in the US.
Study Design
The epidemiology of facial injuries in children and adolescents (ages 0 to 18 years) was described using the National Trauma Data Bank (2001 to 2005) to examine facial fracture pattern, mechanism, and concomitant injury by age.
Results
A total of 12,739 (4.6%) facial fractures were identified among 277,008 pediatric trauma patient admissions. The proportion of patients with facial fractures increased substantially with age. The most common facial fractures were mandible (32.7%), nasal (30.2%), and maxillary/zygoma (28.6%). The most common mechanisms of injury were motor vehicle collision (55.1%), violence (11.8%), and falls (8.6%). These fracture patterns and mechanisms of injury varied with age. Compared with patients without facial fractures, patients with fractures exhibited substantial injury severity, hospital lengths of stay, ICU lengths of stay, ventilator days, and hospital charges. In addition, patients with facial fractures had more severe associated injury to the head and chest and considerably higher overall mortality.
Conclusions
Causes and patterns of facial fractures vary with age. Cranial and central facial injuries are more common among toddlers and infants, and mandible injuries are more common among adolescents. Although bony craniofacial trauma is relatively uncommon among the pediatric population, it remains a substantial source of mortality, morbidity, and hospital resource use. Continued efforts toward injury prevention are warranted.
Trauma is the leading cause of morbidity and mortality in children, and injury remains the most common cause of death in children 1 year of age and older.1 Approximately 8.5 million injured children are evaluated annually in emergency rooms in the US.2 Although severe pediatric craniofacial injury is less common than in the adult population, head trauma remains the most common cause of injury death in the pediatric age group.1
Facial trauma is associated with the more severe injuries encountered at major trauma centers. An estimated 11.3% of pediatric emergency room visits overall are a result of craniofacial injuries.3 Not only are these injuries considerable management challenges to trauma and reconstructive surgeons, the subsequent functional and esthetic impact to the growing child and the economic and emotional burden to the patient and family can be overwhelming.4 Anatomic and developmental differences between pediatric patients and adults alter the diagnosis and management of injury.5-10 Overall, facial bone fractures are considerably less common in children than adults.11 This lower incidence partially reflects the underdeveloped facial skeleton and paranasal sinuses of preadolescent children leading to craniofacial disproportion and additional strength of the maxilla and mandible from unerupted dentition.8,9,12,13 In addition, concomitant intracranial and associated nonhead trauma can accompany craniofacial trauma in children more frequently than in adults.5,11
Despite the burden of injury among the pediatric population and distinct anatomic and physiologic differences from adults, the literature demonstrates wide variability in estimates for craniofacial trauma incidence, causes, gender distribution, facial fracture pattern, and concomitant injury.11 In addition, these pediatric maxillofacial trauma studies are limited to single institutional experiences, typically from small to moderately sized centers outside the US.10,11,13-23 The purpose of this study was to examine the epidemiology of bony craniofacial injury in children using a large multicenter, national trauma database.
Methods
After obtaining approval from the University of Washington Institutional Review Board, we performed an analysis of craniofacial injuries in pediatric patients—defined in this study as age 0 to 18 years—using the National Trauma Data Bank (NTDB) from 2001 to 2005 (version 6.2, copyright American College of Surgeons, 2007, http://www.facs.org/trauma/ntdb.html). The NTDB contains data on > 2 million patients treated as inpatients after trauma, as reported from > 600 US trauma centers. Each database admission record contains data on patient demographics, injury mechanism, injury-site characteristics, hospital characteristics, injuries, and hospital outcomes.
Specific craniofacial and associated injuries were identified by ICD-9 codes. Patients with facial fractures, identified with ICD-9 codes 800.0 to 804.5, constituted the facial fracture cohort. Operative intervention was determined using ICD-9 procedure codes for facial fracture fixation (ICD-9 procedure codes: 76.72 to 76.79). Analysis was performed using Centers for Disease Control cut-offs for pediatric age subgroups (0 to 1, 2 to 4, 5 to 9, 10 to 14, and 15 to 18 years) modified to account for changes in developmental activity level and maturation of the facial skeleton with increasing age.
Severity of associated injury was assessed using the 2005 version of the Abbreviated Injury Scale (AIS).24 The AIS divides injuries into body region, type of structure, nature, and severity. It uses nine body regions, including head, chest, abdomen, spine, neck, face, upper and lower extremity, and skin. Severity is coded as either 0 (no injury), 1 (minor), 2 (moderate), 3 (serious), 4 (severe), 5 (critical), or 6 (nonsurvivable injury). For the purpose of this study, body region—specific AIS ≥ 3 was used as a marker of severe injury.24 Overall injury severity was assessed using the Injury Severity Score (ISS). ISS is a summary score for traumatic injuries and is calculated as the sum of the square root of the three highest AIS scores:
ISS = (first of three highest AIS)2 + (second of three highest AIS)2 + (third of three highest AIS)2
Statistical analyses were performed using Microsoft Excel (2002; Microsoft Corporation) and SPSS for Windows (version 11.0; SPSS, Inc). Discrete variables were compared using Fisher's exact probability test, and continuous variables were compared using unpaired two-tailed t-test. In all cases, actual p values are reported. To characterize the patient and injury factors related to an increased risk for facial fractures, a multivariate binary logistic regression was conducted using the variables independently and significantly (p = 0.05) associated with facial fractures on univariate analysis.
Results
The records of 277,008 pediatric trauma patients (ages 0 to 18 years) were identified in the NTDB during the study period. This pediatric cohort represents 18.9% of the total population of almost 1.5 million injured patients. Among pediatric patients, 12,739 (4.6%) sustained facial fractures. Pediatric patients with facial fractures were slightly older and more likely to be male and Caucasian than patients without facial fractures (Table 1). Facial fracture patients were more likely to suffer from blunt injury and to be injured as a result of motor vehicle collision (MVC). Among patients involved in MVC, facial fracture patients were less likely to be restrained than those without fractures (27.3% versus 32.3%; p < 0.001). Using binary logistic regression analysis, MVC appears to double the risk of facial fractures compared with other mechanisms, and lack of appropriate restraints (either seat belts or child safety seats) also increases facial fracture risk by 16%. MVCs caused 29.9% (n = 82,685) of pediatric injuries reported in the NTDB, and only 31.9% were adequately restrained. More than 75% of pediatric motor vehicle fatalities were unrestrained (data not shown).
Table 1. Characteristics of Patients With and Without Facial Fractures among 277,008 Pediatric Trauma Patients.
| Characteristic | Facial fractures | No facial fractures | p Value |
|---|---|---|---|
| n | 12,739 | 264,269 | |
| Age (y), mean ± SD | 12.6 ± 5.5 | 10.2 ± 6.0 | < 0.001 |
| Male (%) | 68.6 | 65.7 | < 0.001 |
| Caucasian (%) | 62.2 | 59.1 | < 0.001 |
| Blunt (%) | 95.0 | 84.8 | < 0.001 |
| Mechanism (%) | < 0.001 | ||
| MVC | 55.1 | 35.4 | |
| Fight/assault | 11.8 | 3.5 | |
| Fall | 8.6 | 26.1 | |
| Pedestrian | 7.5 | 7.7 | |
| Bicycle | 7.2 | 6.6 | |
| Weapon | 2.7 | 3.5 | |
| Bite | 1.5 | 1.5 | |
| MVC restrained | 27.3 | 32.2 | < 0.001 |
| Region (%) | < 0.001 | ||
| South | 30.9 | 37.2 | |
| Midwest | 27.1 | 29.1 | |
| West | 18.9 | 16.5 | |
| Northeast | 7.0 | 7.1 | |
| Not reported | 16.1 | 10.1 |
MVC, motor vehicle collision.
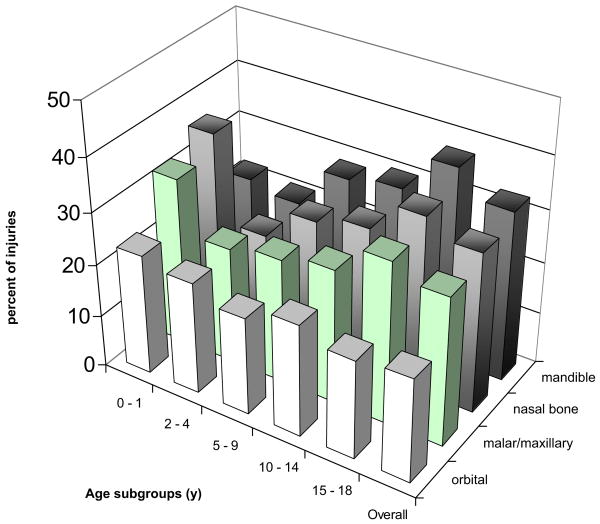
Among the overall pediatric trauma cohort (n = 277,008), the proportion of patients with facial fractures increased steadily with age (Fig. 1), with the lowest proportion observed among infants and toddlers (2.4%) and the highest among older teens (6.9%; p < 0.001). The most common bones fractured were mandible (32.7%), nasal (30.2%), and maxillary/zygoma (28.6%) (Fig. 2). Nasal and maxillary fractures were most common among infants (ages 0 to 1 year); and mandible fractures were most common among teenagers (15 to 18 years). Among all patients with mandible fractures (n = 4,169), symphysis, angle, and body were the most common individual fractures (Fig. 3). A total of 25% of patients suffering facial fractures underwent operative fixation during their initial trauma hospital admission. The proportion requiring fracture fixation appeared to increase with age, with a nadir of 11% among toddlers ages 2 to 4 years (Fig. 4).
Figure 1.
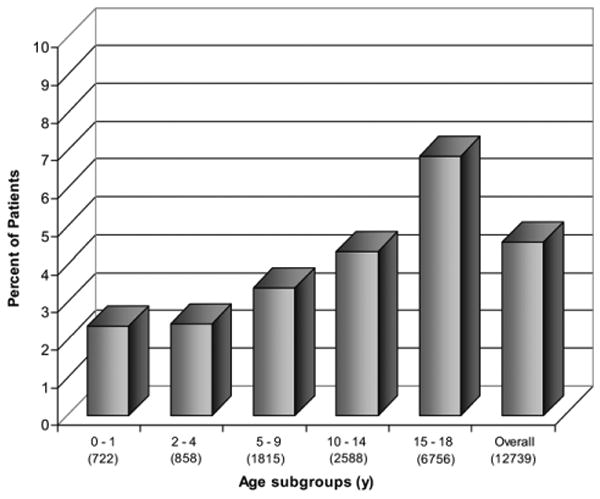
The percentage of all pediatric patients admitted after trauma (n = 277,008) with facial fractures by age group. Total number of patients in each age subgroup is reported in parentheses.
Figure 2.
Fracture type among all pediatric facial fractures (n = 12,739) by percentage of age group. Diagnosis of facial fracture subgroup made by ICD-9 classification.
Figure 3.
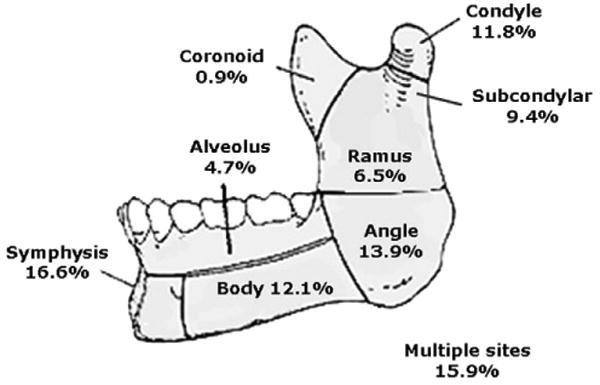
Fracture location among 4,169 pediatric patients with mandible fractures (ages 0 to 18 years).
Figure 4.
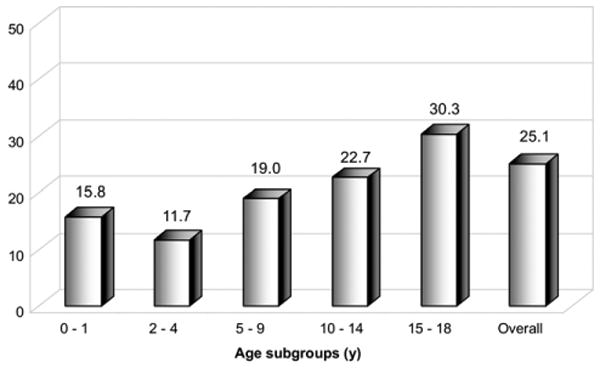
Percentage of pediatric facial fracture patients (n = 12,739) who underwent operative treatment during their initial hospital admission, by age group. Percent values in each age group are depicted.
MVC (55.1%), assault (14.5%), and falls (8.6%) were the most common mechanisms for facial fracture in all pediatric age groups (Fig. 5). The second most common cause of bony facial injury varied with age. Fall was the second most common mechanism (23.4%) among infants and toddlers (0 to 4 years). Bicycle-related collisions and pedestrians struck by motor vehicles were the second most common mechanisms for school-aged children (5 to 14 years). For older teenagers (15 to 18 years), the second most common mechanism was a fight or an assault (21.7%).
Figure 5.
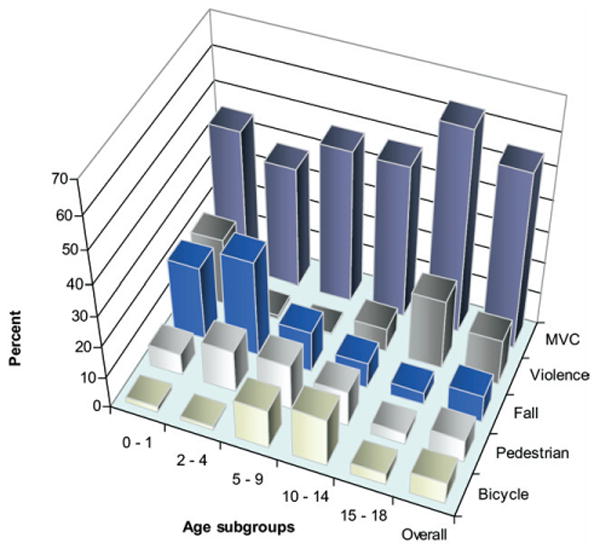
Mechanism of injury of pediatric patients with facial fractures (n = 12,739) by percentage of age group. MVC, motor vehicle collision.
Patients with bony facial injuries had a mean ISS that was almost twice that of patients without facial fractures (Table 2). In addition, the facial fracture cohort had 3 times the ICU length of stay (2.9 ± 5.8 days versus 0.9 ± 5.3; p < 0.001) and almost twice the hospital length of stay (5.9 ± 9.6 days versus 3.4 ± 7.9; p < 0.001), significantly more ventilator days (1.8 ± 5.0 days versus 0.1 ± 6.3; p < 0.001), and significantly higher hospital charges ($22,839 ± $21,807 versus $11,405 ± $15,523; p < 0.001). Although overall mortality was low, facial fractures were associated with a 63% higher mortality rate (4.0% versus 2.5%; p < 0.001).
Table 2. Injury Severity and Hospital Outcomes among 277,008 Pediatric Trauma Patients With and Without Facial Fractures.
| Variable | Facial fractures | No facial fractures | p Value |
|---|---|---|---|
| n | 12,739 | 264,269 | |
| ISS | 14.6 ± 11.8 | 7.9 ± 9.1 | < 0.001 |
| Admitted to the ICU (%) | 32.0 | 17.9 | < 0.001 |
| Hospital LOS (d) | 5.9 ± 9.6 | 3.4 ± 7.9 | < 0.001 |
| ICU LOS (d) | 2.9 ± 5.8 | 0.9 ± 5.3 | < 0.001 |
| Ventilator days | 1.8 ± 5.0 | 0.1 ± 6.3 | < 0.001 |
| Hospital charges ($) | 22,839 ± 21,807 | 11,405 ± 15,523 | < 0.001 |
| Mortality (%) | 4.0 | 2.5 | < 0.001 |
Continuous variables are presented as mean ± SD.
ISS, Injury Severity Score; LOS, length of stay.
Severe associated injury among pediatric patients with facial fractures was common (Table 3). Associated facial soft tissue injuries were observed in almost half of patients (45.9%), which was 5 times more common than in patients without facial fractures (9.9%). Concomitant brain injury (32.3%) was twice as common among patients with facial fractures than those without fractures. Similarly, severe organ-specific injury, defined by AIS ≥ 3 to the head and chest, was observed twice as frequently in facial fracture patients. Fractures to the skull base were observed in almost a third of patients (27.3%), ninefold higher than in children without facial fracture (3.3%). Cervical spine fracture (3.3% versus 1.3%; p < 0.001) and blunt cerebrovascular injury (1.0% versus 0.2%; p < 0.001) occurred rarely, but their prevalence was considerably higher among facial fracture patients than those without facial fracture.
Table 3. Associated Injuries Observed among 277,008 Pediatric Trauma Patients With and Without Facial Fractures.
| Variable | Facial fractures | No facial fractures | p Value |
|---|---|---|---|
| n | 12,739 | 264,269 | |
| Head AIS ≥ 3 | 20.9 | 9.2 | < 0.001 |
| Chest AIS ≥ 3 | 8.9 | 4.8 | < 0.001 |
| LEAIS ≥ 3 | 5.4 | 6.4 | < 0.001 |
| Face AIS ≥ 3 | 4.9 | 0.2 | < 0.001 |
| Abd AIS ≥ 3 | 2.4 | 2.8 | 0.220 |
| UE AIS ≥ 3 | 1.9 | 3.7 | < 0.001 |
| Neck AIS ≥ 3 | 0.3 | 0.1 | < 0.001 |
| Spine AIS ≥ 3 | 0.1 | 1.0 | 0.630 |
| Facial soft tissue injury | 45.9 | 9.9 | < 0.001 |
| Brain injury | 32.3 | 17.0 | < 0.001 |
| Skull base fracture | 27.7 | 3.3 | < 0.001 |
| Cranial vault fracture | 13.1 | 3.4 | < 0.001 |
| Ocular injury | 7.2 | 0.9 | < 0.001 |
| Cervical fracture | 3.3 | 1.3 | < 0.001 |
| Open globe injury | 1.7 | 0.4 | < 0.001 |
| Injury to blood vessels of H&N | 1.0 | 0.2 | < 0.001 |
Values are percentages, except n.
Abd, abdomen; AIS, Abbreviated Injury Scale; H&N, head and neck; LE, lower extremity; UE, upper extremity.
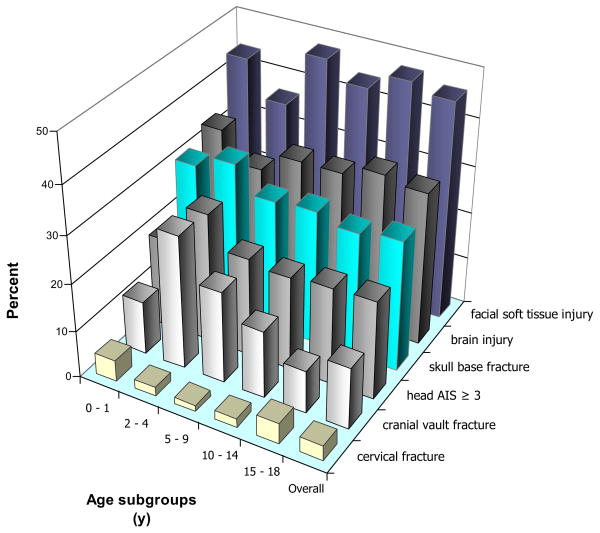
Occurrence of concomitant injury correlated with patient age (Fig. 6). Although adolescents and older teens had a higher incidence of any brain injury (p < 0.001), infants and toddlers (0 to 4 years) had a significantly higher incidence of cranial vault fractures (p < 0.001) and severe head injury (head AIS ≥ 3; p < 0.001). Cervical spine fracture overall was only observed in 1.4%; but a peak of 1.1% was seen among infants (0 to 1 year) and among 2.6% of older teens (15 to 18 years).
Figure 6.
Associated injuries among 12,739 pediatric patients with facial fractures by percentage of age group. AIS, Abbreviated Injury Scale.
Discussion
Despite the attention facial injuries have received in the literature, the epidemiology of these injuries is not well characterized in children. A recent review of the existing pediatric craniofacial trauma literature demonstrates wide variation in the point estimates for injury incidence, mechanism, pattern, and associated injury.11 In addition, the majority of clinical series are single-center studies from institutions outside of the US and, although some include large series of patients, these studies require an extended period of time to collect and are often presented by only one treating discipline.11,13-15,17,19,20
In this study, we describe the epidemiology of craniofacial injury in children who were admitted after trauma to participating institutions in the NTDB. Although facial fractures among traumatically injured admitted pediatric patients were relatively rare (4.6%), bony facial injuries were associated with substantial morbidity. Patients with facial fractures were more seriously injured, with almost twice the mean ISS of patients without facial fractures. Similarly, the facial fracture cohort had three times the ICU length of stay and almost twice the hospital length of stay, ventilator days, and hospital charges. In addition, facial fractures were associated with a 63% higher mortality rate. We attribute this increase in injury severity among facial fracture patients to the concomitant high incidence of severe head injuries.
The percentage of patients with facial fractures increased steadily with age. Similar to previous reports, mandible fracture was the most common fracture subtype overall.14,15,17,18,22,23 Mandible fractures occurred most frequently in adolescents and older teens (ages 10 to 18 years) but was observed less frequently among infants and toddlers (ages 0 to 4 years). This lower prevalence of mandible fractures in the youngest age groups is likely a result of increased relative strength of the immature mandible because of unerupted dentition,11,25 the protective relative micrognathia in these young children, and the difference in the mechanism of injury between age groups. Backseat MVC and falls are the most common mechanisms of injury in the pretoddler ages, both of which would predispose more to central face blunt injury than peripheral mandible injury. This was seen with the relative increase in nasal and maxillary fractures in this age group compared with mandible fractures. Finally, when compared with adolescents, younger children have a more prominent frontal projection of the cranium. Consequently, young children have a greater chance of sustaining skull fractures from frontal impact mechanisms, and older teens, with cranial-to-facial proportions that approximate adults, have a higher probability of facial bone fracture. Our data demonstrate this trend, with a steady decline in cranial vault fractures with advancing age (Fig. 6).
Compared with previous reports, only 25.1% of pediatric patients admitted after facial fractures underwent operative fixation. Operative fixation during initial hospital admission seemed to increase with age, with the oldest pediatric age subgroup, ages 14 to 18 years old, being most commonly treated with operative fixation (30.3%). This difference in age-related operative fixation of fractures might reflect differences in displacement of fractures because of higher-velocity trauma in older children, increased indications for nonoperative treatment in young children because of their augmented healing and remodeling capacity, or the perception that operative treatment in the immature skeleton can impair future growth. Of note, the NTDB contains only data about the management of patients during their initial hospitalization after injury. It does not track patients if they are discharged and subsequently return for later operative fixation of their fractures. Patients who underwent operative treatment were more likely to have severe enough facial injuries to require treatment before discharge or were hospitalized for associated injuries long enough that discharge followed by elective fracture treatment did not occur.
As expected, MVC was the most common cause of facial fractures across the pediatric group. We found that MVC doubles one's risk for facial fractures compared with other mechanisms, and lack of appropriate restraints (either seat belts or child safety seats) also increases facial fracture risk by 16% (data not shown). MVCs caused 29.9% (n = 82,685) of pediatric injuries reported in the NTDB, and only 31.9% of these injured children were adequately restrained. More than 75% of pediatric motor vehicle fatalities were unrestrained (data not shown). These results are consistent with data from the National Highway Traffic Safety Administration in which nearly half of all children killed in MVCs in 2005 were unrestrained; child safety seats reduce the risk of death in passenger cars by 71% for infants and by 54% for toddlers ages 1 to 4 years.26-28 For these reasons, the National Highway Traffic Safety Administration recommends child safety seats for all children younger than 8 years old or < 57 inches tall.26 Our data, demonstrating the high proportion of severe concomitant injury, illustrate the importance of proper restraint use and future research into accident prevention (Table 3).
The second most common causes of facial fractures parallels developmental milestones, with falls and pedestrians struck by motor vehicles predominant in young children, bicycle-related crashes in school-aged children, and injuries as a result of violence were most common among older teens (Fig. 5). Sports-related mechanisms were relatively rare (2.9% of all facial fractures). This is likely because the NTDB includes only those patients admitted after trauma; those patients assessed in an ambulatory setting and treated electively are not included in this data set.
This is the first study to present national trends in pediatric facial fracture subtypes, mechanism, fracture treatment, hospital outcomes, and associated injuries. We used the NTDB to analyze injury patterns in this subgroup of trauma patients. Despite the large population of trauma patients in the NTDB, there are several limitations to its use. The NTDB is a compilation of data that is submitted voluntarily from a disproportionate number of larger hospitals with younger and more severely injured patients, and it is not a population-based sample of hospitalized patients. Patients not admitted to the hospital after trauma will not be included in the NTDB, including injury victims who die before transport to the hospitals and patients who are evaluated and managed as outpatients. The earlier two issues would bias our study population to reflect more severely injured patients and fail to account for those facial fractures managed as outpatients. Results of this study are applicable to a pediatric patient admitted to the hospital in the US after trauma and are not meant to represent all pediatric facial injuries in the population.
Fracture subtypes and associated injuries were broadly identified by ICD-9 codes. Our diagnosis of specific fractures was dependent on inclusion of ICD-9 codes by coders at each trauma center that submits information. This method does not allow characterization of detailed fracture anatomy with the level of resolution crucial to surgeons who treat craniofacial injuries. For example, there are no ICD-9 codes for frontal sinus fractures, Le Fort fractures, or naso-orbital-ethmoid complex fractures, which are accompanied with specific operative and management challenges. In addition, little information could be gleaned about complications of fracture management in this data set. Comorbidities are not reported in the NTDB; but we would expect substantial concomitant disease to be rare in the traumatically injured child.
One of the benefits of using the NTDB for examining pediatric craniofacial injuries was the inclusion of a large number of patients in a relatively short study period of 5 years. The shorter study duration allows more accurate conclusions to be made about injury incidence and mechanism, because changes in risk profile or safety regulations for various age subgroups are unlikely to occur during the study period (eg, institution of laws requiring child safety car seats or bicycle helmets). Because of the selection criteria of the NTDB, results of this study are applicable to the subgroup of patients with severe enough facial or associated injuries to require hospital admission during their initial trauma evaluation. This group represents those pediatric facial trauma patients who currently use the most healthcare resources and represent the highest health burden on the population in the US.
Trauma is a leading cause of injury and death among the pediatric population. Despite the fact that facial fractures are relatively rare among this population, they are associated with increased mortality, morbidity, and hospital charges. Clinicians must remain vigilant to associated severe injuries, particularly to the head and chest, that accompany bony facial injury. There is a pattern of facial fractures by age that is influenced by trends in mechanism of injury and facial development. Cranial and central facial injuries are more common in toddlers and infants, and mandible injuries are more common in adolescents and beyond. Although a large proportion of patients with facial fractures involved in MVCs were restrained, severe associated injury is not uncommon, illustrating the importance of proper restraint use and future research into accident prevention.
Acknowledgments
This work was supported in part by funding from the NIH National Center for Research Resources (Grant No. 1KL2RR025015-01).
Abbreviations and Acronyms
- AIS
Abbreviated Injury Scale
- ISS
Injury Severity Score
- MVC
motor vehicle collision
- NTDB
National Trauma Data Bank
Footnotes
Author Contributions
Study conception and design: Imahara, Hopper, Klein
Acquisition of data: Imahara, Wang, Klein
Analysis and interpretation of data: Imahara, Hopper, Wang, Rivara, Klein
Drafting of manuscript: Imahara, Hopper, Rivara, Klein
Critical revision: Imahara, Hopper, Wang, Rivara, Klein
Disclosure Information: Nothing to disclose.
References
- 1.10 Leading Causes of Death, US. Atlanta, GA: Center for Disease Control and Prevention, National Center for Injury Prevention and Control; 2004. [Google Scholar]
- 2.Nawar EW, Niska RW, Xu J. National Hospital Ambulatory Medical Care Survey: 2005 Emergency Department Survey. Atlanta, GA: Center for Disease Control and Prevention, National Center for Health Statistics; 2007. [Google Scholar]
- 3.National Hospital Ambulatory Medical Care Survey (NHAMCS) Atlanta, GA: Center for Disease Control and Prevention, National Center for Health Statistics; 1999. [Google Scholar]
- 4.Dufresne C, Manson P. Plastic surgery. 2nd. Philadelphia: Elsevier; 2006. Pediatric facial injuries; pp. 381–462. [Google Scholar]
- 5.Parks S, Kaufmann C, editors. Advanced trauma life support. Chicago: American College of Surgeons; 2004. pp. 243–262. [Google Scholar]
- 6.d'Amato C. Pediatric spinal trauma: injuries in very young children. Clin Orthop Relat Res. 2005;432:34–40. [PubMed] [Google Scholar]
- 7.Pang DE, Wilberger JE., Jr Spinal cord injury without radiographic abnormalities in children. J Neurosurg. 1982;57:114–129. doi: 10.3171/jns.1982.57.1.0114. [DOI] [PubMed] [Google Scholar]
- 8.Koltai PJ, Rabkin D. Management of facial trauma in children. Pediatr Clin North Am. 1996;43:1253–1275. doi: 10.1016/s0031-3955(05)70518-6. [DOI] [PubMed] [Google Scholar]
- 9.Kaban LB. Diagnosis and treatment of fractures of the facial bones in children 1943–1993. J Oral Maxillofac Surg. 1993;51:722–729. doi: 10.1016/s0278-2391(10)80409-4. [DOI] [PubMed] [Google Scholar]
- 10.Singh DJ, Bartlett SP. Pediatric craniofacial fractures: long-term consequences. Clin Plast Surg. 2004;31:499–518. vii. doi: 10.1016/j.cps.2004.03.012. [DOI] [PubMed] [Google Scholar]
- 11.Haug RH, Foss J. Maxillofacial injuries in the pediatric patient. Oral Surg Oral Med Oral Pathol Oral Radiol Endod. 2000;90:126–134. doi: 10.1067/moe.2000.107974. [DOI] [PubMed] [Google Scholar]
- 12.McGraw BL, Cole RR. Pediatric maxillofacial trauma. Age-related variations in injury. Arch Otolaryngol Head Neck Surg. 1990;116:41–45. doi: 10.1001/archotol.1990.01870010045014. [DOI] [PubMed] [Google Scholar]
- 13.Oji C. Fractures of the facial skeleton in children: a survey of patients under the age of 11 years. J Craniomaxillofac Surg. 1998;26:322–325. doi: 10.1016/s1010-5182(98)80062-0. [DOI] [PubMed] [Google Scholar]
- 14.Gassner R, Tuli T, Hachl O, et al. Craniomaxillofacial trauma in children: a review of 3,385 cases with 6,060 injuries in 10 years. J Oral Maxillofac Surg. 2004;62:399–407. doi: 10.1016/j.joms.2003.05.013. [DOI] [PubMed] [Google Scholar]
- 15.Iida S, Matsuya T. Paediatric maxillofacial fractures: their aetiological characters and fracture patterns. J Craniomaxillofac Surg. 2002;30:237–241. doi: 10.1054/jcms.2002.0295. [DOI] [PubMed] [Google Scholar]
- 16.Shaikh ZS, Worrall SF. Epidemiology of facial trauma in a sample of patients aged 1–18 years. Injury. 2002;33:669–671. doi: 10.1016/s0020-1383(01)00201-7. [DOI] [PubMed] [Google Scholar]
- 17.Zerfowski M, Bremerich A. Facial trauma in children and adolescents. Clin Oral Investig. 1998;2:120–124. doi: 10.1007/s007840050056. [DOI] [PubMed] [Google Scholar]
- 18.Ferreira PC, Amarante JM, Silva PN, et al. Retrospective study of 1251 maxillofacial fractures in children and adolescents. Plast Reconstr Surg. 2005;115:1500–1508. doi: 10.1097/01.prs.0000160268.20294.fd. [DOI] [PubMed] [Google Scholar]
- 19.Spring PM, Cote DN. Pediatric maxillofacial fractures. J LA State Med Soc. 1996;148:199–203. [PubMed] [Google Scholar]
- 20.Uji T, Teramoto T. Occurrence of traumatic injuries in the oromaxillary region of children in a Japanese prefecture. Endod Dent Traumatol. 1988;4:63–69. doi: 10.1111/j.1600-9657.1988.tb00296.x. [DOI] [PubMed] [Google Scholar]
- 21.Holland AJ, Broome C, Steinberg A, Cass DT. Facial fractures in children. Pediatr Emerg Care. 2001;17:157–160. doi: 10.1097/00006565-200106000-00002. [DOI] [PubMed] [Google Scholar]
- 22.Ogunlewe MO, James O, Ladeinde AL, Adeyemo WL. Pattern of paediatric maxillofacial fractures in Lagos, Nigeria. Int J Paediatr Dent. 2006;16:358–362. doi: 10.1111/j.1365-263X.2006.00757.x. [DOI] [PubMed] [Google Scholar]
- 23.Bamjee Y, Lownie JF, Cleaton-Jones PE, Lownie MA. Maxillofacial injuries in a group of South Africans under 18 years of age. Br J Oral Maxillofac Surg. 1996;34:298–302. doi: 10.1016/s0266-4356(96)90006-6. [DOI] [PubMed] [Google Scholar]
- 24.The Abbreviated Injury Scale. Barrington, IL: Association for the Advancement of Automotive Medicine; 2005. [Google Scholar]
- 25.Oji C. Fractures of the facial skeleton in children: a survey of patients under the age of 11 years. J Craniomaxillofac Surg. 1998;26:322–325. doi: 10.1016/s1010-5182(98)80062-0. [DOI] [PubMed] [Google Scholar]
- 26.Department of Transportation National Highway Traffic Safety Administration. Traffic safety facts 2005: children. Washington, DC: National Highway Traffic Safety Administration; 2006. [Google Scholar]
- 27.Durbin DR, Elliott MR, Winston FK. Belt-positioning booster seats and reduction in risk of injury among children in vehicle crashes. JAMA. 2003;289:2835–2840. doi: 10.1001/jama.289.21.2835. [DOI] [PubMed] [Google Scholar]
- 28.Durbin DR, Chen I, Smith R, et al. Effects of seating position and appropriate restraint use on the risk of injury to children in motor vehicle crashes. Pediatrics. 2005;115:e305–e309. doi: 10.1542/peds.2004-1522. [DOI] [PubMed] [Google Scholar]


