Abstract
Members of the nuclear receptor superfamily differentiate in terms of specificity for DNA recognition and binding, oligomeric state, and ligand binding. The wide range of specificities are impressive given the high degree of sequence conservation in the DNA binding domain (DBD) and moderate sequence conservation with high structural similarity within the ligand binding domains (LBDs). Determining sequence positions that are conserved within nuclear receptor subfamilies can provide important indicators into the structural dynamics that translate to oligomeric state of the active receptor, DNA binding specificity and ligand affinity and selectivity. Here we present a method to analyze sequence data from all nuclear receptors that facilitates detection of co-evolving pairs using Mutual Information (MI). Using this method we demonstrate that MI can reveal functionally important sequence positions within the superfamily and the approach identified three sequence positions that have conserved sequence patterns across all nuclear receptors and subfamilies. Interestingly, two of the sequence positions identified are located within the DBD CII and the third was within Helix c of the DBD. These sequences are located within the heterodimer interface of PPARγ (CII) and RXRα (Helix c) based on PDB:3DZU. Helix c of PPARγ, which is not involved in the DBD dimer interface, binds the minor groove in the 5' flanking region in a consensus PPARγ response element (PPRE) and the corresponding RXRα (CII) is found in the 3' flanking region of RXRE (3DZU). As these three sequence positions represent unique identifiers for all nuclear receptors and they are located within the dimer interface of PPARγ-RXRα DBD (3DZU) interfacing with the flanking regions of the NRRE, we conclude they are critical sequence positions perhaps dictating nuclear receptor (NR) DNA binding specificity.
Introduction
NRs are multi-domain ligand-dependent transcription factors that contain zinc finger DBDs and they bind to DNA as either monomers, homodimers, or heterodimers, typically upstream of proximal promoter regions of target genes at specific nucleotide sequences referred to as nuclear receptor response elements (NRREs) [Desvergne and Wahli, 1999]. With few exceptions, NRs consist of a N-terminal domain, a highly conserved DNA binding domain (DBD), a hinge domain connecting the DBD to the LBD, a ligand binding domain (LBD) and several have C-terminal extensions referred to as F domains [Robinson-Rechavi et al., 2003]. While the DBDs are highly conserved across all NRs, mutations within this domain allow specificity for NR binding across the genome. The LBD region is structurally-conserved, yet is only moderately conserved on the sequence level, perhaps allowing this protein family to bind and respond to a wide range of endogenous ligands such as hormones, sterols, and fatty acids. Ligand binding results in changes in LBD conformational dynamics facilitating recruitment or displacement of coregulatory chromatin remodeling proteins that in turn impact transcriptional output of target genes.
Sequence analysis within the ligand binding domain [Wurtz et al., 1996] using LBDs from 86 NRs identified twenty sequence positions that constitute a signature for classifying a protein as a NR. In this study, structural homology and clustalw were used to construct the multiple sequence alignment (MSA) and key sequence positions were identified by proximity to the ligand-binding pocket. With a significantly larger collection of NR sequences now available and the high quality MSA that can be provided by PFAM, here we apply mutual information (MI) to detect co-evolving pairs to reveal functional relationships that represent distinct NR signatures capable of classifying NR subfamilies. In the study presented here, we analyzed sequence data from 2094 putative nuclear receptors across all species to determine co-evolving sequence positions that are conserved within the superfamily. We limited our analysis to the MSA found in PFAM families PF00105 (DBD) and PF00104 (LBD). Using this approach to detect co-evolving amino acid pair relationships, we identified three sequence positions within the DBD that are conserved across the NR superfamily.
Methods
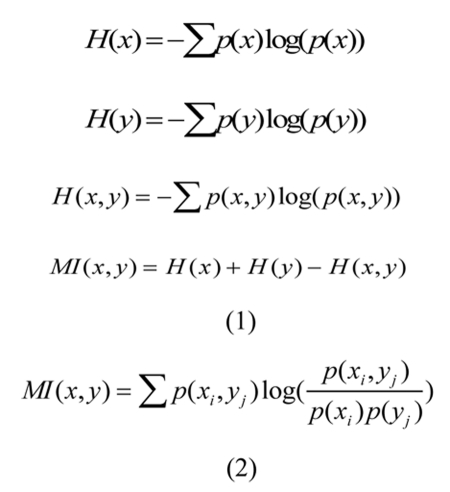
The field of Information Theory was introduced by [Shannon, 1948], “A Mathematical Theory of Communication,” which outlined the statistical measure of information and the detection of noise in a communication channel. Entropy (H(x) or H(y)) is a measure of the uncertainty of a random variable and can be combined with the joint entropy (H(x,y)) of two variables to determine the mutual information (MI(x,y)) or non-randomness between two variables shown in (1) of Figure 1. The combined equation to calculate mutual information is given in (2) of Figure 1, and is defined as the measure of mutual dependence between two variables. The combined form using probability (p(x) or p(y)) of a single variable and the joint probability (p(x,y)) between two variables is similar to a log-likelihood calculation.
Figure 1. Mutual information equations.
See above text for details.
Probability distributions calculated from mutation events
Application of Information Theory and the analysis of sequence data are impacted by a sampling bias from targeted research on proteins of medical interest and the introduction of noise from the phylogenetic impact on probability calculations [Atchley et al., 2000; Govindarajan et al., 2003; Martin et al., 2005; Tillier and Lui, 2003]. When determining probabilities in a data set, one underlying assumption is that the representative data is randomly selected from the population. When determining the distributions of amino acids in a column of a MSA, if the sequences are not randomly sampled from the population, then a bias is introduced towards the grouping of those sequences [Atchley et al., 2000].
To minimize the bias, a phylogenetic tree is constructed from the MSA to determine mutation events using parsimony. The evolutionary tree represents a graph of mutation events that can be used to correct or compensate for the phylogenetic influence in a MSA. A sequence position is represented as a terminal node in the tree with an evolutionary distance to parent nodes in the tree. A voting algorithm is used starting at each terminal node to compare each child node between two sequence positions. If the sequence positions agree, then the parent node is assigned that value. If the sequence positions in the two children nodes do not agree, then an X is assigned for unknown. The process continues for all internal nodes of the tree. To determine the parent node when a child node is an X, values are compared for descendent nodes, and if two nodes are found to contain the same value, the parent node is assigned that value.
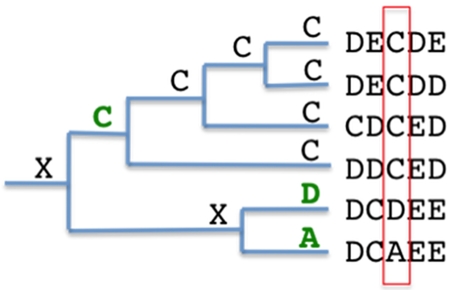
Detection of mutation events from the root of the node to the leaf nodes will generate a set of all mutations at a particular sequence position. This set of mutations would then be used as the basis for probability calculations of observed mutations. In Figure 2, a phylogenetic tree representation of sequence data can be used to determine mutation events. Without taking into consideration the phylogenetic influence, the probability of the set is p(A)=1/6, p(D)=1/6 and p(C)=2/3. If we calculate the probability of observed mutation events starting from the root node, then p(A)=1/3, p(D)=1/3 and the p(C)=1/3, as indicated in green in Figure 2. This is done by starting at the root node and counting all children nodes where the child node and parent node are not equal. Comparing the two methods of sampling sequence data yields two very different results. One accurately represents the sequences in the MSA and the latter represents the probabilities when a mutation occurs. This has the impact of reducing or compensating for the phylogenetic influence on probability calculations.
Figure 2. Tree representation of mutation events in an MSA.
Mutation events for a single sequence position are indicated in green where X is unknown.
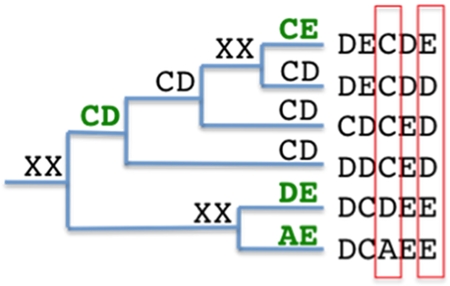
This same approach can be applied to calculating mutual information between two sequence positions and is the basis for improving the detection of co-evolving pairs. In Figure 3, the tree represents a pair of amino acids found at sequence positions x and y. The phylogenetic tree is used to detect mutation events between pairs that then become the population sample used for probability calculations. The probability based on the number of observed sequences would result in p(AE)=1/6, p(DE)=1/6, p(CD)=3/6 and p(CE)=1/6. By using the method described above, where we start at the root node and count children nodes that are different from the parent, with the additional rule that if an internal node is XX it takes on the value of its parent node, we get the following probabilities: p(AE)=1/4, p(DE)=1/4, p(CD)=1/4 and p(CE) =1/4, as indicated in green in Figure 3. The impact of having CD occur 50% of the time is now reduced to 25%, which serves as an adjustment to the phylogenetic influence of a mutation that occurs early in the tree, where overall, only four distinct mutations occur. It would appear that counting the number of distinct combinations would yield the same results. However, this is only true in the example presented. In a large tree, mutations occur along multiple paths of the tree; an amino acid pair that appears early in the tree may be absent for many mutations and then reappear as a dominant stable pairing along a particular branch of the tree. This approach focuses on counting the transitions from one mutation state to the next, and if the state does not change, then a mutation did not occur.
Figure 3. Tree representation of paired mutation events in an MSA.
Mutation events comparing two sequence positions are indicated in green where XX is unknown.
Nuclear receptor sequence selection
The NR DBD in Pfam PF00104.22 contains 2549 sequences and the NR LBD PF00105.10 contains 2647 sequences, and when joined by accession number, creates a MSA of 2094 sequences. PF00104.22 does not include sequences from the first two helices of the LBD, Helix 1(H1) and Helix 2(H2). PF00105.10 ends at the C-terminal side of the DBD (Helix c), thus co-evolving pair prediction will not include amino acids contained in the hinge domain, H1 or H2. This analysis will only indicate sequence positions that are co-evolving and functionally-important in the LBD and DBD across all NRs.
The accession number for each sequence was then used to select from uniprot the assigned uniprot gene and common gene name. Each sequence, when deposited in public databases, does not require a strict nomenclature when the gene name is assigned. Each assigned gene name was then cross-referenced based on known assignments or literature searches to the corresponding NRNC group symbol [Committee, 1999]. If a non-standard gene name occurred one time and was not easily mapped to the correct NRNC symbol via a literature search, that sequence would not be used as a classifier. It is also possible that deposited and annotated gene sequences will have some degree of classification error in the correct assignment of the α, β, or γ form of that gene. The deposited gene name and NRNC mapping are available as supplemental data (Supplementary File 1). The MSA alignment used in this analysis is also provided as supplemental data (Supplementary File 2).
Results and discussion
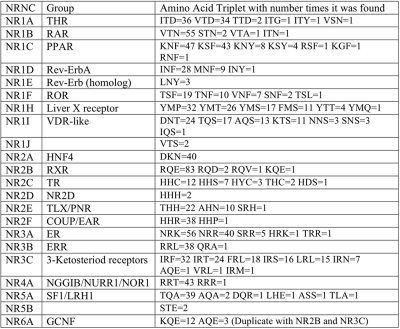
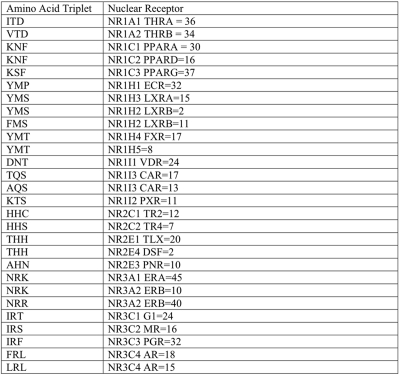
Mutual Information using mutation events is calculated for all sequence position pairs where (144,195) and (139,195) in the MSA have the highest mutual information and are located in the DBD. The amino acids found at MSA position (139,144,195) are grouped by NRNC symbol and shown in Table 1 and by specific NR sub-group are shown in Table 2. A single table view of the amino acid triplets mapped to specific NRs is provided as supplemental data (Supplementary File 3).
Table 1. Mapping of amino acids found at MSA position (139,144,195).
Sequence positions are located in the DBD and selected from 1334 NR uniprot sequences grouped by NRNC with the number of occurrences of that amino acid triplet. All amino acid triplets are unique to NR group except NR6A.
Table 2. Selected mappings from Table 1 of amino acid triplets and number of occurrences from 1334 uniprot sequences found at MSA position (139,144,195) to corresponding NR.
This table shows the degree that the amino acid triplet is conserved among the α, β, and γ form of each NR. It is also possible that original sequences when deposited where misclassified. LXRB has two occurrences of YMS and eleven occurrences of FMS where the YMS sequences could be LXRA, which further improves the triplet as a unique classifier of NR.
The MSA positions (139,144,195) located in the DBD are shown to be conserved for distinct NRs and could play an important role in the function or differentiation of NRs. Mappings of the MSA positions (139,144,195) to indexes in selected NRs is listed in Table 3. A mutation at [144:R607Q:ANDR_HUMAN]1 is attributed to Partial Androgen Insensitivity Syndrome (PAIS) and breast cancer in men [Chen et al., 1999; Weidemann et al., 1996; Weidemann et al., 1998; Wooster et al., 1992]. A mutation in Helix c at [194:K630T:ANDR_HUMAN] is attributed to prostate cancer [Tilley et al., 1996]. The NR5 subfamily members contain a conserved sequence called the FTZ-F1-box (579-601) responsible for DNA binding as a monomer, which includes [195:A580:FTZF1_DROME], indicating the multipurpose roles of secondary structures as a feature of NRs. [Ueda et al., 1992]. (1 [144:R607Q:ANDR_HUMAN] 144 is the MSA position, R is the amino acid found at sequence position 607 in ANDR_HUMAN).
Table 3. Mapping of MSA positions to indexes in individual NRs.
MSA positions (139,144,195) because of inserts in the MSA and PDB offsets will map to different sequence positions in a canonical NR sequence or a representative PDB structure.
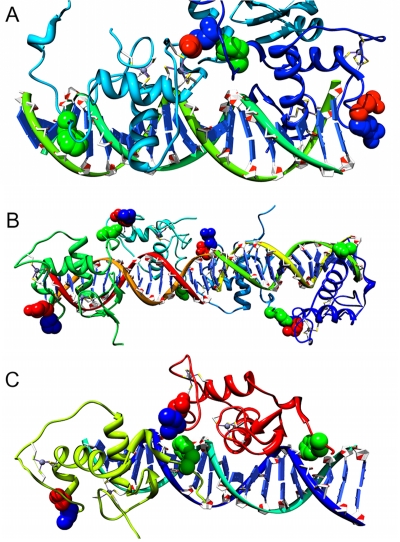
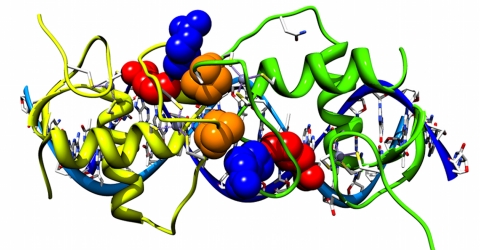
The DBD is highly conserved and to find three sequence positions that are specific to NRs it could be expected that these residues play a key role either in the DBD dimer interface or in DNA recognition, such as impacting the DBD spacing on specific response elements. The positions [139:K:157:PPARγ]2 and [144:S:158:PPARγ] are sequence and contact neighbors with [195:E:207:RXRα] in PDB:3DZU contained within the heterodimer interface between PPARγ DBD and RXRα DBD (Figure 4A). The contact pairs are also found in the homodimer DBD interface of RXRα-RXRα (Figure 4B) and in the homodimer DBD interface of RevErb-RevErb (Figure 4C). An additional PDB example is within the ERα DBD homodimer, where MSA sequence positions (139,144) form the dimer interface as a palindrome (Figure 5). MSA position 101 involved in the dimer interface is predicted to be co-evolving with MSA position 139. (2 [139:K:157:PPARγ] 139 is the MSA position, K is the amino acid found at sequence position 157 in PPARγ).
Figure 4. NR DBD dimer interface showing predicted co-evolving pairs in MSA (139,144,195).
In each structure MSA 139 is blue, 144 is red and 195 is green. A) 3DZU PPARγ DBD Light Blue RXRα Dark Blue. B)1BY4 RXRα-RXRα-RXRα-RXRα DBD. C) 1HLZ Rev-Erb-Rev-Erb DBD.
Figure 5. 1HCQ estrogen receptor α DBD homodimer showing predicted co-evolving pairs in MSA (139,144,101).
MSA position 139 is blue, 144 is red and 101 is orange where 101 is a predicted co-evolving pair with 139.
It has been shown that the 5’ flanking region plays a role in binding affinity of PPARα, PPARβ, and PPARγ to 16 natural PPREs [Juge-Aubry et al., 1997]. It was also shown that against five-selected PPRE the PPARα transcriptional activity was only slightly increased in the presence of ligand, whereas PPARβ, and PPARγ showed significant increase in transcriptional activity with the addition of ligand [Juge-Aubry et al., 1997]. This would imply that the DNA binding affinity has a ligand effect on the LBD in PPARα, but key mutations in the DBD of PPARβ, and PPARγ mitigate this effect. Recently, NRREs differing by a single base pair were shown to be an allosteric ligand of the glucocorticoid receptor (GR) [Meijsing et al., 2009].
A mutation at PPARγ F347A(LBD) was shown to negatively affect PPRE binding and transcriptional activity [Chandra et al., 2008]. F347 is located in the third dimer interface between PPARγ LBD and the N-terminal end of RXRα Helix c in the DBD. MSA position 195 is located in the C-terminal end of Helix c and mutations at this position could affect DNA binding as an allosteric ligand in the LBD based on interactions with mutations at (139,144) in the dimer interface.
The sequence position [195:F:182: PPARγ] is not involved in the PPARγ-RXRα(3DZU) DBD dimer, but it interacts with the 5’ minor groove flanking the PPRE and presents a unique identifier to interact with DNA. It has been shown that the first two bases flanking the PPRE are important for PPAR-RXR binding [Ijpenberg et al., 1997]. MSA position 195 is generally unique for a specific NR group where 18 of the 20 amino acids can be found at this position in the MSA. The sequence positions [139:R:182:RXRα] and [144:Q:183:RXRα] not involved in the PPARγ-RXRα(3DZU) dimer interface are located near the 3’ flanking region of the RXRE.
In this study, we analyze sequence data from all nuclear receptors to detect co-evolving pairs using Mutual Information (MI), which can reveal functionally-important sequence positions throughout the superfamily. We have identified three such sequence positions affording high MI that have conserved sequence patterns across all nuclear receptors and subfamilies. Two of the sequence positions identified are located within the DBD CII and a third was detected within the DBD Helix c. These locations are components of the heterodimer interface between PPARγ (CII) and RXRα (Helix c) based on PDB:3DZU. Helix c of PPARγ, which is not involved in the dimer interface, binds the minor groove in the 5' flanking region in a consensus PPARγ response element (PPRE) and the corresponding RXRα (CII) is found in the 3' flanking region of RXRE (3DZU). As these three sequence positions represent unique identifiers for all nuclear receptors and they are located within the dimer interface of PPARγ-RXRα DBD (3DZU) interfacing with the flanking regions of the NRRE, we conclude they are critical sequence positions involved in DNA recognition and binding.
Future directions
The process by which NRs bind as palindromes, direct repeats and everted repeats to the same hexameric DNA core motif, 5’-PuGGTCA (Pu = A or G) is well understood. In practice, the NRREs are not ideal and contain complex sequence patterns, which make it difficult for computational methods to accurately predict NRREs. We propose a possible mechanism where the 5’ and 3’ NRRE flanking region of a gene can interact with NRs DBD based on the NR-specific amino acids found at MSA positions (139,144,195). If the NRREs flanking regions do play an active role in transcription regulation, the DNA coding patterns could serve as important markers in the mapping of NRREs for specific NR complexes using computational methods. Recent differential HDX studies of intact VDR-RXRα heterodimer show that in the absence and presence of DNA, DNA binding alters the conformational dynamics of H3 in VDR, as well as the AF-2 surfaces of both receptors. This observation supports the notion that DNA can act as an allosteric NR ligand altering functional surfaces throughout the receptor (data not shown). To explore the ability of the NRRE flanking regions to perturb conformational dynamics within NRs, differential HDX studies can be performed on PPARγ-RXRα and RXRα-VDR in the absence and presence of NRREs where the flanking regions have been mutated. If the flanking region of a NRRE based on a unique DNA pattern can differentially impact the conformational dynamics of Helix c and/or CII, this allows an individual gene to code for regulatory properties of its transcription. Using identified DNA patterns in the PPRE flanking regions, we can provide additional sequence patterns that can be used to predict genes that are regulated by PPAR and VDR.
Abbreviations
- DBD
DNA binding domain
- ER α
estrogen receptor α
- GR
glucocorticoid receptor
- H1
helix 1
- H2
helix 2
- LBDs
ligand binding domains
- MI
mutual information
- MSA
multiple sequence alignment
- NRREs
nuclear receptor response elements
- NRs
nuclear receptors
- PAIS
partial androgen insensitivity syndrome
- PPARγ
peroxisome proliferator activated receptor γ
- PPRE
PPARγ response element
- REV-ERB
orphan RevErb subfamily of the nuclear receptor superfamily of transcription factors
- RXR α
retinoid X receptor α
Supplementary Material
References
- Atchley W. R., Wollenberg K. R., Fitch W. M., Terhalle W., Dress A. W. Correlations among amino acid sites in bHLH protein domains: an information theoretic analysis. Mol Biol Evol. 2000;17:164–78. doi: 10.1093/oxfordjournals.molbev.a026229. [DOI] [PubMed] [Google Scholar]
- Chandra V., Huang P., Hamuro Y., Raghuram S., Wang Y., Burris T. P., Rastinejad F. Structure of the intact PPAR-γ-RXR-α nuclear receptor complex on DNA. Nature. 2008:350–356. doi: 10.1038/nature07413. [DOI] [PMC free article] [PubMed] [Google Scholar]
- Chen C. P., Chern S. R., Wang T. Y., Wang W., Wang K. L., Jeng C. J. Androgen receptor gene mutations in 46,XY females with germ cell tumours. Hum Reprod. 1999;14:664–70. doi: 10.1093/humrep/14.3.664. [DOI] [PubMed] [Google Scholar]
- Committee N. R. N. A unified nomenclature system for the nuclear receptor superfamily. Cell. 1999;97:161–3. doi: 10.1016/s0092-8674(00)80726-6. [DOI] [PubMed] [Google Scholar]
- Desvergne B., Wahli W. Peroxisome proliferator-activated receptors: nuclear control of metabolism. Endocr Rev. 1999;20:649–88. doi: 10.1210/edrv.20.5.0380. [DOI] [PubMed] [Google Scholar]
- Govindarajan S., Ness J. E., Kim S., Mundorff E. C., Minshull J., Gustafsson C. Systematic variation of amino acid substitutions for stringent assessment of pairwise covariation. J Mol Biol. 2003;328:1061–9. doi: 10.1016/s0022-2836(03)00357-7. [DOI] [PubMed] [Google Scholar]
- Ijpenberg A., Jeannin E., Wahli W., Desvergne B. Polarity and specific sequence requirements of peroxisome proliferator-activated receptor (PPAR)/retinoid X receptor heterodimer binding to DNA. A functional analysis of the malic enzyme gene PPAR response element. J Biol Chem. 1997;272:20108–17. doi: 10.1074/jbc.272.32.20108. [DOI] [PubMed] [Google Scholar]
- Juge-Aubry C., Pernin A., Favez T., Burger A. G., Wahli W., Meier C. A., Desvergne B. DNA binding properties of peroxisome proliferator-activated receptor subtypes on various natural peroxisome proliferator response elements. Importance of the 5'-flanking region. J Biol Chem. 1997;272:25252–9. doi: 10.1074/jbc.272.40.25252. [DOI] [PubMed] [Google Scholar]
- Martin L. C., Gloor G. B., Dunn S. D., Wahl L. M. Using information theory to search for co-evolving residues in proteins. Bioinformatics. 2005;21:4116–24. doi: 10.1093/bioinformatics/bti671. [DOI] [PubMed] [Google Scholar]
- Meijsing S. H., Pufall M. A., So A. Y., Bates D. L., Chen L., Yamamoto K. R. DNA binding site sequence directs glucocorticoid receptor structure and activity. Science. 2009;324:407–10. doi: 10.1126/science.1164265. [DOI] [PMC free article] [PubMed] [Google Scholar]
- Robinson-Rechavi M., Escriva Garcia H., Laudet V. The nuclear receptor superfamily. J Cell Sci. 2003;116:585–6. doi: 10.1242/jcs.00247. [DOI] [PubMed] [Google Scholar]
- Shannon C. E. A mathematical theory of communication . Bell Syst Tech J. 1948;27:379–423, 623-656. [Google Scholar]
- Tilley W. D., Buchanan G., Hickey T. E., Bentel J. M. Mutations in the androgen receptor gene are associated with progression of human prostate cancer to androgen independence. Clin Cancer Res. 1996;2:277–85. [PubMed] [Google Scholar]
- Tillier E. R., Lui T. W. Using multiple interdependency to separate functional from phylogenetic correlations in protein alignments. Bioinformatics. 2003;19:750–5. doi: 10.1093/bioinformatics/btg072. [DOI] [PubMed] [Google Scholar]
- Ueda H., Sun G. C., Murata T., Hirose S. A novel DNA-binding motif abuts the zinc finger domain of insect nuclear hormone receptor FTZ-F1 and mouse embryonal long terminal repeat-binding protein. Mol Cell Biol. 1992;12:5667–72. doi: 10.1128/mcb.12.12.5667. [DOI] [PMC free article] [PubMed] [Google Scholar]
- Weidemann W., Linck B., Haupt H., Mentrup B., Romalo G., Stockklauser K., Brinkmann A. O., Schweikert H. U., Spindler K. D. Clinical and biochemical investigations and molecular analysis of subjects with mutations in the androgen receptor gene. Clin Endocrinol (Oxf) 1996;45:733–9. doi: 10.1046/j.1365-2265.1996.8600869.x. [DOI] [PubMed] [Google Scholar]
- Weidemann W., Peters B., Romalo G., Spindler K. D., Schweikert H. U. Response to androgen treatment in a patient with partial androgen insensitivity and a mutation in the deoxyribonucleic acid-binding domain of the androgen receptor. J Clin Endocrinol Metab. 1998;83:1173–6. doi: 10.1210/jcem.83.4.4704. [DOI] [PubMed] [Google Scholar]
- Wooster R., Mangion J., Eeles R., Smith S., Dowsett M., Averill D., Barrett-Lee P., Easton D. F., Ponder B. A., Stratton M. R. A germline mutation in the androgen receptor gene in two brothers with breast cancer and Reifenstein syndrome. Nat Genet. 1992;2:132–4. doi: 10.1038/ng1092-132. [DOI] [PubMed] [Google Scholar]
- Wurtz J. M., Bourguet W., Renaud J. P., Vivat V., Chambon P., Moras D., Gronemeyer H. A canonical structure for the ligand-binding domain of nuclear receptors. Nat Struct Biol. 1996;3:87–94. doi: 10.1038/nsb0196-87. [DOI] [PubMed] [Google Scholar]
Associated Data
This section collects any data citations, data availability statements, or supplementary materials included in this article.


