

Abstract
The association between education and good health is well established, but whether the strength of the association depends on other social statuses is not. We test a theory of resource substitution which predicts a larger correlation between education and health (measured for physical impairment) for people who grew up in families with poorly educated parents than for those whose parents’ were well educated. This is supported in the Aging, Status, and Sense of control (ASOC) survey, a representative national U.S. sample with data collected in 1995, 1998, and 2001. Some of the reason that parental education matters more to people who are poorly educated themselves is due to an unhealthy lifestyle, specifically to smoking and being overweight. Finally, as the poorly educated age, the negative health effects of their parents’ low educational attainment get worse.
Keywords: education, parental education, health, physical impairment
Does education improve health more for people whose parents were well educated or for those from less advantaged family backgrounds? According to the theory of resource substitution, education’s beneficial effect on health is greater for people with fewer alternative resources (Mirowsky & Ross, 2003; Ross & Mirowsky, 2006). Resource substitution theory predicts more health benefits from personal education for people whose parents were poorly educated than for those whose parents were well educated. This theory has several important health implications. If an individual’s parents were poorly educated, high levels of personal education can overcome the health disadvantages associated with family background. On the other hand, if an individual’s parents were poorly educated and the individual is also poorly educated, the health disadvantages are amplified, each making the other worse. Furthermore, because one’s own level of education is highly structured by that of one’s parents, individuals from disadvantaged family backgrounds are likely to be disadvantaged themselves. This case of resource substitution is called structural amplification (Mirowsky & Ross, 2003). In contrast to the hypotheses derived from resource substitution theory, it could be that the influence of education on health is greater for persons whose parents were also well educated, or that the effect of personal education on health is not conditioned by parental education one way or the other.
A great deal of evidence suggests that educational attainment leads to better health. Education increases physical functioning and subjective health among adults of all ages, and decreases the age-specific rates of physical impairment, morbidity, disability, and mortality (Lauderdale, 2001; Mirowsky & Ross, 2003; Rogers et al., 1999; Ross & Wu, 1995; Williams, 1990). Still unanswered, however, is the question of whether family origins condition the association between education and health. Here we examine one aspect of family background-- mother’s and father’s education. Parental education precedes and structures other parental statuses like employment, occupation, and income; and reports of mother’s or father’s occupation or employment status, or poverty in one’s family of origin are less reliable, less stable over time, and more subjective than reports of parents’ educational attainment.
RESOURCE SUBSTITUTION AND STRUCTURAL AMPLIFICATION
We present and test two integrated concepts: resource substitution and its role in structural amplification (Mirowsky & Ross, 2003; Mirowsky, Ross, & Reynolds, 2000). The resource substitution theory of education and health states that education is more important to the health of people who are otherwise disadvantaged (Ross & Mirowsky, 2006, 2010). Those with few alternative resources are more dependent on education for health than those with more resources because resources can substitute for one another to improve health. Here, resource substitution theory predicts that education interacts with disadvantaged social origins, such that education has a larger effect on health for individuals who grew up in families with poorly educated parents than it does for the more advantaged.
Structural amplification is a special case of resource substitution occurring when social conditions decrease the likelihood of attaining personal resources that otherwise would moderate the condition’s undesirable consequences (Ross, Mirowsky, & Pribesh 2001). In this case, personal education is a consequence of parental education and also a moderator of parental education. In theory, this leads to a situation in which disadvantaged social origins decrease the likelihood of attaining high levels of education oneselfBthe very resource needed to protect the health of individuals from disadvantaged family backgrounds. Educational attainment makes low parental education less harmful to health, but low parental education tends to result in lower personal educational attainment. Individuals who attain high levels of education themselves can sever, or at least attenuate, the poor health connection to disadvantaged family background. As ones own education increases, the impact of parental education on poor health gets smaller.1
Substitution and Cumulative Advantage
Education-based advantages and disadvantages accumulate as people age (Lynch, 2003; Lauderdale, 2001; O’Rand, 1996; Ross & Wu, 1996). Among persons who are poorly educated, health deteriorates with age faster for those whose parents were also poorly educated. The impact of parents’ low education on their offspring’s health is lessened among individuals with high levels of education. Thus, the socioeconomic divergence in health across levels of education with age would be smaller were it not for the effect of parental education on one’s own education. As people age, the well-educated accumulate more and more resources, making them less and less dependent on any one resource.
EDUCATION, LEARNED EFFECTIVENESS, AND HEALTH
Education plays a critical role in this process because education is a resource itself and the human capital developed through education helps people generate other resources. Education has qualities that go beyond those of other resources because it builds resourcefulness, or the ability to meet situations effectively, creating the real skills and abilities called human capital. On the most general level education teaches a person to learn. In classes the individual develops the ability to write, communicate, solve problems, analyze data, develop ideas, make plans and implement them. There the individual also develops broadly useful analytic skills such as observing, experimenting, summarizing, synthesizing, interpreting, and so on. The more years of schooling, the greater the cognitive development, characterized by flexible, rational, complex strategies of thinking. Higher education teaches people to think logically and rationally, to see many sides of an issue, to analyze problems and solve them (Hyman et al., 1976; Kingston et al., 2003; Pascarella & Terenzini, 1991; Spaeth, 1976). It also develops effective habits and attitudes such as dependability, motivation, effort, trust and confidence (Kohn & Slomczynski, 1993). In particular the process of learning creates confidence in the ability to solve problems with attention, thought, action, and perseverance. Thus education increases effort, which like ability is a fundamental component of problem-solving (Wheaton, 1980). Apart from the value of the skills and abilities learned in school, the process of learning builds the confidence, motivation, and self-assurance needed to attempt to solve problems.
Personal Control and Health Lifestyle
Because education develops competence on many levels it gives people the ability and motivation to shape and control their lives (Mirowsky & Ross, 1998, 2003). High levels of education increase sense of personal control; the belief that one can master, control, or effectively alter the environment (Mirowsky & Ross, 1989, 1991, 2003; Pearlin et al., 1981; Ross & Mirowsky, 1999; ; Ross & Van Willigen, 1997). In contrast, the poorly educated may not possess the resources necessary to achieve their goals, which produces a sense of powerlessness, fatalism, and helplessness. Education increases learned effectiveness; its absence produces learned helplessness (Mirowsky & Ross, 2005).
People who feel in control of their own lives seek information by which to guide their lives and improve their outcomes. In seeking good health, they may adopt a healthy lifestyle that includes exercise, walking, moderate drinking, normal weight, and not smoking. By developing personal control and effectiveness, education may develop individuals who create a healthy lifestyle. Compared to people who feel powerless, people with a sense of personal control are more likely to quit smoking, exercise, and have moderate alcohol consumption; and they have better self-rated health and lower rates of mortality (Mirowsky & Ross, 1998; Seeman & Lewis, 1995; Seeman & Seeman, 1983). Resource substitution theory implies that the sense of personal control and a healthy lifestyle may form an important link in education’s contingent effect on health.
Work and Economic Conditions
Education also gives people access to good jobs that pay well. The skills and abilities of the well-educated are valuable to employers, and employers take educational credentials into account when hiring. Thus, full-time employment, a history of employment, autonomous and creative work, high incomes, and the ability to avoid economic hardship may also mediate the conditional association between education and health (Mirowsky & Ross, 1998, 2003).
Summary
Resource substitution hypothesizes greater health benefits from personal education for people whose parents were poorly educated than for those whose parents were well educated. We compare this hypothesis to the alternatives that suggest either greater health benefits from personal education for people whose parents were well educated or that education equally benefits all persons regardless of parental education. The critical test is in the sign and significance of the interaction term. Resource substitution theory hypothesizes a positive interaction between personal and parental education in the prediction of poor health. Alternatives suggest either a negative or insignificant interaction term.
Resource substitution theory further hypothesizes that the sense of personal control, a healthy lifestyle, and work and economic conditions mediate the conditional effect of education on health, and that these mediators follow the same conditional pattern as does education. That is, personal control, lifestyle, and work and economic conditions have larger effects on health among persons whose parents were poorly educated.
SAMPLE
Our analyses used the 1995 survey of Aging, Status, and the Sense of Control (ASOC), with follow-up interviews in 1998 and 2001. ASOC is a national telephone probability sample of United States households. Respondents were selected using a pre-screened random-digit dialing method that decreases the probability of contacting a business or nonworking number and decreases standard errors compared to the standard Mitofsky-Waksberg method while producing a sample with the same demographic profile. The ASOC survey has two subsamples, designed to produce an 80% over-sample of persons aged 60 or older. The survey was limited to English-speaking adults. The main sample draws from all households; the oversample draws only from households with one or more seniors. In the main sample the adult (18 or older) with the most recent birthday was selected as respondent, and in the oversample the senior (60 or older) with the most recent birthday was selected.. Up to 10 call-backs were made to select and contact a respondent, and up to 10 to complete the interview once contact was made. Interviews were completed with 71.6 percent of contacted and eligible persons. The final sample had 2,592 respondents ranging in age from 18 to 95 at baseline. The ASOC survey had three waves of interviews taken at three-year intervals, in 1995, 1998 and 2001. Follow-up information is available for 62.3% of the initial sample in either wave 2 or 3. The vector analyses adjust for attrition using the maximum likelihood Expectation-Maximization procedure (EM), as detailed in Mirowsky and Kim (2007). In the present case the procedure adjusts for attrition predictable from personal and parental education, sex, age, race, impairment at baseline, and in most cases also impairment at one of the two follow-ups.
The following weighted statistics compare the demographic characteristics of the ASOC sample to those for the U.S. population as a whole (U.S. Bureau of the Census, 1995). For ASOC and the U.S. respectively, 56.2% and 51.2% were female, 85.1% and 82.9% were white, 55.7% and 55% were married, and the mean household size was 2.67 and 2.59. Among persons age 25 or older, 85.1% and 80.9% had a high school degree, and 25.6% and 22.2% had a college degree. The mean household income was $43,949 and $41,285.
MEASUREMENT
The respondent's education was measured in years of formal education completed. Parental education was also measured as the number of years of formal schooling completed, or the average if the number of school years for both parents were reported. When one parent's education was unknown, we used the other. Unknown parental education (coded 1 if the respondent did not know either his/her mother's or father's education; and 0 otherwise; with a mean of .17) is adjusted in the regressions. Education and parental education are centered on their means in the regressions. The average number of years of formal schooling completed among respondents was 13.27 (s.d. = 2.74). Their parents averaged 10.97 years (s.d. = 3.21). About 26% of respondents had a college degree or higher, compared with 10% of their parents. For the multi-population latent growth curve structural equation model of impairment vectors we tried various education categorizations. The final categories of personal education compare high school degree or less, some college, and college degree or more. The categories of parental education are “less than high school degree” or “don’t know” versus “high school degree or more”. Tests of equality constraints showed no significant differences in models of low parental education and unknown parental education. Other categorizations of parental education with college attendance distinguished and categorizations of personal education with less than high school distinguished produced combinations of personal and parental education with small groups.
Health was measured as physical impairment. We assessed physical mobility and functioning in daily activities, using an index of seven items similar to Nagi's (1976) disability scale. Respondents were asked "How much difficulty do you have (1) climbing stairs; (2) kneeling or stooping; (3) lifting or carrying objects less than 10 pounds, like a bag of groceries; (4) preparing meals, cleaning house or doing other household work; (5) shopping or getting around town", (6) seeing, even with glasses; (7) hearing (For those with a hearing aid, “hearing, even with your hearing aid")?" The response categories were “no difficulty” (coded 0), “some difficulty” (coded 1), and “a great deal of difficulty” (coded 2). Averaging the items produced an index with an alpha reliability of .84. Low scores indicate unimpaired physical functioning and high scores indicate impairment. Because it is skewed toward high physical functioning, the physical impairment scale is logged (after adding .07 to 0) (mean = −1.74).
Details on the items used to measure the mediating variables including work and economic conditions, health lifestyle, and the sense of personal control are found in the Measurement Appendix.
ANALYSES
OLS Regression analyses
Our primary analyses specified and analyzed the relationship of physical impairment to education and parental education, testing the hypothetical interaction and its possible mediators. We modelled the prediction of impairment in three steps. Model 1 included education and parental education, and the parental-by-personal education interaction term, with adjustment for sociodemographic variables. Model 2 added adjustment for potential consequences of education relating to work and economic resources, and Model 3 added adjustment for the sense of personal control and health lifestyle. An interaction between personal and parental education could be explained statistically if parental education interacted with a mediator of education’s effect, so we tested all these interactions. Two versions of model 3 included significant interactions (non-significant interactions were pruned). Model 3a included significant interactions of parental education and specific indicators of a healthy lifestyle, and model 3b included the significant interaction of parental education with a healthy lifestyle index.
The hypotheses refer to the effects of education on impairment accumulated throughout adulthood, not to the changes in impairment concurrent with being in school. Thus, the primary analyses examined individual differences in level of physical functioning rather than fluctuations within individuals over time. However, a subsidiary latent growth curve structural equation model described next predicts the changes in impairment, as well as levels of it, by age and level of personal and parental education to see whether advantages associated with high levels of education (and the disadvantages associated with low levels) cumulate with age. Resource substitution theory predicts that, as people age, the impairment levels and increases of the poorly educated will get much worse if their parents were also poorly educated; but that the physical impairment of the well educated increases less and is less influenced by parental education.
Latent Growth Curve Structural Equation Model
We graphed the aging vectors of impairment implied by the latent growth curve structural equation models. An aging vector represents the origin and change in an outcome for each birth cohort as an arrow of change from the value predicted at baseline age to the one predicted at follow-up age as the cohort transits a segment of the life course (Mirowsky & Kim, 2007). The set of vectors represents the pattern of level and change in the outcome across the life course. The aging vector model examines whether the impairment vectors differ across levels of education, and whether the extent of those differences depends on ones parent’s education. The vector analyses divided the sample into six groups: high school degree or less, some college, and college degree or more by low (< h.s. degree) and high (h.s. degree +) parental education. A multi-population latent growth curve structural equation model predicts the origin (intercept) and change (slope) with respect to time elapsed over the follow-up period. Hypotheses are tested by setting (or freeing) equality constraints across groups and measuring the increment (or decrement) to χ2 error of the overall fit as detailed later. The vector model is described in Appendix A.
RESULTS
Education, Parental Education, and Health
Model 1 of Table 1 shows that both personal and parental education reduced physical impairment, and that the impact of parental education was less when personal education is high. This interaction supports resource substitution. Among people with a college degree, parents’ education had no impact on physical impairment. In contrast, among people who had not finished high school, parental education had a significant impact on impairment– the higher their parents’ educational attainment, the lower their levels of impairment. People whose parents were poorly educated and were poorly educated themselves had very high levels of impairment. On the other hand, people from disadvantaged backgrounds who attained a college education themselves had the same low levels of impairment as the college educated from more advantaged family backgrounds.
Table 1.
Metric coefficients (standard errors) Physical Impairment (logged) Regressed on Education, Parents’ Education, and their Interaction, adjusting for Age, Sex, Race, Marriage, and Unknown Parents’ Education (model 1), Work and Economic History and Conditions (model 2), Sense of Control, Health Lifestyle, and Significant Interactions with Parents’ Education (models 3a and 3b): U.S., ASOC, 1995.
| Model 1 | Model 2 | Model 3a | Model 3b | |
|---|---|---|---|---|
| Education | ||||
| Education | −.055*** (.007) | −.025*** (.007) | −.012† (.008) | −.011† (.007) |
| Parents’ Education | −.016** (.006) | −.014* (.006) | −.006 (.005) | −.006 (.005) |
| Education × Parents’ Education | .004* (.002) | .004** (.002) | .004* (.002) | .003* (.002) |
| Work & Economic History and Conditions | ||||
| History of Unemployment | … | .094* (.046) | .060 (.045) | .060 (.045) |
| History of Economic Hardship | … | .141*** (.035) | .116*** (.034) | .115*** (.034) |
| Employed | … | −.251*** (.043) | −.270*** (.042) | −.264*** (.042) |
| Autonomous work | … | −.037** (.012) | −.033** (.011) | −.034*** (.011) |
| Creative work | … | −.128*** (.021) | −.094*** (.021) | −.092*** (.011) |
| Household Income | … | −.001* (.000) | −.001* (.000) | −.001* (.000) |
| Economic Hardship | … | .202*** (.028) | .173*** (.027) | .180*** (.027) |
| Sense of Control & Health Lifestyle | ||||
| Sense of Control | … | … | −.186*** (.033) | −.183*** (.033) |
| Exercising | … | … | −.059*** (.016) | … |
| Walking | … | … | −.070*** (.016) | … |
| Moderate drinking | … | … | −.042** (.016) | … |
| Overweight | … | … | .137*** (.016) | … |
| Smoking | … | … | .052*** (.016) | … |
| Overweight × Parents’ Education | … | … | −.011* (.005) | … |
| Smoking × Parents’ Education | … | … | −.008† (.005) | … |
| Healthy Lifestyle | … | … | … | −.074*** (.007) |
| Healthy Lifestyle × Parents’ Education | … | … | … | .005* (.002) |
| Sociodemographic Controls | ||||
| Unknown Parents’ Educationa | .151** (.049) | .131** (.047) | .094* (.046) | .095* (.045) |
| Age | .018*** (.001) | .019*** (.001) | .016*** (.001) | .016*** (.001) |
| Sex (1 = Female) | .108*** (.034) | .049 (.033) | .078* (.033) | .062† (.032) |
| Race (1 = White) | −.044 (.049) | .037 (.047) | .052 (.045) | .044 (.045) |
| Marital Status (1 = Married) | −.136*** (.034) | −.075* (.033) | −.073* (.032) | −.065* (.032) |
| Constant | −2.681 | −2.837 | −3.327 | −2.698 |
| R2 | .241 | .304 | .350 | .345 |
NOTES: N = 2,565.
Physical impairment is logged.
Education is centered on its mean (13.27). Parents’ education is centered on its mean (10.97).
(1=don’t know either parents’ education; 0= otherwise).
Health lifestyle measures are z scores with a mean of 0; s.d. of 1.
p ≤ .10;
p ≤ .05;
p ≤ .01;
p ≤ .001 (two-tailed tests)
These results have two implications. On the positive side, people who attain a college degree or higher appear to overcome physical impairment associated with disadvantaged family origins. On the negative side, a person’s own education is highly correlated with their parents’ (b = .265, seb = .016, beta = .311, p < .001, with adjustment for sex, race, and age), so people who grew up in disadvantaged families are the least likely to attain the high levels of education needed to overcome the health consequences of disadvantaged origins.
Personal education also mediated about half of the additive effect of parental education on health. Because education levels in both generations are centered on their means, the coefficients can be interpreted as the impact of one at the mean level of the other. Before adjustment for personal education, the unstandardized coefficient associated with parental education was −.031 (not shown). With adjustment it was −.016. Almost half of the additive effect of parental education on health is indirect, due to its association with personal education (−.031 -[−.016])/−.031 = .48). The standardized coefficient associated with personal education was −.161, and the one associated with parental education was −.054, indicating that the net effect of personal education is about 3 times as large as that of parental education.
Non-Conditional Explanations
Work and Economic Resources
Work and economic resources are added in model 2 of Table 1. A history of unemployment and economic hardship is associated with current physical impairment. People who are currently employed had lower levels of impairment than the non-employed. People engaged in autonomous and creative work also had lower levels of impairment. Finally, household income was associated with less impairment and economic hardship with more. Interestingly, a personal history of unemployment and economic hardship has significant effects on physical impairment even with adjustment for current employment and economic well-being. All of these work and economic conditions mediate about half of the association between education and physical impairment. The well-educated were less likely to have had a history of unemployment and economic hardship, were more likely to be currently employed, more likely to engage in autonomous and creative work, and have higher household incomes and less economic hardship. However, work and economic conditions do not help explain much of the effect of parental education on physical impairment, since the coefficient associated with parental education remains essentially unchanged with their inclusion (−.016 - [−.014])/.016 =.125).
The Sense of Control and Health Lifestyle
Model 3a of Table 1 further adds the sense of personal control and indicators of a healthy lifestyle. All lifestyle variables are centered on their means of 0 because they appear in interaction terms described later. People with a high sense of personal control were less physically impaired. People who smoke and are overweight were more impaired, and people who exercise, walk, and drink moderately were less impaired. The sense of control and health lifestyle explains a large part of the associations between personal education and impairment and between parental education and impairment. The well-educated have a higher sense of control, are less likely to smoke and to be overweight, and are more likely to drink moderately than the poorly educated. People whose parents were well educated have a higher sense of control, and are less likely to be overweight or smoke, and are more likely to walk. The sense of control and health lifestyle explains another 50% of the association between education and physical impairment and reduces the significance of personal education to the .10 level. (Together the two sets of mediators explain about 78% of the association between education and impairment (−.055 -[−.012])/−.055 =.78)). The sense of personal control and health lifestyle explains about 57% (−.014 - [−.006])−.014 =.57) of the association between parental education and impairment and reduces the coefficient associated with parental education to insignificance.
Work and economic conditions and the sense of personal control do not interact significantly with parental education. Only health lifestyle’s interactions with parental education are significant, as described next.
Health Lifestyle is a Conditional Explanation
As shown in model 3a, two health lifestyle factors interact significantly with parental education namely smoking and being overweight. Among people who smoked or were overweight, parental education had a larger impact on impairment. For people who do not smoke and are of normal weight, parental education had less of an effect. Looked at the other way, smoking and being overweight worsen health more when parental education is low. This supports the resource substitution hypothesis and indicates plausible explanations of the conditional effect of personal education on health. Part of the reason parental education has a larger effect on health among the poorly educated is because the poorly educated are more likely to smoke and to be overweight. Although all of the other health lifestyle interaction terms were in the direction supporting resource substitution, none was significant, either singly or in a block. Furthermore, the two significant interactions did not change the coefficient associated with the interaction between personal and parental education.
It is plausible that smoking and being overweight have the contingent effects on impairment because both disproportionately have their origins in youth, when people are living with their parents (Greenlund et al. 1996; Flay et al. 1983; Hayward & Gorman, 2004; Kandel & Wu, 1995). However, it could also be that any single indicator of health lifestyle is not very reliable. Possibly a health lifestyle factor would better explain the contingent effect of personal education on impairment. Model 3b substitutes a healthy lifestyle scale for the individual components shown in model 3a. Like the components, the scale is centered on its mean. People with a healthy lifestyle have lower levels of impairment. The significant interaction with parental education indicates that parental education has a larger effect on impairment when people’s health lifestyle is poor than when it is good, which supports resource substitution. The interaction explains 25% of the interaction between parental and personal education ((.004 - .003)/.004 = .25).
Figure 2 graphs the interaction between parental education and a healthy lifestyle. When people have a healthy lifestyle--when they walk, exercise, drink moderately, refrain from smoking, and maintain a normal weight-- parental education has no effect on physical impairment. Even when people’s lifestyle is average, parental education has little effect. This helps explain why parental education has little effect among the well educated, who tend to have a healthier lifestyle. It is only when people’s health lifestyle is poor that parental education has an impact on impairment. For them, the higher the level of parental education, the lower the physical impairment levels. Stated the other way, the lower the level of parental education, the worse the physical impairment. Among people whose parents did not finish high school and who themselves engage in unhealthy behaviors, physical impairment levels are high.
Figure 2.
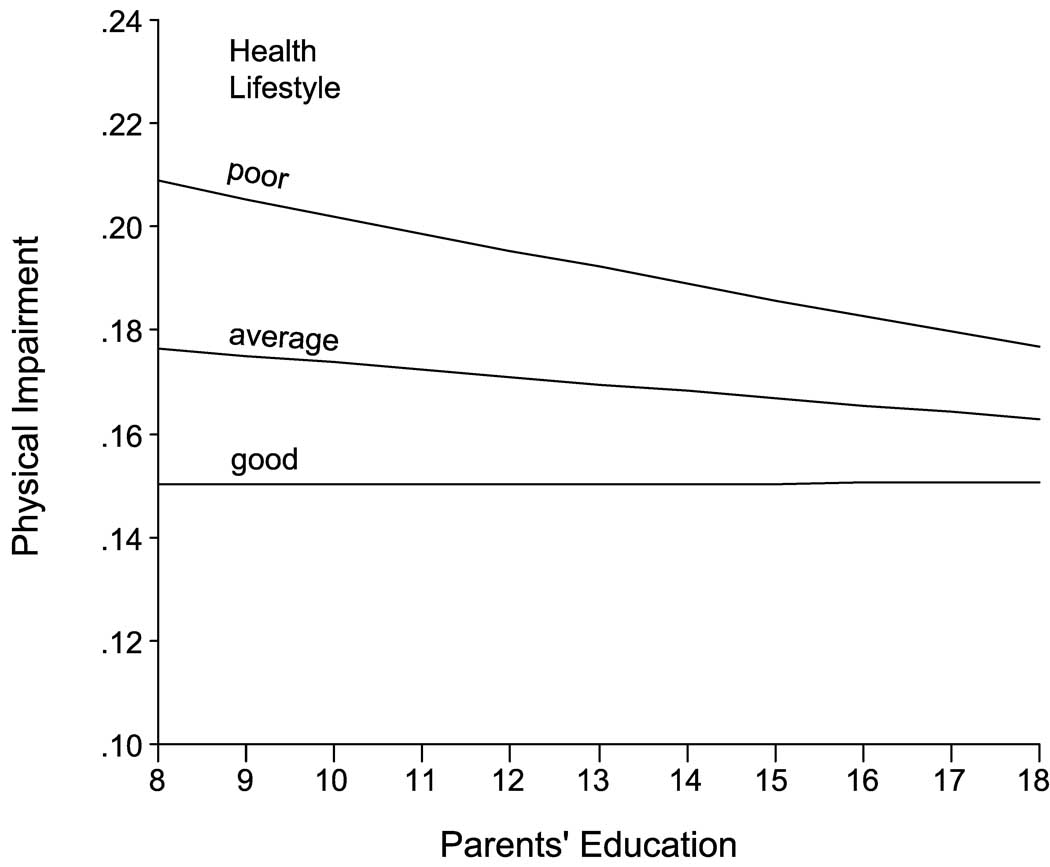
Physical impairment by parents’ education at three levels of the health lifestyle index (poor = 25th percentile, average = 50th percentile, good = 75th percentile) adjusting for age, sex, race, marital status, personal education and the interaction between personal and parental education.
This conditional mediator further shows the insidious implications of the structural amplification of disadvantage. Not only are people whose parents were poorly educated likely to be poorly educated themselves, but parental education shapes health lifestyle over and above one’s own education. Table 2 shows that, adjusting for personal education, high levels of parental education were associated with a healthier lifestyle. Low parental education has a negative influence on health lifestyle directly and indirectly by way of one’s own education, and low parental education amplifies the health problems associated with low personal education and with an unhealthy lifestyle.
Table 2.
Metric coefficients (standard errors) for Healthy Lifestyle Regressed on Education and Parents’ Education, adjusting for Age, Sex, Race, Marriage, and Unknown Parents’ Education: U.S., ASOC, 1995.
| Healthy Lifestyle | |
|---|---|
| Education | .145*** (.019) |
| Parents’ Education | .085*** (.016) |
| Unknown Parents’ Educationa | −.363** (.134) |
| Age | −.022*** (.003) |
| Sex (1 = Female) | .270** (.093) |
| Race (1 = White) | .015 (.134) |
| Marital Status (1 = Married) | −.005 (.093) |
| Constant | 1.037 |
NOTES: N = 2,565.
Education is centered on its mean (13.27). Parents’ education is centered on its mean (10.97).
(1=don’t know either parents’ education; 0= otherwise)
p ≤ .10;
p ≤ .05;
p ≤ .01;
p ≤ .001 (two-tailed tests)
Education-based Life Course Vectors of Physical Impairment
The aging-vector models show that adulthood physical impairment vectors differ by levels of personal and parental education in a manner consistent with resource substitution. Figure 3 shows the structural equation latent growth curve model, and Table 3 the coefficients, on which Figure 4 is based. Figure 4 illustrates the age-specific vectors of persons with high and low levels of education. The patterns suggest that the vector sets differ by level of education, with parental education influencing the life course trajectories of impairment more when one’s own education is low. Among respondents with a high school degree or less, low parental education was associated with increasingly worse impairment levels in older age and greater increases in impairment as people age. Their counterparts whose parents were well educated show much healthier aging vectors. Among respondents with a college degree or more, two things distinguish their aging vectors from the poorly educated. First, their impairment was much lower at all ages and increases less with age. Second, parental education made much less difference to their impairment levels as they aged. For the well educated impairment was low and increased little with age irrespective of whether one’s parents were well educated or not. However, there is an interesting (although non-significant) difference in the patterns of the well educated from different backgrounds. When parents’ educational attainment was high, impairment remained low and level until about age 60, after which it increases. When parents’ educational attainment was low, impairment increased at a slow but consistent rate (also see Table 3).
Figure 3.

Aging Vector Growth Curve Structural Equation Model for Table 3 and Figure 4.
Table 3.
Origin and change in physical impairment (logged) based on a Latent Growth Curve Structural Equation Model of data from the 1995, 1998 and 2001 ASOC survey.
| Origin | ||||||
|---|---|---|---|---|---|---|
| Respondent’s Education | High School Degree or Less | Some College | College Degree or More | |||
| Parents’ Educationa | Low | High | Low | High | Low | High |
| (Age - 45)/100 | 2.318*** (12.070) | 1.436*** (7.113) | 2.263** (5.844) | 1.808*** (8.335) | 2.717** (6.635) | 1.212 ** (5.539) |
| ((Age - 45)/100)2 | 4.562** (4.468) | |||||
| Female | .212** (3.249) | .192** (2.650) | .121† (1.702) | |||
| White | −.226* (−2.610) | −.210* (−2.055) | ||||
| Intercept | −1.671** (18.201) | −1.949*** (−35.766) | −1.923*** (−23.588) | −1.832*** (−17.158) | −2.212*** (–22.866) | −2.278*** (−60.308) |
| R2 | .192 | .152 | .200 | .195 | .213 | .246 |
| Slope of Change | ||||||
| Respondent’s Education | High School Degree or Less | Some College | College Degree or More | |||
| Parents’ Education | Low | High | Low | High | Low | High |
| (Age - 45)/100 | .073† (1.672) | .235* (3.055) | .088† (1.815) | .133** (3.014) | ||
| White | ||||||
| Female | .037* (2.351) | |||||
| Intercept | .054** (7.682) | .023 (1.591) | .019 (1.168) | .042** (5.048) | .035 (3.212) | .028 (3.908) |
| R2 | .099 | .214 | .041 | .079 | ||
NOTES : Metric coefficients with t values in parentheses shown. Restricted to coefficients significant at p < .10.
CFI = 1.000; RMSEA = .000
chi-square = 79.607; degrees of freedom =84; p = .615
Parents’ education scored low = less than high school degree; high = high school degree or more.
p ≤ .10;
p ≤ .05;
p ≤ .01;
p ≤ .001 (two-tailed tests)
Figure 4.
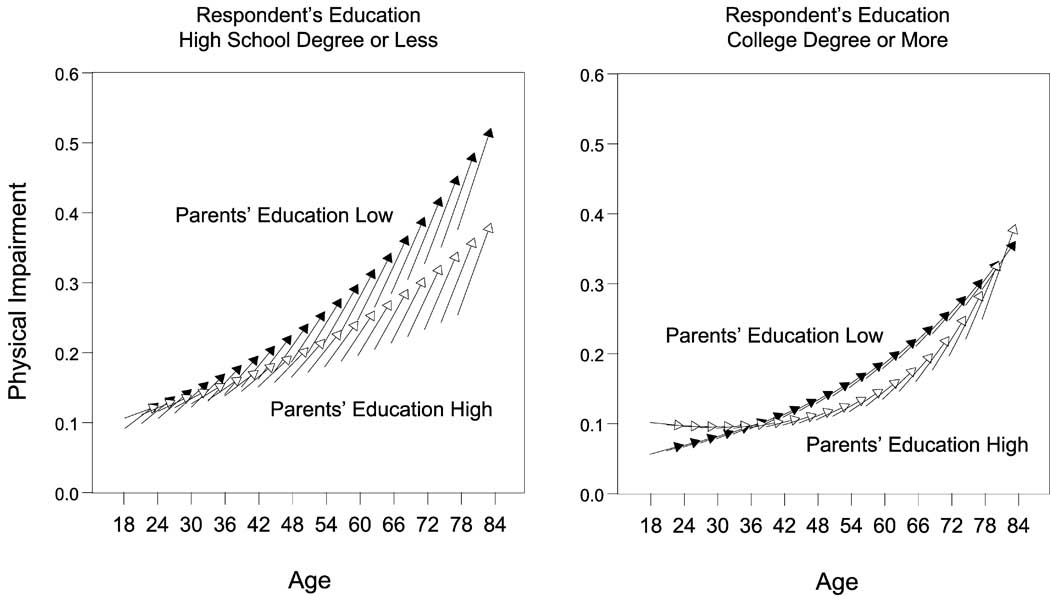
Aging vectors of physical impairment for respondents with a high school degree or less compared to those with a college degree or higher by level of parental education (low = less than a high school degree or unknown, high = high school degree or higher). Predicted origin and 6-year change in impairment shown. The arrows represent the change vectors of every third one-year birth cohort. ASOC survey, U.S., 1995, 1998, and 2001.
Significance tests of constraints imposed on the model confirm the interpretation suggested by the vector graphs. Appendix B (see online electronic supplementary material INSERT LINK) presents a series of equality constraints across six levels of personal and parental education. Significance tests show that there were significant differences in vectors across levels of parental education for persons with a high school degree or less. In contrast, for persons with some college or with a college degree or more, there were no significant differences in aging vectors across levels of parental education. Parental education significantly affected the aging vectors of impairment among persons with a high school degree or less, but had no significant effect among people who had been to college or completed college.
DISCUSSION
In support of resource substitution theory, we found that people whose parents’ were poorly educated were more dependent on their own educational attainment for good health than are people from more advantaged backgrounds. High levels of personal education can overcome disadvantaged family origins; but low levels of personal education make health disparities based on family background worse. If individuals who grew up with poorly educated parents manage to attain a college education, the low education levels of their parents have little detrimental effect on physical functioning. However, among poorly educated people whose parents were also poorly educated, low levels of parental education worsen health. Health lifestyle, especially smoking and being overweight, accounted for some of this contingent effect. Further tests of resource substitution are needed to see whether the theory applies to various health outcomes and to other disadvantaged statuses.
Policy Implications
Our results imply that personal educational attainment counteracts the health effects of having poorly educated parents. If so, then certain policy implications follow. First, education policy is health policy. Second, health policy must address the educational opportunities of children raised by poorly educated parents. Otherwise those children, in adulthood, will suffer the multiplicative health consequences of low parental education and low personal education. Third, efforts to improve population health must concentrate on the children of poorly-educated parents in order to make the largest and most efficient gains. Structural amplification condemns some families to the concentration of low education with poor health across generations. The amplification depends on the low education attained by the offspring of poorly educated parents. Break that mediating link, and the moderating effect of higher education will suppress the health disadvantages of the socially disadvantaged origins.
Research Highlights
Personal education benefits health most for people whose parents are poorly educated.
Personal educational attainment counteracts the negative health effects of having poorly educated parents.
Low levels of parents’ education worsen health most among people who are poorly educated themselves.
These processes increase health disparities based on educational attainment in two generations.
Supplementary Material
Figure 1.

Physical impairment by parents’ education at three levels of personal education, adjusting for age, sex, race, and marital status.
Acknowledgements
This research was funded by grants from the National Institute on Aging: Aging, Status, and the Sense of Control (RO1-AG12393) to John Mirowsky (p.i.) and Catherine E. Ross (co p.i.) and Reconceptualizing Socioeconomic Status and Health to Ross (p.i.) and Mirowsky (co p.i.) RO1AG035268, and by a grant from the National Institute of Child Health and Human Development: Educational Differences in U.S. Adult Mortality (RO1-HD053696) (Robert Hummer, p.i.). The data were collected by the Survey Research Laboratory of the University of Illinois. Ethical approval for the Aging, Status, and Sense of Control data was given by Human Subjects Committees at the University of Illinois and the University of Texas.
Appendix A
Aging Vector Model
The vector model has fixed effects that are functions of age at time zero and random effects that are linear functions of followup time. The first equation describes the within-person model, in which the outcome Y for person i at time t is a linear function of time plus an error term eit that is random with respect to time:
The second and third equations describe the between-persons model. The within-person coefficients ai0 and ai1 of the within-person equation are functions of age at time zero (Ai0) centered on a reference age (45) (and divided by 100 to avoid coefficients with many decimal places), of race (W = 1 if White and 0 if non-white), and sex (not shown in equations to simplify) and of individual random deviations ui0 and uit from the expected constant and change with respect to time:
Measurement Appendix
Work and Economic Conditions
Economic hardship
Not enough money to buy food, clothes, or other things your household needed; Not enough money to pay for medical care; Trouble paying the bills. Frequency in the past 12 months coded never (1), not very often (2), fairly often (3), or very often (4). Scale is the mean response to 3 items, mean = .35, s.d. =.59; alpha reliability = .82
History of unemployment
Were you ever unemployed for more than 6 months when yo wanted to be employed” (1=yes; 0=no). (mean = .15, s.d. = .35) History of economic hardship. Was there ever a time when you didn’t have enough money for clothes, food rent, bills or other necessary things like that? (1=yes; 0 =no) (mean =.41, s.d. = .49)
Creative work and autonomous work
We asked everyone in our sample how they spend their time on a daily basis. We asked employed persons to tell about their paid jobs and asked others to tell about the work, tasks or activities that they mostly do during the day. Creative work is non-routine, enjoyable, and provides opportunity for learning and solving problems. To measure non-routine work, respondents were asked whether their work or daily tasks involve 1) "doing the same thing in the same way repeatedly," as compared with 2) "the same thing in a number of different ways," or "a number of different kinds of things". Enjoyable work is measured as the amount of agreement with the statement, "My work (daily activities) gives me a chance to do things I enjoy.” Problem-solving is measured as the amount of agreement with the statement, "In my work (daily activities), I have to figure out how to solve problems." Learning is measured as the amount of agreement with the statement, "My work (daily activities) gives me a chance to develop and to learn new things." Responses to the three questions are coded −2) strongly disagree, −1) disagree, 1) agree, or 2) strongly agree. (Mean = 0, s.d. = 1.7) Creative work is the mean response to the four questions. (Scale mean = .93. s.d. = .80). Autonomous work includes decision-making autonomy and freedom from supervision. To measure decision-making autonomy respondents were asked, "Some people have supervisors or someone else who tells them what to do, while others make their own decisions. Who usually decides how you will do your work (daily activities)? Who usually decides what you will do in your work (daily activities)?" Responses to the two questions were coded 1) someone else decides, 2) you and someone else decide about equally, or 3) you decide. The two questions were summed. To measure freedom from supervision respondents were asked, "How free do you feel to disagree with the person who supervises your work (daily activities)?" Responses coded 1) not at all free, 2) somewhat free, 3) largely but not completely free, 4) completely free, 5) no one supervises my work. Z-scores of decision-making autonomy and freedom from supervision were summed.(scale mean = 0, s.d. = 1.7)
Employment status (1 = employed full or part-time; 0 otherwise). Mean = .67, s.d. = .47.
Household income in thousands of dollars. Mean = 48.27, s.d. = 44.43.
| Sense of Personal Control (Mirowsky-Ross Scale 1991). |
| Internal |
| Control Over Good: |
| (1) "I am responsible for my own successes" |
| (2) "I can do just about anything I really set my mind to" |
| Control Over Bad: |
| (3) "My misfortunes are the result of mistakes I have made" |
| (4) "I am responsible for my failures" |
| External |
| Powerless Over Good: |
| (5) "The really good things that happen to me are mostly luck" |
| (6) "There's no sense planning a lot -- if something good is going to happen it will" |
| Powerless Over Bad: |
| (7) "Most of my problems are due to bad breaks" |
| (8) "I have little control over the bad things that happen to me" |
Coded 2 = strongly agree, 1 = agree, 0 = neutral, −1 = disagree, −2 = strongly disagree for internal items and reverse for external. The 2 × 2 index balances statements claiming or denying control over good or bad outcomes, which eliminates defense and agreement bias from the measure of perceived powerlessness (Mirowsky and Ross 1991). Control scale scored −2 to 2, mean= .733, s.d. = .506.
Health Lifestyle
Walking is the number of days walked per week in response to open-ended question, How often do you take a walk? (Mean = 3.52, s.d. =3.47) Exercise is an index of moderate and strenuous exercise. Both are coded in number of days per week in response to open-ended questions: "How often do you do strenuous exercise such as running, basketball, aerobics, tennis, swimming, biking, and so on?" and "How often do you do moderate exercise like golf, bowling, dancing, gardening, or playing games with children?" Exercise index is the mean response. (Scale mean = 3.20, s.d. =3.54)
Smoking is coded 0 for never smoked, 1 for quitters, and 2 for current smokers. .79)(Mean = .73, s.d. =
Drinking is measured as frequency and quantity based on two questions: "On average, how often do you drink any alcoholic beverages such as beer, wine, or liquor?"(coded in number of days per week based on open-ended responses) and "On the days that you drink, on average, how many alcoholic drinks do you have?" (coded as the number of drinks per day (from a low of 0 for nondrinkers to a high of 25 drinks per day)). Quantity/frequency scores multiply the number of days per week a person drinks times the number of drinks reported for the average day. Scores are categorized. Initial analysis showed that the effect of drinking was non-linear, with both abstainers and heavy drinkers reporting worse health than moderate drinkers (those who drink up to 4 drinks a day, which is 54 percent of the sample, s. d. =.49)). Moderate drinkers are scored 1 and compared with abstainers (never drink or drink less than one drink per year) and heavy drinkers (drink more than 4 drinks a day).
Degree of overweight is Body Mass Index (BMI) of weight relative to height (kg/m2), coded from low to high levels of overweight. The average BMI is 25.535 (s.d. = 4.64); 26.239 for men and 25.040 for women. Thirty percent of the sample scores 27 or higher. The average man is 5'10" and weighs 183.9 lbs.; the average woman is 5'4" and weighs 145.9 lbs.
Health lifestyle scale. Scale adding walking, exercising, and moderate drinking, and subtracting smoking and overweight, after transforming each to a z score with a mean of 0 and a standard deviation of 1. The scale mean = 0, s.d.= 2.44.
Sociodemographic Control Variables
Age in number of years. Mean = 45.1, s.d. = 17.0.
Sex (1 = female; 0 = male). Mean = .58, s.d. = .49.
Race (1 = white; 0 = non-white). Mean = .84, s.d. = .36.
Marital status (1 = married or living together as married; 0 otherwise). Mean = .56, s.d. = .50.
Footnotes
Publisher's Disclaimer: This is a PDF file of an unedited manuscript that has been accepted for publication. As a service to our customers we are providing this early version of the manuscript. The manuscript will undergo copyediting, typesetting, and review of the resulting proof before it is published in its final citable form. Please note that during the production process errors may be discovered which could affect the content, and all legal disclaimers that apply to the journal pertain.
Formally, in structural amplification the mediator of an effect is also a moderator of the effect (Ross, Mirowsky, & Pribesh 2001). Mediators are a consequence of an exogenous variable and a cause of a dependent variable, thereby linking social conditions to outcomes. Moderators, or modifiers (specified as interaction terms) modify associations between social conditions and outcomes, making the associations between exogenous and dependent variables stronger or weaker, depending on their level (Aiken & West, 1991; Baron & Kenny, 1986; Mirowsky, 1999). Sometimes moderators buffer undesirable effects (Wheaton 1985), but in structural amplification, moderators amplify ill effects, making them worse. Most importantly, when moderators of the association between a social condition and health result from the condition itself, this produces structural amplification
REFERENCES
- Aiken LS, West SG. Multiple Regression: Testing and Interpreting Interactions. Newbury Park, CA: Sage; 1991. [Google Scholar]
- Baron RM, Kenny DA. The Moderator-Mediator Variable Distinction in Social Psychological Research: Conceptual, Strategical, and Statistical Considerations. Journal of Personality and Social Psychology. 1986;51:1173–1182. doi: 10.1037//0022-3514.51.6.1173. [DOI] [PubMed] [Google Scholar]
- Flay BR, D’Avernas J, Best A, Kersell MW, Ryan KB. Cigarette Smoking: Why Young People Do It. In: McGrath P, Firestone P, editors. Pediatric Adolescent Behavioral Medicine. NY: Springer-Verlag; 1983. pp. 132–183. [Google Scholar]
- Greenlund KJ, Liu K, Dyer AR, Kiefe CI, Burke GL, Yunis C. Body Mass Index in Young Adults: Associations with Parental Body Size and Education in the CARDIA Study. American Journal of Public Health. 1996;86:480–485. doi: 10.2105/ajph.86.4.480. [DOI] [PMC free article] [PubMed] [Google Scholar]
- Hayward MD, Gorman BK. The Long Arm of Childhood: The Influence of Early-Life Social Conditions on Men’s Mortality. Demography. 2004;41:87–107. doi: 10.1353/dem.2004.0005. [DOI] [PubMed] [Google Scholar]
- Hyman HH, Wright CR, Reed JS. The Enduring Effects of Education. Chicago: University of Chicago Press; 1976. [Google Scholar]
- Kandel DB, Ping Wu P. The Contribution of Mothers and Fathers to the Intergenerational Transmission of Cigarette Smoking in Adolescence. Journal of Research on Adolescence. 1995;5:225–252. [Google Scholar]
- Kingston PW, Hubbard R, Lapp B, Schroeder P, Wilson J. Why Education Matters. Sociology of Education. 2003;76:53–70. [Google Scholar]
- Kohn M, Slomczynski KM. Social Structure and Self-Direction. A Comparative Analysis of the United States and Poland. Cambridge, MA: Blackwell; 1993. [Google Scholar]
- Lauderdale DS. Education and Survival: Birth Cohort, Period, and Age Effects. Demography. 2001;38:551–561. doi: 10.1353/dem.2001.0035. [DOI] [PubMed] [Google Scholar]
- Lynch SM. Cohort and Life-Course Patterns in the Relationship Between Education and Health: A Hierarchical Approach. Demography. 2003;42:309–331. doi: 10.1353/dem.2003.0016. [DOI] [PubMed] [Google Scholar]
- Mirowsky J. Analyzing associations between social circumstances and mental health. In: Aneshensel C, Phelan J, editors. Handbook on the Sociology of Mental health. NY: Kluwer/Plenum; 1999. pp. 105–123. [Google Scholar]
- Mirowsky J, Kim J. Graphing Age Trajectories: Vector Graphs, Synthetic and Virtual Cohort Projections, and Cross-Sectional Profiles of Depression. Sociological Methods and Research. 2007;35:497–541. [Google Scholar]
- Mirowsky J, Ross CE. Eliminating Defense and Agreement Bias from Measures of Sense of Control: a 2×2 Index. Social Psychology Quarterly. 1991;54:127–145. [Google Scholar]
- Mirowsky J, Ross CE. Education, Personal Control, Lifestyle and Health: A Human Capital Hypotheses. Research on Aging. 1998;20:415–449. [Google Scholar]
- Mirowsky J, Ross CE. Social Causes of Psychological Distress. NY: Aldine de Gruyter; 1989. [Google Scholar]
- Mirowsky J, Ross CE. Education, Social Status, and Health. NJ: Aldine Transaction; 2003. [Google Scholar]
- Mirowsky J, Ross CE. Education, Learned Effectiveness, and Health. London Review of Education. 2005;3:205–220. [Google Scholar]
- Mirowsky J, Ross CE, Reynolds JR. Links Between Social Status and Health Status. In: Bird CE, Conrad P, Fremont AM, editors. The Handbook of Medical Sociology. 5th Edition. Upper Saddle River, NJ: Prentice Hall; 2000. pp. 47–67. [Google Scholar]
- Nagi SZ. An Epidemiology of Disability among Adults in the United States. Milbank Memorial Fund Quarterly. 1976;54:439–468. [PubMed] [Google Scholar]
- O’Rand AM. The Precious and the Precocious: Understanding Cumulative Disadvantage and Cumulative Advantage Over the Life Course. The Gerontologist. 1996;36:230–238. doi: 10.1093/geront/36.2.230. [DOI] [PubMed] [Google Scholar]
- Pascarella ET, Terenzini PT. How College Affects Students. San Francisco: Josey-Bass; 1991. [Google Scholar]
- Pearlin LI, Lieberman MA, Menaghan EG, Mullan JT. The Stress Process. Journal of Health and Social Behavior. 1981;22:337–356. [PubMed] [Google Scholar]
- Rogers RA, Hummer RA, Nam CB. Living and Dying in the U.S. NY: Academic; 1999. [Google Scholar]
- Ross CE, Mirowsky J. Refining the Association between Education and Health: Effects of Quantity, Credential, and Selectivity. Demography. 1999;36:445–460. [PubMed] [Google Scholar]
- Ross CE, Mirowsky J. Sex Differences in the Effect of Education on Depression: Resource Multiplication or Resource Substitution? Social Science & Medicine. 2006;63:1400–1413. doi: 10.1016/j.socscimed.2006.03.013. [DOI] [PubMed] [Google Scholar]
- Ross CE, Mirowsky J. Gender and the Health Benefits of Education. The Sociological Quarterly. 2010;51:1–19. doi: 10.1111/j.1533-8525.2009.01164.x. [DOI] [PMC free article] [PubMed] [Google Scholar]
- Ross CE, Mirowsky J, Pribesh S. Powerlessness and The Amplification of Threat: Neighborhood Disadvantage, Disorder, and Mistrust. American Sociological Review. 2001;66:568–591. [Google Scholar]
- Ross CE, Van Willigen M. Education and the Subjective Quality of Life. Journal of Health and Social Behavior. 1997;38:275–297. [PubMed] [Google Scholar]
- Ross CE, Wu C-l. The Links between Education and Health. American Sociological Review. 1995;60:719–745. [Google Scholar]
- Ross CE, Wu C-l. Education, Age, and the Cumulative Advantage in Health. Journal of Health and Social Behavior. 1996;37:104–120. [PubMed] [Google Scholar]
- Seeman M, Seeman TE. Health Behavior and Personal Autonomy: A Longitudinal Study of the Sense of Control in Illness. Journal of Health and Social Behavior. 1983;24:144–160. [PubMed] [Google Scholar]
- Seeman M, Lewis S. Powerlessness, Health and Mortality: A Longitudinal Study of Older Men and Mature Women. Social Science & Medicine. 1995;41:517–526. doi: 10.1016/0277-9536(94)00362-w. [DOI] [PubMed] [Google Scholar]
- Spaeth JL. Cognitive Complexity: A Dimension Underlying the Socioeconomic Achievement Process. In: Sewell WH, Hauser RM, Featherman DL, editors. Schooling and Achievement in American Society. NY: Academic; 1976. pp. 103–131. [Google Scholar]
- U.S. Bureau of the Census. The Statistical Abstract of the United States 1995. Washington, D.C: U.S. Government Printing Office; 1995. [Google Scholar]
- Williams D. Socioeconomic Differentials in Health: A Review and Redirection. Social Psychology Quarterly. 1990;53:81–99. [Google Scholar]
- Wheaton B. The Sociogenesis of Psychological Disorder: An Attributional Theory. Journal of Health and Social Behavior. 1980;21:100–124. [PubMed] [Google Scholar]
- Wheaton B. Models for the Stress-Buffering Functions of Coping Resources. Journal of Health and Social Behavior. 1985;26:352–364. [PubMed] [Google Scholar]
Associated Data
This section collects any data citations, data availability statements, or supplementary materials included in this article.