Abstract
The mammalian constitutive photomorphogenesis 9 (COP9) signalosome (CSN), a protein complex involved in embryonic development, is implicated in cell cycle regulation and the DNA damage response. Its role in tumor development, however, remains unclear. Here, we have shown that the COP9 subunit 6 (CSN6) gene is amplified in human breast cancer specimens, and the CSN6 protein is upregulated in human breast and thyroid tumors. CSN6 expression positively correlated with expression of murine double minute 2 (MDM2), a potent negative regulator of the p53 tumor suppressor. Expression of CSN6 appeared to prevent MDM2 autoubiquitination at lysine 364, resulting in stabilization of MDM2 and degradation of p53. Mice in which Csn6 was deleted died early in embryogenesis (E7.5). Embryos lacking both Csn6 and p53 survived to later in embryonic development (E10.5), which suggests that loss of p53 could partially rescue the effect of loss of Csn6. Mice heterozygous for Csn6 were sensitized to γ-irradiation–induced, p53-dependent apoptosis in both the thymus and the developing CNS. These mice were also less susceptible than wild-type mice to γ-irradiation–induced tumorigenesis. These results suggest that loss of CSN6 enhances p53-mediated tumor suppression in vivo and that CSN6 plays an important role in regulating DNA damage–associated apoptosis and tumorigenesis through control of the MDM2-p53 signaling pathway.
Introduction
The constitutive photomorphogenesis 9 (COP9) signalosome (CSN) was originally identified from Arabidopsis mutants that mimic light-induced seedling development when grown in the dark (1). The mammalian COP9 contains 8 subunits, which share sequence homology with subunits of the “lid” complex of the 26S proteasome (2). Indeed, CSN serves as a platform to coordinate ubiquitination signaling (3). For instance, COP9 binds cullin-based E3 ubiquitin ligases and has associated deneddylation activity toward cullins, thereby regulating E3 activity (4). Cullin-based E3 ligases are important for degradation of key oncogenes or tumor suppressors during the cell cycle (5), DNA damage response (6), apoptosis (7), and tumorigenesis (8).
Although CSN is involved in regulating various biological processes, individual subunits of COP9 have been suggested to modulate different physiological functions. CSN1, CSN2, CSN3, CSN4, CSN7, and CSN8 contain a proteasome, COP9 signalosome, translation initiation factor (PCI) domain, which serves as a scaffold in CSN assembly. CSN5 contains a Mpr1p and Pad1p N-terminal (MPN) domain with a Jab1/MPN metalloenzyme (JAMM) submotif. The molecular function of CSN5 is involved in regulating deneddylation processes through this JAMM submotif (9). Additionally, CSN6 holds a non–JAMM motif–containing MPN domain, which suggests that CSN6 has a unique function as distinct from other subunits. To understand the biological function of each subunit, several studies using knockout technology demonstrated that several murine COP9 subunits are involved in embryonic development. For example, targeted disruption of Csn2 (10), Csn3 (11), Csn5 (12), and Csn8 (13) resulted in embryonic lethality. Although antisense-mediated CSN6 knockdown in mammalian cells showed the requirement of CSN6 for cell growth (14), in vivo biological function of CSN6 is still unclear. CSN6 is mapped to 7q22, where amplification is frequently observed in esophageal squamous cell carcinoma (15), breast cancer (16), pancreatic carcinoma (17), and T cell leukemia (18). Thus, we speculate CSN6 might have a substantial role in regulating tumor development.
Levels of the p53 protein are predominantly regulated by its proteolytic turnover. The key molecule controlling the short half-life of p53 is MDM2, one of the most important RING domain–containing E3 ubiquitin ligases (19). Basically, MDM2 ubiquitinates p53 at several lysine residues, which causes p53 degradation (20). MDM2 also serves as its own E3 ligase and degrades itself by autoubiquitination (21). After DNA damage, such as γ-irradiation (γ-IR), MDM2 is autopolyubiquitinated, then degraded, which associates with the increase in p53 levels and activity (22), although this mechanism is not observed in all types of DNA damage or stress signals (23).
About half of human cancers contain mutated p53; defects in activating a retained wild-type p53 were often found in the remainder. At the same time, overexpression of MDM2 is found in a wide variety of human tumors, most of which still retain wild-type p53 (24). This evidence led to the hypothesis that overexpression of MDM2 could inactivate p53 in the process of transformation. Although gene amplification (25, 26) or enhanced transcription or translation (26) might result in upregulation of MDM2, it remains elusive whether increased MDM2 protein stability contributes to the elevated MDM2 levels seen in cancers, since MDM2 has a very short half-life. MDM2 might have oncogenic activity independent of its inhibition of p53, for example, via tumor suppressors FOXO3a (27) and E-cadherin (28). Therefore, the regulatory mechanisms of MDM2 are worth investigation, and MDM2 itself could be a target for chemotherapeutic intervention for cancer (29).
To investigate the relevance of CSN6 to cancer development, we first evaluated primary specimens of breast cancer and thyroid tumors. CSN6 gene copy number was amplified in a high percentage of primary breast cancer samples and positively correlated with tumor size at the time of diagnosis. Immunoblotting studies revealed that thyroid carcinomas expressed higher levels of CSN6 than did benign thyroid lesions and tissues, and there was a positive correlation between the expression levels of MDM2 and CSN6. Further analyses showed that CSN6 directly interacted with MDM2 and positively regulated the stability of MDM2 and consequently accelerated the degradation of p53. To gain insight into the physiological significance of this oncogenic role of CSN6, we generated Csn6-depleted mice. Complete loss of Csn6 resulted in embryonic lethality, and Csn6-heterozygous mice were less susceptible to γ-IR–induced tumorigenesis. Together, our findings indicate that CSN6 is an oncogene with positive activity toward MDM2 and that the effect of CSN6 on the MDM2-p53 axis is important for DNA damage response and tumorigenesis.
Results
Amplification of CSN6 genomic loci in primary breast cancer.
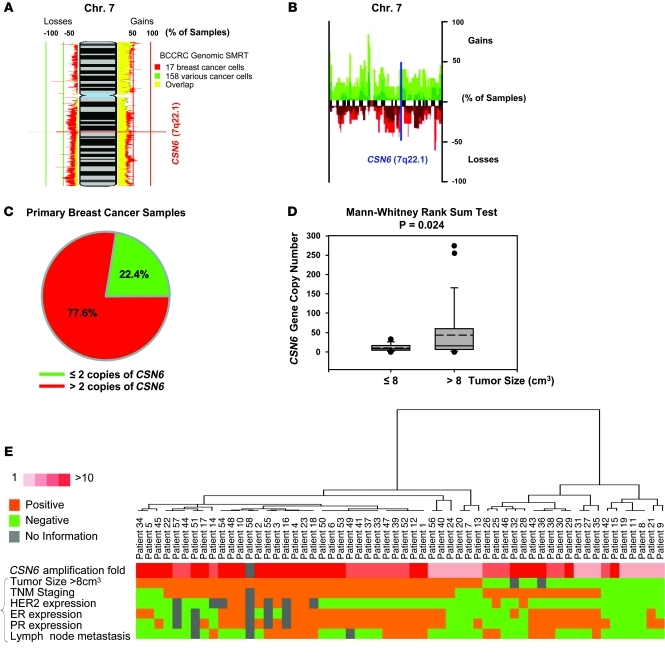
Identification of chromosomal variation in terms of gene copy number is important to understand the involvement of genes in tumorigenesis. Submegabase resolution tiling (SMRT) for comparative genomic hybridization (CGH) array technology has provided comprehensive assessment of genome integrity. We used the System for Integrative Genomic Microarray Analysis (SIGMA; ref. 30) to evaluate genetic loss or gain of CSN6 using data from the British Columbia Cancer Agency Research (BCCRC) SMRT arrays. Allelic gain of CSN6 loci (7q22.1) occurred in 17 breast cancer cell lines and 158 other types of cancer cells (Figure 1A). We found a substantial percentage of samples that had amplification of the CSN6 genomic region in a different CGH analysis data set (Figure 1B and ref. 31). We experimentally confirmed the amplification of CSN6 gene in our collection of 58 breast cancer samples using quantitative PCR. Amplification of CSN6 was detected in 77.6% of this collection of samples (45 of 58; Figure 1C). Univariate analysis showed that there was a significant positive correlation between CSN6 gene copy number and tumor size at the time of surgical resection (P = 0.024; Figure 1, D and E). In univariate as well as multivariate analyses, no significant associations were found between CSN6 gene copy number and ER expression, PR expression, HER2 overexpression, or lymph node metastasis (P > 0.05; Figure 1E). These results suggest that CSN6 may function as an oncogene to provide growth advantage, as reflected by increase in tumor size.
Figure 1. Amplification of CSN6 gene copy number in human breast cancers.
(A) SIGMA analysis of the CSN6 gene loci was performed on a CGH data set of BCCRC SMRT arrays. 100%, gain of that locus in all samples; –100%, loss of that locus in all samples. (B) Regions of gains and loss (at 0.9 megabase resolution) across chromosome 7 in a set of 47 primary breast cancer samples and 18 breast cancer cell lines are shown. Figure adapted from Breast Cancer Research (31). Red, recurrent loss, green, recurrent gain. (C) CSN6 gene copies were assessed in a cohort of 58 primary human breast cancer genomic DNA samples, and the frequency of human breast cancer samples with or without CSN6 gene amplification is shown. (D) Amplification of the CSN6 gene was associated with tumor size larger than 8 cm3 at the time of surgical resection in the cohort examined in C. Bounds of the boxes denote interquartile range; solid and dashed lines denote median and mean, respectively; whiskers denote 90% and 10%; symbols denote outliers. (E) Hierarchical clustering was performed on the cohort examined in C with the indicated pathological and genomic markers; data are presented as a heat map.
Dysregulated CSN6 and MDM2 expression in human tumors.
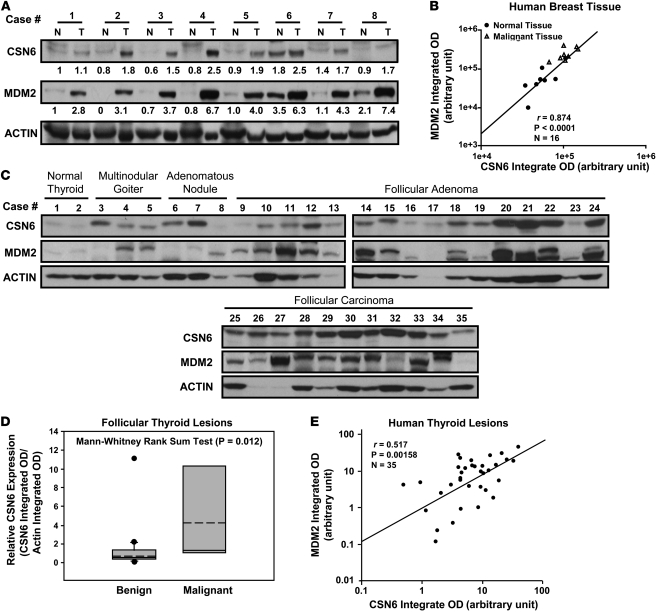
Given that CSN6 is one of the 2 subunits that contain an MPN domain, which may directly regulate E3 ubiquitin ligase function (4), we examined the possible regulation of ubiquitin ligases important for tumorigenesis by CSN6. Surprisingly, the expression of MDM2 paralleled the levels of CSN6 protein in 20 human breast cell lines (Supplemental Figure 1; supplemental material available online with this article; doi: 10.1172/JCI44111DS1). Studying the expression of MDM2 and CSN6 in matched normal and cancerous breast tissues, we found that 6 of 8 cancer samples had higher levels of CSN6 than matched normal tissues, and high expression of MDM2 positively correlated with high levels of CSN6 protein (Figure 2, A and B, and Supplemental Figure 1A). We further examined a different collection of 18 breast cancer samples and confirmed that CSN6 was elevated in a high percentage with concurrent MDM2 overexpression (9 of 18; Supplemental Figure 2). In this set of 9 samples, we found amplification of the CSN6 gene in 6 samples, 5 of which had no MDM2 gene amplification or p53 gene mutation or deletion (Supplemental Table 1). These results strongly suggest that CSN6 positively correlates with MDM2 overexpression without MDM2 gene amplification and without p53 gene alterations.
Figure 2. Overexpression of both CSN6 and MDM2 in human breast cancer and follicular thyroid carcinoma.
(A) Expression status of CSN6 and MDM2 in matched normal (N) and cancerous (T) regions isolated from breast cancer patients. Protein amounts (relative to the integrated OD of the actin band) are shown below each CSN6 and MDM2 band. (B) Integrated OD of MDM2 bands in A versus that of the CSN6 bands from the corresponding sample. There was a positive correlation between CSN6 and MDM2 in terms of protein levels. (C) Human thyroid tissue samples were analyzed for expression of MDM2 and CSN6 proteins. 10 cases of follicular carcinomas, 22 cases of benign thyroid lesions, and 2 samples of normal thyroid tissue were analyzed. (D) Integrated OD of CSN6 bands in C. CSN6 expression (relative to actin) in benign thyroid tissues and malignant follicular thyroid samples is shown. Bounds of the boxes denote interquartile range; solid and dashed lines denote median and mean, respectively; whiskers denote 90% and 10%; symbols denote outliers. (E) Scatter plot of the integrated OD of MDM2 bands in C versus that of CSN6 bands from the corresponding thyroid tissue sample. There was a positive correlation between CSN6 and MDM2 in terms of protein levels.
To investigate whether this occurs in other types of cancers, we compared malignant follicular thyroid carcinomas with benign thyroid lesions (follicular adenomas, adenomatous nodules, and multinodular goiters) and normal thyroid tissue. The carcinomas expressed higher levels of CSN6 than did benign lesions and tissues, and there was a positive correlation between the expression levels of MDM2 and CSN6 (Figure 2, C–E). Based on these observations, we postulated that CSN6 might contribute to tumor development in multiple cancer types through modulating MDM2.
Promotion of tumorigenesis by CSN6 through regulating the p53-MDM2 axis.
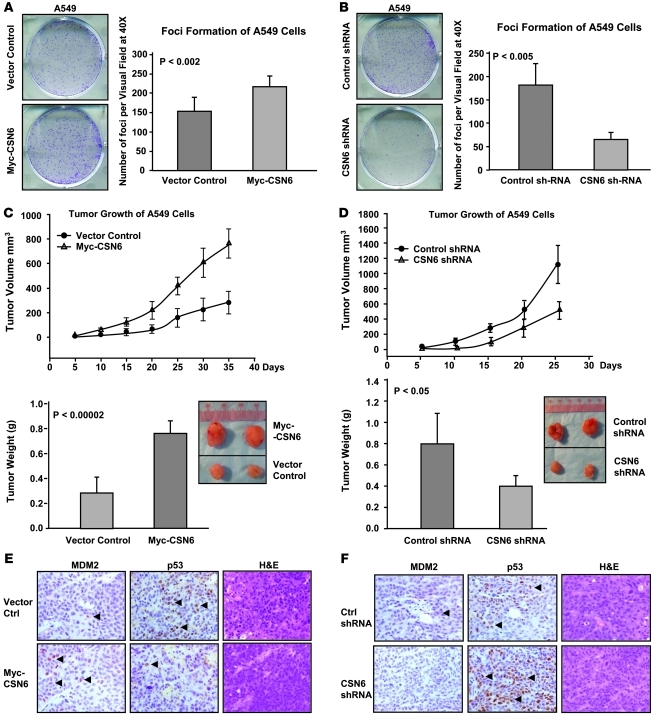
Based on observations in clinical samples, we investigated the role of CSN6 in tumorigenesis in the xenograft cancer model. Wild-type p53–containing A549 cells were used to address whether overexpression or downregulation of CSN6 affects tumorigenesis. Overexpression of CSN6 in A549 cells increased cell foci formation, tumor growth rate, and tumor weight compared with vector control–transfected cells (Figure 3, A and C). Conversely, knockdown of CSN6 using shRNA in A549 cells decreased cell foci formation, tumor growth rate, and tumor weight compared with control shRNA–expressing cells (Figure 3, B and D). We examined the protein expression of MDM2 and p53 in tumors isolated from nude mice by immunohistochemistry. There were more MDM2-positive signals, yet fewer p53 signals, in CSN6-overexpressing tumors than in controls (Figure 3E). On the other hand, no MDM2-positive signal was detected in CSN6-depletion tumors, whereas there was substantially increased p53 staining in the samples (Figure 3F). These data suggest that CSN6 promotes tumorigenesis through regulating MDM2 and p53 protein levels.
Figure 3. CSN6 promotes tumorigenesis by regulating the p53-MDM2 axis.
(A) Overexpression of CSN6 promoted the cell transformation. Myc-CSN6–overexpressing A549 stable transfectants and vector controls were subjected to microfoci formation assay. Number of colonies per field was measured. P values were determined by 2-tailed t test. (B) Knockdown of CSN6 inhibited the cell transformation. CSN6 shRNA or control shRNA A549 stable transfectants were subjected to microfoci formation assay. Number of colonies per field was measured. (C) Overexpression of CSN6 promoted tumorigenicity. Myc-CSN6–overexpressing A549 stable transfectants and vector controls were subcutaneously injected into nude mice. Tumor growth curves are shown. Tumors were isolated at the end of the assay, and the tumor weight of each group was measured. Representative tumor sizes are shown. (D) Knockdown of CSN6 inhibited tumorigenicity. CSN6 shRNA or control shRNA A549 stable transfectants were subcutaneously injected into nude mice. Tumor growth curves are shown. Tumors were isolated at the end of the assay, and the tumor weight of each group was measured. Representative tumor sizes are shown. (E) Overexpression of CSN6 enhanced MDM2 expression, but decreased p53 expression, in tumors. Tumors were collected as described in C. Representative tumor sections are shown (original magnification, ×200). (F) Knockdown of CSN6 diminished MDM2 expression, but enhanced p53 expression, in tumors. Tumors were collected as described in D. Representative tumor sections are shown (original magnification, ×200).
Stabilization of MDM2 by CSN6.
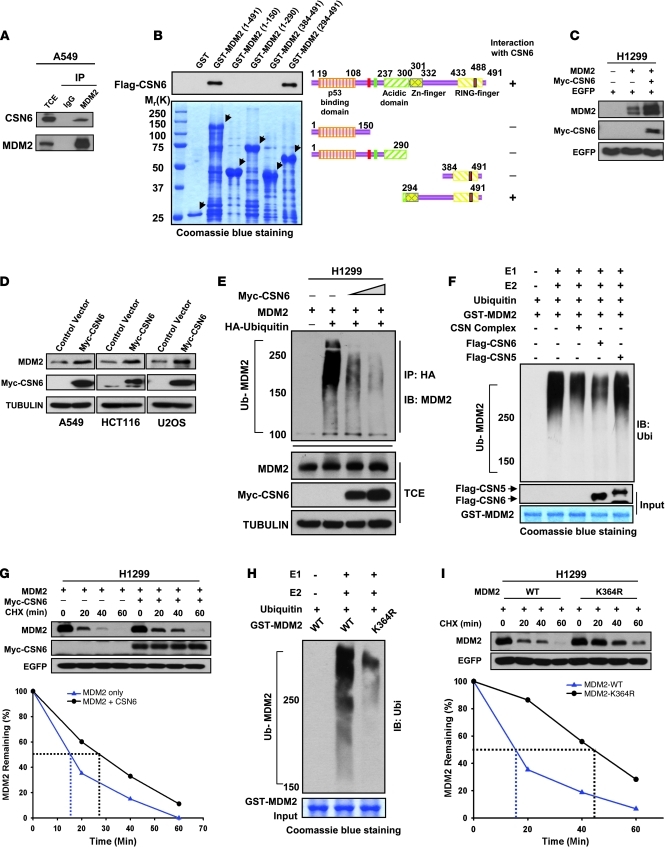
The above observation prompted us to investigate whether CSN6 has any direct effect on MDM2. Coimmunoprecipitation showed association between CSN6 and MDM2 (Figure 4A). Mapping the binding region of MDM2 on CSN6 revealed that the C-terminal region of MDM2 (aa 294–384) bound to CSN6 efficiently (Figure 4B). Interestingly, several proteins have previously been shown to regulate MDM2 function through binding this region (32–35). We found that the protein level of MDM2 increased when CSN6 expression was enforced in both transient transfection and stable transfectants (Figure 4, C and D). Given that the modulation of MDM2 level largely relies on ubiquitination-mediated degradation (21), we performed ubiquitination assay; the amounts of polyubiquitinated MDM2 fell dramatically when CSN6 was increased (Figure 4E). Next, we investigated whether deubiquitinating enzymes, such as USP15 (36) or USP2 (37), are involved in the CSN6-mediated decrease of MDM2 ubiquitination. Knockdown of USP15 resulted in an obvious increase of MDM2, whereas knockdown of USP2 led to the degradation of MDM2 (Supplemental Figure 3A). However, CSN6 still had the capability to stabilize MDM2 regardless of the depletion of either USP2 or USP15 (Supplemental Figure 3B). To gain insight into the mechanism by which CSN6 regulates MDM2 ubiquitination, we performed gel filtration chromatography to fractionate different portions of CSN and identified the free-form CSN6 within A549 cells (Supplemental Figure 4A). The aliquot of free-form CSN6-containing fraction from wild-type A549 lysate, but not from CSN6-depleted cells, strongly inhibited MDM2 polyubiquitination in an in vitro ubiquitination assay (Supplemental Figure 4B). In addition, the purified recombinant CSN6 protein, but not CSN5 protein, efficiently reduced the polyubiquitination level of MDM2 in vitro (Figure 4F), which suggests that CSN6 alone is able to affect MDM2 autoubiquitination directly. Consistently, MDM2 had a longer half-life in the presence of exogenous CSN6 (Figure 4G). We used mass spectrometry analysis to identify lysine 364 as the MDM2 autoubiquitination site (Supplemental Figure 5), located within the interaction region between CSN6 and MDM2. The K364R MDM2 mutant showed dramatic reduction of autoubiquitination both in vitro and in vivo (Figure 4H and Supplemental Figure 6). Furthermore, the K364R MDM2 mutant had a longer half-life than did wild-type MDM2 (Figure 4I). This evidence strongly supports the possibility that interaction between CSN6 and MDM2 blocks the autoubiquitination and degradation of MDM2. These findings provide a mechanistic explanation for the coexistence of high levels of MDM2 and CSN6 we observed in human cancer tissues and xenograft tumor samples (Figures 2 and 3).
Figure 4. CSN6 increases the stability of MDM2.
(A) CSN6 interacted with MDM2. Lysates of A549 cells were immunoprecipitated and analyzed with the indicated antibodies. TCE, total cellular extracts. (B) Mapping of the CSN6 binding region within MDM2. Purified GST-MDM2 domains and Flag-CSN6 were subjected to GST-pulldown assay. Specific interactions of MDM2 deletions with CSN6 are indicated. (C) Ectopic expression of CSN6 increased the steady-state protein level of MDM2. EGFP served as a transfection efficiency control as well as a loading control. (D) Enforced expression of CSN6 increased the protein level of MDM2. Myc-CSN6–overexpressing A549, HCT116, and U2OS stable transfectants and vector controls were checked for endogenous MDM2 expression. (E) CSN6 diminished the ubiquitination level of MDM2 in vivo. HA-ubiquitinated MDM2 was immunoprecipitated with anti-HA, then probed with anti-MDM2. Equal amounts of TCE were immunoblotted with the indicated antibodies. (F) CSN6 reduced the ubiquitination level of MDM2 in vitro. GST-MDM2 was incubated with purified Flag-CSN6 or Flag-CSN5 or CSN complex in the presence of E1, E2, and His-Ubiquitin as indicated. (G) CSN6 reduced MDM2 turnover. Cells were treated with 100 μg/ml CHX for the indicated durations. Integrated OD values of MDM2 at each time point were measured. Remaining MDM2 relative to time 0 (set at 100%) is indicated. (H) K364R mutation of MDM2 attenuated the autoubiquitination of MDM2 in vitro. Wild-type and K364R mutant GST-MDM2 or GST-MDM2 were incubated with E1, E2, and His-Ubiquitin as indicated. (I) K364R MDM2 mutant had an extended half-life compared with wild-type MDM2. Remaining MDM2 is indicated.
Biological effect of CSN6 on p53.
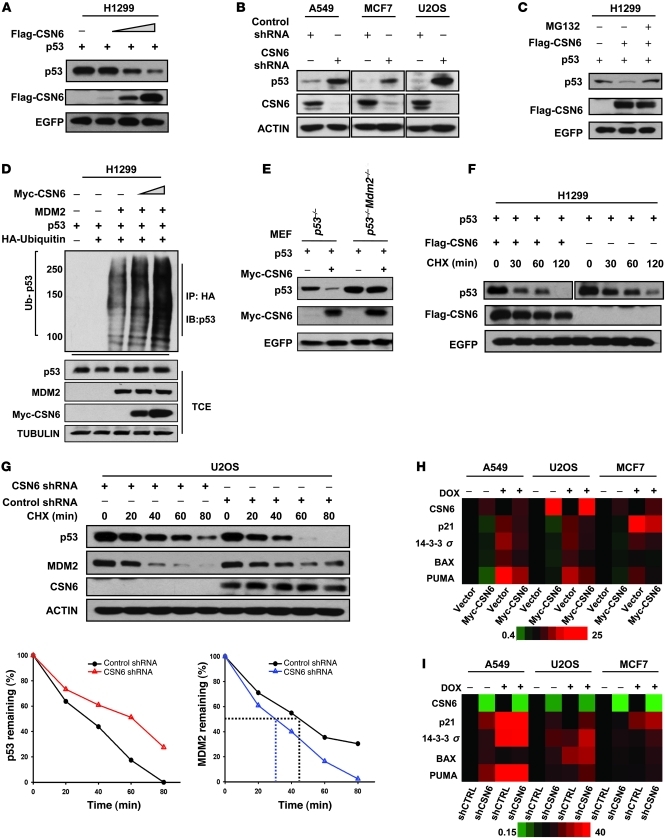
On the basis that CSN6 positively regulated MDM2, we further evaluated the biological impact of CSN6 on p53. Increase of CSN6 reduced steady-state levels of p53 in a dose-dependent manner (Figure 5A). Moreover, the levels of p53 were elevated when cells were subjected to shRNA-mediated knockdown of CSN6 (Figure 5B). In contrast, the mRNA levels of p53 and MDM2 were not affected by increasing amounts of CSN6 in a semiquantitative RT-PCR study (Supplemental Figure 7A), which suggests that CSN6 primarily regulated p53 and MDM2 posttranscriptionally. CSN6-mediated downregulation of p53 was prevented by the specific 26S proteasome inhibitor MG132 (Figure 5C), and increasing amounts of CSN6 caused enhanced p53 polyubiquitination (Supplemental Figure 7B). Moreover, CSN6 accelerated MDM2-mediated p53 ubiquitination in a dose-dependent manner (Figure 5D). CSN6 was not able to induce p53 degradation in Mdm2-null mouse embryonic fibroblasts (MEFs; Figure 5E), which suggests that CSN6-mediated degradation of p53 is MDM2 dependent. Accordingly, p53 turnover was more rapid in CSN6-transfected than in control cells, whereas depletion of CSN6 by shRNA shortened MDM2 protein half-life and prolonged p53 half-life (Figure 5, F and G, and Supplemental Figure 7C).
Figure 5. CSN6 facilitates the degradation of p53.
(A) CSN6 reduces the steady-state protein level of p53. Equal amounts of protein were analyzed with the indicated antibodies. (B) p53 protein level was upregulated with loss of CSN6. Protein levels of p53 and CSN6 were analyzed in various cells subjected to CSN6 shRNA or control shRNA. (C) Proteasome inhibitor blocked CSN6-mediated degradation of p53. H1299 cells were treated with or without proteasome inhibitor MG132 (50 μg/ml, 6 hours), then immunoblotted with the indicated antibodies. (D) CSN6 enhanced MDM2-mediated p53 ubiquitination. HA-ubiquitinated p53 was immunoprecipitated with anti-HA and probed with anti-p53. Equal amounts of TCE were immunoblotted with indicated antibodies. (E) CSN6-mediated destabilization of p53 is MDM2 dependent. p53–/– or p53–/–Mdm2–/– MEFs were transfected with the indicated plasmids, then analyzed with the indicated antibodies. (F) CSN6 increased the turnover rate of p53. H1299 cells were transfected with the indicated plasmids, then checked with the indicated antibodies. (G) CSN6 knockdown increased MDM2 turnover but reduced p53 turnover. U2OS cells were subjected to control shRNA or CSN6 shRNA. MDM2 or p53 remaining is indicated. (H) Enhanced expression of CSN6 impaired p53 transcriptional activation, as determined by quantitative RT-PCR in the presence or absence of DOX (1 μg/ml). Expression levels of the indicated p53 target genes were quantitated and presented as a heat map. (I) Knockdown of CSN6 potentiated p53 transcriptional activation, as determined by quantitative RT-PCR in the presence or absence of DOX (1 μg/ml). Expression levels of the indicated p53 target genes were quantitated and presented as a heat map.
To assess the functional significance of increased p53 degradation mediated by CSN6, we evaluated p53 transcriptional activity. CSN6 impaired the transcriptional activity of p53 in a p53-responsive luciferase reporter assay (Supplemental Figure 7D). In addition, we examined the expression of p53 transcriptional targets, including p21, 14-3-3σ, BAX, and PUMA, using quantitative RT-PCR in cells overexpressing CSN6 or cells with CSN6 knockdown. Overexpression of CSN6 via Myc-CSN6 attenuated the expression of p53 target genes, whereas CSN6 knockdown with CSN6 shRNA enhanced the expression of these genes (Figure 5, H and I). To study the expression of p53 target genes in response to DNA damage, we also treated these 2 sets of cells with the DNA-damaging agent doxorubicin (DOX). In this context, the effect of Myc-CSN6 or CSN6 shRNA on p53 target gene expression was similar to that in untreated cells (Figure 5, H and I), which suggests that CSN6-mediated attenuation of p53 transcriptional activity is also effective in response to DNA damage. Thus, the positive effect of CSN6 on MDM2 translated into enhancing p53 degradation and further antagonizing p53 transcriptional activity.
Embryonic lethality of Csn6-null mice.
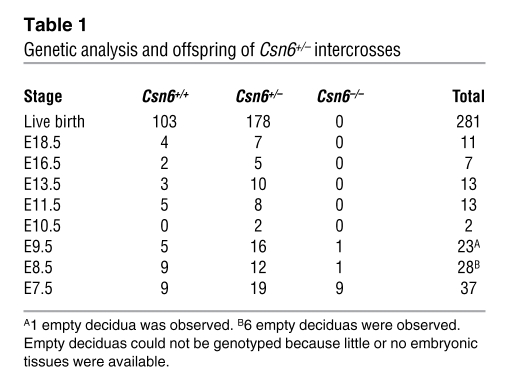
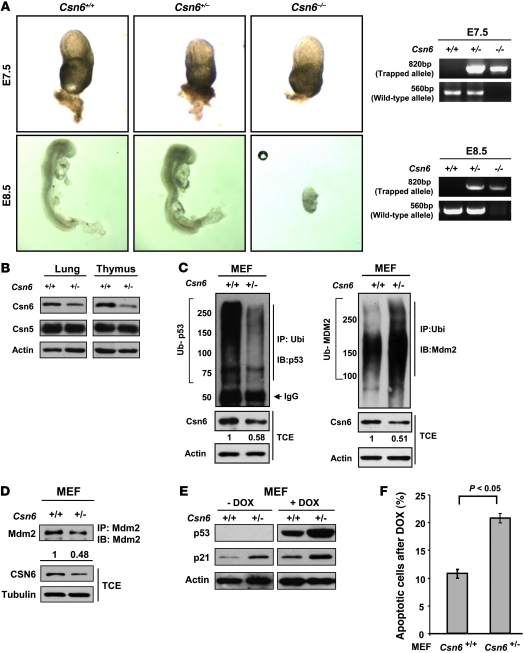
To evaluate the biological significance of CSN6-mediated regulation of the MDM2-p53 axis in vivo, we generated knockout mice carrying an insertional mutation of the Csn6 gene. Mouse ES cells harboring a insertional mutation in the mouse Csn6 gene were obtained from BayGenomics (38). We inserted a gene-trap vector into the ninth intron to disrupt the mouse Csn6 gene (Supplemental Figure 8A). Following standard procedures, we created Csn6-haplodeficient (Csn6+/–) mice, the genotypes of which were verified using Southern blot analysis (Supplemental Figure 8B). Breeding of Csn6+/– pairs did not result in progeny with homozygous deletion of Csn6 (Csn6–/–), suggestive of embryonic lethality of Csn6–/– mice (Table 1). We established timed Csn6+/– intercrosses and collected and dissected embryos between E7.5 and E18.5. Some Csn6–/– embryos were present at E7.5, but there were no such embryos between E8.5 and E18.5, although some empty deciduae were identifiable, the number of which approximated the expected number of Csn6–/– embryos (Figure 6A and Table 1). Csn6 protein levels were lower in various tissues, including the lung and thymus, of Csn6+/– mice than of wild-type (Csn6+/+) mice (Figure 6B), but no obvious physical, developmental and reproductive abnormalities were found in Csn6+/– mice.
Table 1 .
Genetic analysis and offspring of Csn6+/– intercrosses
Figure 6. Csn6-deficient mice die in early embryogenesis.
(A) Representative phenotypes of Csn6–/– mouse embryos at different embryonic stages. Note that the Csn6–/– embryo had normal size and appearance on E7.5, but empty deciduae with little embryonic tissue were found on E8.5. Representative PCR genotyping results of these embryos are shown. (B) Csn6 protein expression in representative tissues of Csn6+/– and Csn6+/+ mice. (C) Ubiquitination status of p53 and Mdm2 in primary Csn6+/– and Csn6+/+ MEFs. Polyubiquitinated p53 or polyubiquitinated Mdm2 was immunoprecipitated with anti-p53 or anti-Mdm2, then probed with anti-ubiquitin. Equal amounts of TCE were immunoblotted with the indicated antibodies. (D) Reduced Mdm2 protein level in Csn6+/– MEFs. Endogenous Mdm2 was immunoprecipitated from primary MEFs, then probed with anti-Mdm2. Equal amounts of TCE were immunoblotted with the indicated antibodies. (E) Loss of Csn6 sensitized MEF cells to DOX-induced activation of p53. Primary MEFs from the same littermates were treated with and without DOX (1 μg/ml). Equal amounts of proteins from cell lysates were immunoblotted with the indicated antibodies. (F) Csn6 haploinsufficiency sensitized MEFs to DOX-induced apoptosis. Percent apoptotic population in each group was measured. P values were determined by 2-tailed t test.
We also investigated the effect of Csn6 haploinsufficiency on the Mdm2-p53 axis by studying the ubiquitination of p53 and Mdm2 in MEFs. Polyubiquitination of p53 was reduced, whereas polyubiquitination of Mdm2 increased, in Csn6+/– compared with Csn6+/+ MEFs (Figure 6C). Consistently, the level of Mdm2 protein was lower in Csn6+/– MEFs (Figure 6D). We further determined p53 expression after DOX treatment in MEFs. Although there was some increase in p21 protein levels in Csn6+/+ MEFs after induction of p53 by DOX treatment, levels of p53 and p21 induction were markedly increased in Csn6+/– compared with Csn6+/+ MEFs (Figure 6E). Since p21 mRNA expression was higher in Csn6+/– than in Csn6+/+ MEFs (Supplemental Figure 8C), we concluded that p53 transcriptional activity was elevated in Csn6+/– MEFs. This increased activity of p53 in the Csn6+/– MEFs led to more apoptotic cells, as assayed by FACS analysis, in response to either DOX treatment or γ-IR (Figure 6F and Supplemental Figure 8, D and E).
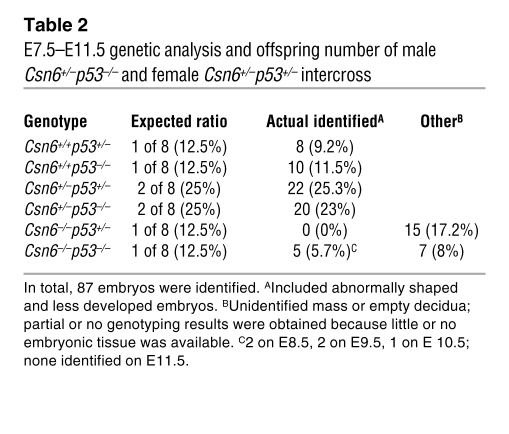
Because we found increased activity of p53 in Csn6+/– MEFs, we next sought to determine whether the embryonic lethality of Csn6-null mice could be rescued by concomitant loss of p53. We analyzed mice born from a cross between Csn6+/– and p53+/– mice, but could not identify any Csn6–/–p53–/– mice (Supplemental Table 2). We then established timed crosses and examined embryos between E7.5 and E11.5. Csn6–/–p53–/– embryos were identified at E8.5–E10.5 (Table 2 and Supplemental Figure 9), suggesting a partial rescue of lethality in the Csn6-null embryos. The partial rescue indicated a delicate regulation between Csn6 and p53.
Table 2 .
E7.5–E11.5 genetic analysis and offspring number of male Csn6+/–p53–/– and female Csn6+/–p53+/– intercross
Sensitization to p53-dependent apoptosis by Csn6 haploinsufficiency.
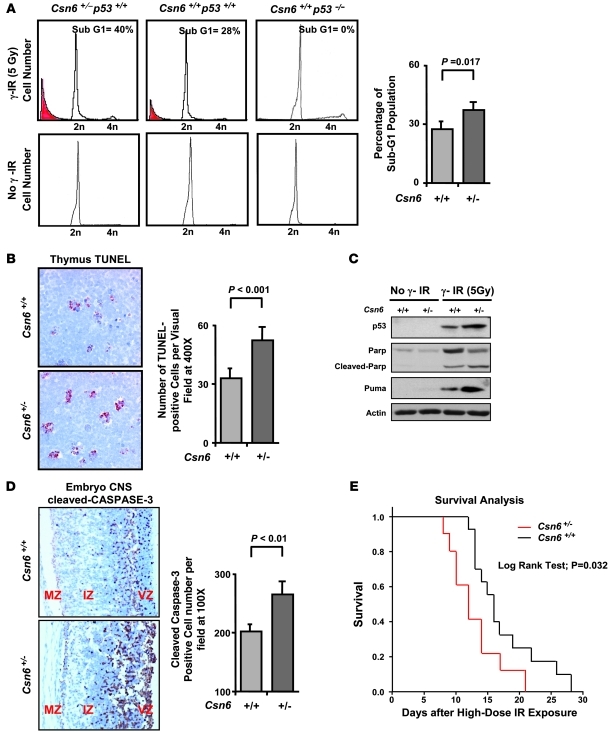
We next investigated the role of Csn6 in regulating p53 biological functions in vivo, such as apoptosis after DNA damage and γ-IR–induced tumorigenesis, using the Csn6+/– mice we created. Given the indispensable role of p53 in γ-IR–induced apoptosis in mouse thymocytes (39), we treated Csn6+/–, Csn6+/+, and p53–/– mice at 5 weeks of age with 5 Gy total body γ-IR (TBI) and measured viability of thymocytes from these animals. Consistent with previous observations (39), thymocytes from p53–/– mice remained viable and resistant to γ-IR (Figure 7A). Remarkably, Csn6+/– thymocytes were much more susceptible to γ-IR, showing a significantly higher percentage of sub-G1 population than Csn6+/+ thymocytes (40% versus 28%; Figure 7A), which indicated that reduced expression of Csn6 sensitized these cells to γ-IR–induced and p53-dependent apoptosis. As expected, the number of γ-IR–induced TUNEL+ cells was higher in Csn6+/– than in Csn6+/+ thymus tissue (Figure 7B). In agreement with the finding of more apoptotic cells in Csn6+/– thymus tissue, the protein levels of p53, Puma, and specifically cleaved Parp (p85) were higher in Csn6+/– thymocytes than in controls after γ-IR (Figure 7C). In addition to mouse thymocytes, p53 is essential for γ-IR–induced apoptosis in the developing CNS (40). Csn6+/+ and Csn6+/– littermates were exposed to 5 Gy γ-IR at E13.5 in utero. At 5 hours after γ-IR, the embryos were processed and stained for the activated cleaved caspase-3. There were significantly more apoptotic cells in the CNS of Csn6+/– than of Csn6+/+ embryos (Figure 7D). This observation corroborated the findings in thymic tissue that high levels of p53 in Csn6+/– mice facilitated γ-IR–induced p53-dependent apoptosis.
Figure 7. Csn6 is essential for γ-IR–induced apoptosis in the mouse thymus and developing CNS.
(A) FACS analysis for detection of apoptotic thymocytes of Csn6+/– and Csn6+/+ mice after γ-IR. Thymocytes with sub-G1 DNA (red) content were apoptotic. Percent sub-G1 population in each sample was measured. P values were determined by 2-tailed t test. (B) TUNEL analysis of thymus sections in Csn6+/– and Csn6+/+ mice after γ-IR. Mice were treated as in A. Apoptosis was analyzed by TUNEL assay in the thymus sections (original magnification, ×400). Number of TUNEL+ cells per field was measured. P values were determined by 2-tailed t test. (C) Increased Puma expression and Parp cleavage in Csn6+/– thymocytes upon γ-IR. Thymocytes were treated as in A, then subjected to immunoblots with indicated antibodies. (D) CNS of embryos assayed for apoptosis by cleaved caspase-3 staining. Sagittal sections of embryos were stained for cleaved caspase-3 (original magnification, ×100). Ventricular zone (VZ), intermediate zone (IZ), and marginal zone (MZ) of the CNS are indicated. Number of cleaved caspase-3+ cells per field was measured. P values were determined by 2-tailed t test. (E) Kaplan-Meier survival curves for Csn6+/– and Csn6+/+ mice subjected to γ-IR. 5-week-old littermates were given TBI at a dose of 7.5 Gy. Mouse survival was monitored for 30 days.
p53-mediated apoptosis is involved in lethality of high-dose γ-IR (41). Given that Csn6 was involved in regulating p53, we determined whether Csn6+/– mice are sensitive to high-dose γ-IR in terms of survival. We subjected 5-week-old littermates to 7.5 Gy TBI. Csn6+/– mice survived a shorter period (median survival, 12 days; SEM, 1.549 days) than Csn6+/+ mice (median survival, 16 days; SEM, 1.169 days) after high-dose TBI (Figure 7E). This observation strongly supported the notion that accumulation of p53 in Csn6+/– mice sensitized cells to γ-IR–induced apoptosis, therefore increasing the lethality caused by high-dose TBI.
Attenuation of γ-IR–induced carcinogenesis by Csn6 haploinsufficiency.
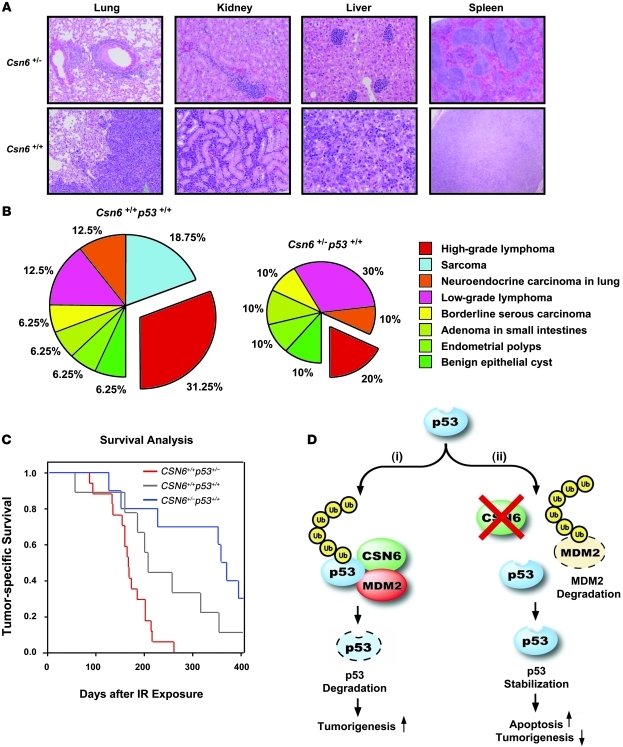
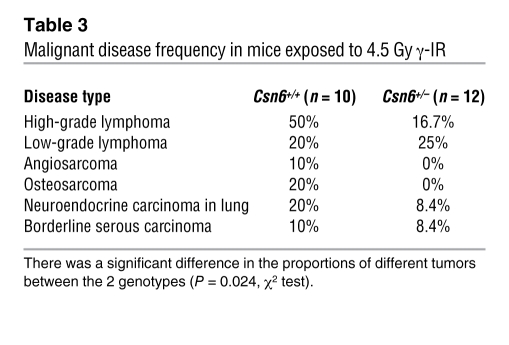
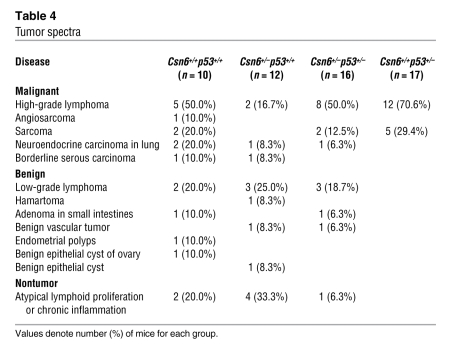
p53 plays an important role in suppressing carcinogenesis after low-dose γ-IR exposure (42). To determine whether haploinsufficiency of Csn6, which increased p53, could attenuate tumorigenesis in vivo, we exposed cohorts of 5-week-old Csn6+/–, Csn6+/+, Csn6+/–p53+/–, and p53+/– mice to a single sublethal dose (4.5 Gy) of TBI. Both irradiated Csn6+/– and Csn6+/+ mice took a longer time to develop malignancies than did p53+/– mice. Analysis of tumors from littermates of 2 genotypes (Csn6+/– and Csn6+/+) revealed that there were more tumor-free Csn6+/– mice (33%; 4 of 12) than Csn6+/+ mice (20%; 2 of 10), and there were fewer neoplasms per mouse in Csn6+/– than in Csn6+/+ mice (0.83 versus 1.6 per mouse). Atypical lymphoid proliferation was observed in various tissues — including lung, spleen, liver, and kidney, which are nonthymic visceral organs frequently involved in lymphomas — of Csn6+/– mice, but high-grade lymphomas were typically observed in Csn6+/+ mice (Figure 8A). There was a higher incidence of high-grade lymphomas in Csn6+/+ mice than in Csn6+/– mice (50% versus 16.7%; Table 3). Csn6+/– mice showed no sarcomas, malignancies that positively correlate with overexpression of Mdm2 (43), in contrast to a 30% incidence of sarcomas in Csn6+/+ mice (Table 3). Tumor spectra for both genotypes are shown in Figure 8B. In addition, the tumor spectrum of double-heterozygous Csn6+/–p53+/– mice fell between those of the Csn6+/–p53+/+ and Csn6+/+p53+/+ groups (Table 4), which suggests that impairment of Csn6 function is able to rescue the effect of loss of p53 to a certain extent. These results indicated that Csn6 haploinsufficiency inhibited γ-IR–induced tumorigenesis and supported our idea that Csn6 is a p53-negative regulator. Kaplan-Meier analysis showed that both Csn6+/+ and Csn6+/– mice had significantly better survival than did p53+/– mice, and the survival of Csn6+/– mice was better than that of Csn6+/+ mice (Figure 8C), consistent with a possible dosage effect of p53 level on tumor-specific survival (relative p53 level, in descending order: Csn6+/–, Csn6+/+, p53+/–). Given all the data presented, we concluded that loss of 1 copy of Csn6 confers tumor-suppressive activity by increasing the level of p53.
Figure 8. Csn6 haploinsufficiency inhibits γ-IR–induced tumorigenesis in mice.
(A) H&E-stained sections of lung, kidney, liver, and spleen from moribund mice after 4.5 Gy γ-IR showed different degrees of lymphocyte infiltration. Csn6+/+ mice suffered with high-grade lymphoma while age-matched Csn6+/– littermates showed atypical lymphoid proliferation. Original magnification, ×100 (lung, kidney, and liver); ×40 (spleen). (B) Tumor spectra in Csn6+/– and Csn6+/+ mice after γ-IR. Pie charts show relative frequency of tumor types observed. c2 test showed a significant difference (P = 0.024) in the proportions of different tumors between the 2 genotypes. Data represent the total number of neoplasms detected. (C) Tumor-specific survival of Csn6+/+p53+/+, Csn6+/–p53+/+, and Csn6+/+p53+/– mice after 4.5 Gy γ-IR. Kaplan-Meier survival curves of age-matched littermates are shown. P < 0.05, log-rank test. (D) Role of CSN6 in modulating MDM2 stability, p53-dependent apoptosis, and tumorigenesis. The presence of CSN6 (i) stabilizes MDM2, leading to p53 degradation and susceptibility to γ-IR–induced tumorigenesis. The absence of CSN6 (ii) results in decreased MDM2 and increased p53, enhancing p53-mediated apoptosis and tumor suppression.
Table 3 .
Malignant disease frequency in mice exposed to 4.5 Gy γ-IR
Table 4 .
Tumor spectra
Discussion
CSN is involved in regulating cullin-based E3 ligases and could potentially be altered in tumors. Although few studies documented the role of CSN5 in tumorigenesis (44, 45), the roles of COP9 subunits in tumorigenesis remain to be determined. Here, we discovered that CSN6 was amplified and overexpressed in cancers and was a positive regulator of ubiquitin ligase MDM2 to promote tumorigenesis. Our discovery of CSN6 in stabilizing MDM2 updates the paradigm with evidence that CSN has a versatile role in modulating various types of E3 ligases.
The positive correlation between CSN6 and MDM2 in both cancer cell lines and primary tumors is particularly interesting, as MDM2 levels are associated with poor prognosis of many types of human cancer (26, 46). MDM2 is substantially amplified/overexpressed in greater than 40 different types of malignancies, and changes in MDM2 stability could be another possible explanation; however, little is known about this aspect. It is worth noting that in our collection of breast cancer specimens, CSN6 positively correlated with MDM2 overexpression without MDM2 gene amplification and without p53 gene mutation and/or deletion (Supplemental Table 1). On the basis of our data, it is possible that CSN6 gene amplification and CSN6-mediated MDM2 stabilization may be a common feature of many types of cancer.
Interestingly, CSN6 binds to the central acidic domain (aa 294–384) of MDM2, a region that also interacts with several other proteins, such as ribosomal protein L5 (32) and transcription factor YY1 (35). All of them regulate the E3 ligase activity of MDM2 through binding to the domain. More importantly, we identified the autoubiquitination site of MDM2 within this region: K364. It is possible that the direct interaction with CSN6 blocks MDM2 autoubiquitination.
A prior study demonstrated that COP9 is involved in regulating p53 stability (47), mainly through specific phosphorylation on p53 via a CSN-associated kinase. Here, the positive regulation of CSN6 on MDM2 seems independent of CSN or any other subunit in light of our findings that CSN6 directly associated with MDM2 and suppressed MDM2 polyubiquitination in vitro (Figure 4, B and F). CSN6 probably functions to inhibit MDM2 autoubiquitination and then switches the E3 ligase target from MDM2 itself to p53. Such a hypothesis is worth further investigation. Most importantly, this is the first demonstration to our knowledge of the existence of the free form of CSN6 inside cells, performing a function not shared with CSN. This provides further evidence to support the idea that each COP9 subunit might have a unique function under certain conditions.
Generating Csn6 mutant mice allowed us to address the impact of CSN6 in regulating p53 function in vivo. Deletion of both Csn6 alleles caused early embryonic lethality, confirming its functional importance in vivo. Also, this observation was consistent with the critical role of CSN6 in regulating the MDM2-p53 axis and reminiscent of knockout studies of p53-negative regulators such as MDM2 and MDM4, which also cause embryonic lethality (48, 49). We also addressed the embryonic lethality of Csn6-null mice by crossing with p53-null mice and found that loss of p53 rescued the embryonic lethality of Csn6-null embryos from E7.5 to E10.5 (Table 2 and Supplemental Figure 9). This degree of rescue, albeit not a full rescue, still underscores the importance of CSN6 in the MDM2-p53 axis. It is possible that CSN6 regulates important targets required for mouse embryogenesis other than MDM2 and p53, which deserves further study. On the other hand, the loss of Csn6 led to disruption of the entire CSN, a phenomenon common across all COP9 subunits in mice. The absence of CSN may also contribute to the embryonic lethality of Csn6-null mice by the fact that CSN has broad effects on multiple cellular signaling cascades (3). Therefore, the consequence of loss of CSN may not be able to be compensated for by depletion of p53 only.
Although genetic knockout of other COP9 subunits (Csn2, Csn3, Csn5, and Csn8) has been reported, effects of loss of function of these genes on the MDM2-p53 axis have not been explored in detail in these genetic models. Even though CSN5 and CSN6 are the only 2 MPN domain–containing proteins in CSN, they could not compensate for each other in early embryo development when both alleles of Csn5 or Csn6 are disrupted, which suggests that these 2 genes are not functionally redundant.
We used Csn6+/– mice to investigate the functional significance of Csn6 on tumorigenesis. Indeed, p53 activity was higher in Csn6+/– MEFs (Figure 6E), and more apoptotic Csn6+/– thymocytes than Csn6+/+ thymocytes were observed (Figure 7A) in response to DNA damage. This Csn6-MDM2-p53 regulatory axis also plays an important role in tumorigenesis: loss of expression of Csn6 led to reduced γ-IR–induced lymphomagenesis (Figure 8), which is known to be impeded by p53. These intriguing observations in animal models suggest that loss of expression of CSN6 can attenuate carcinogenesis/tumor progression.
On the basis of our biochemical and genetic studies, we propose a model whereby CSN6-mediated stabilization of MDM2 leads to ubiquitination and subsequent degradation of p53, impairing the tumor-suppressive function of p53 (Figure 8D). Concordant overexpression of CSN6 and MDM2 in human breast cancer and follicular thyroid carcinoma lends support for this model. On the other hand, haploinsufficiency of Csn6 is able to decrease MDM2 and stabilize p53, enhancing p53-mediated apoptosis and tumor suppression (Figure 8D). Our animal data provide firm support for this second notion. Therefore, the effect of CSN6 on MDM2 plays a substantial role in p53-mediated apoptosis and tumorigenesis.
In summary, we showed that CSN6 was frequently amplified in human cancer. CSN6 increased stability of MDM2 and subsequent degradation of tumor suppressor p53, thereby promoting tumorigenicity. Our findings suggest what we believe to be a novel mechanism that may underlie the observed increased MDM2 protein levels without MDM2 gene amplification. The potential importance of CSN6 as a prognostic marker and therapeutic target in cancers that involve a dysregulated MDM2-p53 axis warrants further investigation.
Methods
Genome structure analyses.
See Supplemental Methods.
Human tumor samples.
58 genomic DNA samples of primary breast tumors were obtained from First Affiliated Hospital, China Medical University. Collection and usage of all patient materials and information were conducted according to institutional guidelines and the Declaration of Helsinki Principles. 8 pairs of primary breast tumors with corresponding noncancerous breast samples were obtained from patients who had undergone operations to treat breast cancer. They were collected as freshly frozen tissues and were stored in the tissue bank of the University of Texas M.D. Anderson Cancer Center. 35 human thyroid tissues were obtained as freshly frozen tissues along with the final pathologic diagnoses from the Eastern Division of Cooperative Human Tissue Network. Research using all human specimens and data was conducted under protocols approved by the Institutional Review Board of University of Texas M.D. Anderson Cancer Center. Informed consent was obtained from all subjects.
Plasmids, antibodies, and reagents.
See Supplemental Methods.
Quantitative PCR.
See Supplemental Methods.
Foci formation assay.
See Supplemental Methods.
Tumorigenesis in nude mice.
See Supplemental Methods.
In vitro binding assay.
See Supplemental Methods.
In vivo ubiquitination assay.
Cells were cotransfected with the indicated plasmids. 24 hours later, cells were treated with 50 μg/ml MG132 for 6 hours. Cells were harvested and lysed with lysis buffer (50 mM Tris, pH 7.5; 150 mM NaCl; 0.5% NP-40; 0.5% Triton X-100; and 5 mM NEM). HA-ubiquitinated MDM2 and HA-ubiquitinated p53 were immunoprecipitated with anti-HA. The protein complexes were then resolved by 6% SDS-polyacrylamide gel and probed with anti-MDM2 or anti-p53 to observe the ubiquitinated MDM2 or p53.
In vitro ubiquitination assay.
Bacterial-purified GST-MDM2 was incubated with different combinations of bacterial-purified Flag-CSN5, Flag-CSN6, or recombinant CSN complex and with His-ubiquitin (200 pmol), E1 (2 pmol), E2-UbcH5a/5b (10 pmol), or ATP (2 mM) in a total volume of 50 μl at 37°C for 1 hour. Reaction buffer was as described previously (50): 50 mM Tris-HCL (pH 7.5), 5 mM MgCl2, 2 mM NaF, and 0.6 mM DTT. His-ubiquitin (U-530), E1 (E-305), and E2 (E2-622) were from Boston Biochem; recombinant human CSN complex (PW9425) was from BIOMOL International. Reaction products were resolved by 6% SDS-polyacrylamide gel and probed with anti-ubiquitin.
FACS analysis.
Primary MEFs from littermates of different genotypes were treated with 1 μg/ml DOX for 48 hours; primary MEFs from the same animals were left untreated. Apoptosis was determined by 2-color analysis using PI and FITC-conjugated anti–annexin V (BD Biosciences — Pharmingen) according to the manufacturer’s instructions with a FACScalibur flow cytometer. 5-week-old Csn6+/–p53+/+ (n = 7), Csn6+/+p53+/+ (n = 7), and Csn6+/+p53–/– (n = 2) mice were exposed to 5 Gy TBI or no irradiation and sacrificed 5 hours later to collect thymic tissue. Single-cell suspensions from thymus were prepared, washed 3 times with PBS, and fixed in 70% ethanol at 4°C for 1 hour. Cells were incubated at 37°C for 30 minutes in a buffer containing 50 μg/ml PI, 5 mM MgCl2, 10 mM Tris-HCl (pH 7.0), and 25 μg/ml RNaseA, followed by FACS analysis to measure the sub-G1 fraction.
TUNEL assay.
See Supplemental Methods.
Cleaved caspase-3 staining.
See Supplemental Methods.
Survival analysis.
See Supplemental Methods.
Pathological analysis of tumors.
5-week-old littermates of different genotypes and of both sexes were exposed to a single dose of 4.5 Gy TBI and monitored for signs of illness or tumor burden. Moribund mice were sacrificed, and the major organs and tumors were fixed with 10% buffered formalin, paraffin embedded, and sectioned. Sections were stained with H&E for pathological evaluation. Tumor-free survival curves were analyzed by the Kaplan-Meier method.
Statistics.
Differences between groups were evaluated using 2-tailed t test or Mann-Whitney rank-sum test. Paired samples were compared using paired t test. Spearman rank-order correlation was used for correlative relationships between 2 quantitative measurements. Kaplan-Meier survival curves were compared using the log-rank test. For all statistical analyses, a P value less than 0.05 was considered statistically significant. Unless otherwise indicated, error bars represent 95% confidence intervals.
Supplementary Material
Acknowledgments
We thank J. Parker, M.-C. Hung, H.-P. Kuo, J.-M. Hsu, C.-T. Chen, X.C. Zhang, and T.-F. Che for technical assistance and J. Gingold for editing. This work was supported by grants from NIH (RO1CA 089266), Directed Medical Research Programs (DOD SIDA BC062166; to S.J. Yeung and M.H. Lee), Susan G. Komen Breast Cancer Foundation, and Cancer Center Core (CA16672).
Footnotes
Conflict of interest: The authors have declared that no conflict of interest exists.
Citation for this article: J Clin Invest. 2011;121(3):851–865. doi:10.1172/JCI44111.
References
- 1. Wei N, Deng XW. COP9: a new genetic locus involved in light-regulated development and gene expression in arabidopsis. Plant Cell. 1992;4(12):1507–1518. doi: 10.1105/tpc.4.12.1507. [DOI] [PMC free article] [PubMed] [Google Scholar]
- 2. Li L, Deng XW. The COP9 signalosome: an alternative lid for the 26S proteasome? Trends Cell Biol. 2003;13(10):507–509. doi: 10.1016/j.tcb.2003.08.002. [DOI] [PubMed] [Google Scholar]
- 3. Cope GA, Deshaies RJ. COP9 signalosome: a multifunctional regulator of SCF and other cullin-based ubiquitin ligases. Cell. 2003;114(6):663–671. doi: 10.1016/S0092-8674(03)00722-0. [DOI] [PubMed] [Google Scholar]
- 4. Cope GA, et al. Role of predicted metalloprotease motif of Jab1/Csn5 in cleavage of Nedd8 from Cul1. Science. 2002;298(5593):608–611. doi: 10.1126/science.1075901. [DOI] [PubMed] [Google Scholar]
- 5. Yang X, et al. The COP9 signalosome inhibits p27(kip1) degradation and impedes G1-S phase progression via deneddylation of SCF Cul1. Curr Biol. 2002;12(8):667–672. doi: 10.1016/S0960-9822(02)00791-1. [DOI] [PubMed] [Google Scholar]
- 6. Groisman R, et al. The ubiquitin ligase activity in the DDB2 and CSA complexes is differentially regulated by the COP9 signalosome in response to DNA damage. Cell. 2003;113(3):357–367. doi: 10.1016/S0092-8674(03)00316-7. [DOI] [PubMed] [Google Scholar]
- 7. Hetfeld BK, Peth A, Sun XM, Henklein P, Cohen GM, Dubiel W. The COP9 signalosome-mediated deneddylation is stimulated by caspases during apoptosis. Apoptosis. 2008;13(2):187–195. doi: 10.1007/s10495-007-0164-7. [DOI] [PubMed] [Google Scholar]
- 8. Richardson KS, Zundel W. The emerging role of the COP9 signalosome in cancer. Mol Cancer Res. 2005;3(12):645–653. doi: 10.1158/1541-7786.MCR-05-0233. [DOI] [PMC free article] [PubMed] [Google Scholar]
- 9. Maytal-Kivity V, Reis N, Hofmann K, Glickman MH. MPN+, a putative catalytic motif found in a subset of MPN domain proteins from eukaryotes and prokaryotes, is critical for Rpn11 function. BMC Biochem. 2002;3:28. doi: 10.1186/1471-2091-3-28. [DOI] [PMC free article] [PubMed] [Google Scholar]
- 10. Lykke-Andersen K, Schaefer L, Menon S, Deng XW, Miller JB, Wei N. Disruption of the COP9 signalosome Csn2 subunit in mice causes deficient cell proliferation, accumulation of p53 and cyclin E, and early embryonic death. Mol Cell Biol. 2003;23(19):6790–6797. doi: 10.1128/MCB.23.19.6790-6797.2003. [DOI] [PMC free article] [PubMed] [Google Scholar]
- 11. Yan J, et al. COP9 signalosome subunit 3 is essential for maintenance of cell proliferation in the mouse embryonic epiblast. Mol Cell Biol. 2003;23(19):6798–6808. doi: 10.1128/MCB.23.19.6798-6808.2003. [DOI] [PMC free article] [PubMed] [Google Scholar]
- 12. Tomoda K, Yoneda-Kato N, Fukumoto A, Yamanaka S, Kato JY. Multiple functions of Jab1 are required for early embryonic development and growth potential in mice. J Biol Chem. 2004;279(41):43013–43018. doi: 10.1074/jbc.M406559200. [DOI] [PubMed] [Google Scholar]
- 13. Menon S, Chi H, Zhang H, Deng XW, Flavell RA, Wei N. COP9 signalosome subunit 8 is essential for peripheral T cell homeostasis and antigen receptor-induced entry into the cell cycle from quiescence. Nat Immunol. 2007;8(11):1236–1245. doi: 10.1038/ni1514. [DOI] [PubMed] [Google Scholar]
- 14. Mahalingam S, et al. HIV-1 Vpr interacts with a human 34-kDa mov34 homologue, a cellular factor linked to the G2/M phase transition of the mammalian cell cycle. Proc Natl Acad Sci U S A. 1998;95(7):3419–3424. doi: 10.1073/pnas.95.7.3419. [DOI] [PMC free article] [PubMed] [Google Scholar]
- 15. Tang JC, Lam KY, Law S, Wong J, Srivastava G. Detection of genetic alterations in esophageal squamous cell carcinomas and adjacent normal epithelia by comparative DNA fingerprinting using inter-simple sequence repeat PCR. Clin Cancer Res. 2001;7(6):1539–1545. [PubMed] [Google Scholar]
- 16. Forozan F, et al. Comparative genomic hybridization analysis of 38 breast cancer cell lines: a basis for interpreting complementary DNA microarray data. Cancer Res. 2000;60(16):4519–4525. [PubMed] [Google Scholar]
- 17. Solinas-Toldo S, Wallrapp C, Muller-Pillasch F, Bentz M, Gress T, Lichter P. Mapping of chromosomal imbalances in pancreatic carcinoma by comparative genomic hybridization. Cancer Res. 1996;56(16):3803–3807. [PubMed] [Google Scholar]
- 18. Ariyama Y, et al. Chromosomal imbalances in adult T-cell leukemia revealed by comparative genomic hybridization: gains at 14q32 and 2p16-22 in cell lines. J Hum Genet. 1999;44(6):357–363. doi: 10.1007/s100380050178. [DOI] [PubMed] [Google Scholar]
- 19. Honda R, Tanaka H, Yasuda H. Oncoprotein MDM2 is a ubiquitin ligase E3 for tumor suppressor p53. FEBS Lett. 1997;420(1):25–27. doi: 10.1016/S0014-5793(97)01480-4. [DOI] [PubMed] [Google Scholar]
- 20. Nakamura S, Roth JA, Mukhopadhyay T. Multiple lysine mutations in the C-terminal domain of p53 interfere with MDM2-dependent protein degradation and ubiquitination. Mol Cell Biol. 2000;20(24):9391–9398. doi: 10.1128/MCB.20.24.9391-9398.2000. [DOI] [PMC free article] [PubMed] [Google Scholar]
- 21. Fang S, Jensen JP, Ludwig RL, Vousden KH, Weissman AM. Mdm2 is a RING finger-dependent ubiquitin protein ligase for itself and p53. J Biol Chem. 2000;275(12):8945–8951. doi: 10.1074/jbc.275.12.8945. [DOI] [PubMed] [Google Scholar]
- 22. Stommel JM, Wahl GM. Accelerated MDM2 auto-degradation induced by DNA-damage kinases is required for p53 activation. EMBO J. 2004;23(7):1547–1556. doi: 10.1038/sj.emboj.7600145. [DOI] [PMC free article] [PubMed] [Google Scholar]
- 23. Levine AJ, Hu W, Feng Z. The P53 pathway: what questions remain to be explored? Cell Death Differ. 2006;13(6):1027–1036. doi: 10.1038/sj.cdd.4401910. [DOI] [PubMed] [Google Scholar]
- 24. Oliner JD, Kinzler KW, Meltzer PS, George DL, Vogelstein B. Amplification of a gene encoding a p53-associated protein in human sarcomas. Nature. 1992;358(6381):80–83. doi: 10.1038/358080a0. [DOI] [PubMed] [Google Scholar]
- 25. Toledo F, Wahl GM. Regulating the p53 pathway: in vitro hypotheses, in vivo veritas. Nat Rev Cancer. 2006;6(12):909–923. doi: 10.1038/nrc2012. [DOI] [PubMed] [Google Scholar]
- 26. Momand J, Jung D, Wilczynski S, Niland J. The MDM2 gene amplification database. Nucleic Acids Res. 1998;26(15):3453–3459. doi: 10.1093/nar/26.15.3453. [DOI] [PMC free article] [PubMed] [Google Scholar]
- 27. Yang JY, et al. ERK promotes tumorigenesis by inhibiting FOXO3a via MDM2-mediated degradation. Nat Cell Biol. 2008;10(2):138–148. doi: 10.1038/ncb1676. [DOI] [PMC free article] [PubMed] [Google Scholar]
- 28. Yang JY, et al. MDM2 promotes cell motility and invasiveness by regulating E-cadherin degradation. Mol Cell Biol. 2006;26(19):7269–7282. doi: 10.1128/MCB.00172-06. [DOI] [PMC free article] [PubMed] [Google Scholar]
- 29. Iwakuma T, Lozano G. MDM2, an introduction. Mol Cancer Res. 2003;1(14):993–1000. [PubMed] [Google Scholar]
- 30. Chari R, et al. SIGMA: a system for integrative genomic microarray analysis of cancer genomes. BMC Genomics. 2006;7:324. doi: 10.1186/1471-2164-7-324. [DOI] [PMC free article] [PubMed] [Google Scholar]
- 31. Naylor TL, et al. High resolution genomic analysis of sporadic breast cancer using array-based comparative genomic hybridization. Breast Cancer Res. 2005;7(6):R1186–R1198. doi: 10.1186/bcr1356. [DOI] [PMC free article] [PubMed] [Google Scholar]
- 32. Dai MS, Lu H. Inhibition of MDM2-mediated p53 ubiquitination and degradation by ribosomal protein L5. J Biol Chem. 2004;279(43):44475–44482. doi: 10.1074/jbc.M403722200. [DOI] [PubMed] [Google Scholar]
- 33. Lohrum MA, Ludwig RL, Kubbutat MH, Hanlon M, Vousden KH. Regulation of HDM2 activity by the ribosomal protein L11. Cancer Cell. 2003;3(6):577–587. doi: 10.1016/s1535-6108(03)00134-x. [DOI] [PubMed] [Google Scholar]
- 34. Jin A, Itahana K, O’Keefe K, Zhang Y. Inhibition of HDM2 and activation of p53 by ribosomal protein L23. Mol Cell Biol. 2004;24(17):7669–7680. doi: 10.1128/MCB.24.17.7669-7680.2004. [DOI] [PMC free article] [PubMed] [Google Scholar]
- 35. Sui G, et al. Yin Yang 1 is a negative regulator of p53. Cell. 2004;117(7):859–872. doi: 10.1016/j.cell.2004.06.004. [DOI] [PubMed] [Google Scholar]
- 36. Hetfeld BK, et al. The zinc finger of the CSN-associated deubiquitinating enzyme USP15 is essential to rescue the E3 ligase Rbx1. Curr Biol. 2005;15(13):1217–1221. doi: 10.1016/j.cub.2005.05.059. [DOI] [PubMed] [Google Scholar]
- 37. Stevenson LF, Sparks A, Allende-Vega N, Xirodimas DP, Lane DP, Saville MK. The deubiquitinating enzyme USP2a regulates the p53 pathway by targeting Mdm2. EMBO J. 2007;26(4):976–986. doi: 10.1038/sj.emboj.7601567. [DOI] [PMC free article] [PubMed] [Google Scholar]
- 38. Stryke D, et al. BayGenomics: a resource of insertional mutations in mouse embryonic stem cells. Nucleic Acids Res. 2003;31(1):278–281. doi: 10.1093/nar/gkg064. [DOI] [PMC free article] [PubMed] [Google Scholar]
- 39. Lowe SW, Schmitt EM, Smith SW, Osborne BA, Jacks T. p53 is required for radiation-induced apoptosis in mouse thymocytes. Nature. 1993;362(6423):847–849. doi: 10.1038/362847a0. [DOI] [PubMed] [Google Scholar]
- 40. Herzog KH, Chong MJ, Kapsetaki M, Morgan JI, McKinnon PJ. Requirement for Atm in ionizing radiation-induced cell death in the developing central nervous system. Science. 1998;280(5366):1089–1091. doi: 10.1126/science.280.5366.1089. [DOI] [PubMed] [Google Scholar]
- 41. Wu WS, et al. Slug antagonizes p53-mediated apoptosis of hematopoietic progenitors by repressing puma. Cell. 2005;123(4):641–653. doi: 10.1016/j.cell.2005.09.029. [DOI] [PubMed] [Google Scholar]
- 42. Kemp CJ, Wheldon T, Balmain A. p53-deficient mice are extremely susceptible to radiation-induced tumorigenesis. Nat Genet. 1994;8(1):66–69. doi: 10.1038/ng0994-66. [DOI] [PubMed] [Google Scholar]
- 43. Harris SL, Levine AJ. The p53 pathway: positive and negative feedback loops. Oncogene. 2005;24(17):2899–2908. doi: 10.1038/sj.onc.1208615. [DOI] [PubMed] [Google Scholar]
- 44. Kouvaraki MA, Rassidakis GZ, Tian L, Kumar R, Kittas C, Claret FX. Jun activation domain-binding protein 1 expression in breast cancer inversely correlates with the cell cycle inhibitor p27(Kip1). Cancer Res. 2003;63(11):2977–2981. [PubMed] [Google Scholar]
- 45. Sui L, et al. Jab1 expression is associated with inverse expression of p27(kip1) and poor prognosis in epithelial ovarian tumors. Clin Cancer Res. 2001;7(12):4130–4135. [PubMed] [Google Scholar]
- 46. Rayburn E, Zhang R, He J, Wang H. MDM2 and human malignancies: expression, clinical pathology, prognostic markers, and implications for chemotherapy. Curr Cancer Drug Targets. 2005;5(1):27–41. doi: 10.2174/1568009053332636. [DOI] [PubMed] [Google Scholar]
- 47. Bech-Otschir D, et al. COP9 signalosome-specific phosphorylation targets p53 to degradation by the ubiquitin system. EMBO J. 2001;20(7):1630–1639. doi: 10.1093/emboj/20.7.1630. [DOI] [PMC free article] [PubMed] [Google Scholar]
- 48. Montes de Oca Luna R, Wagner DS, Lozano G. Rescue of early embryonic lethality in mdm2-deficient mice by deletion of p53. Nature. 1995;378(6553):203–206. doi: 10.1038/378203a0. [DOI] [PubMed] [Google Scholar]
- 49. Parant J, et al. Rescue of embryonic lethality in Mdm4-null mice by loss of Trp53 suggests a nonoverlapping pathway with MDM2 to regulate p53. Nat Genet. 2001;29(1):92–95. doi: 10.1038/ng714. [DOI] [PubMed] [Google Scholar]
- 50. Lo SC, Hannink M. PGAM5, a Bcl-XL-interacting protein, is a novel substrate for the redox-regulated Keap1-dependent ubiquitin ligase complex. J Biol Chem. 2006;281(49):37893–37903. doi: 10.1074/jbc.M606539200. [DOI] [PubMed] [Google Scholar]
Associated Data
This section collects any data citations, data availability statements, or supplementary materials included in this article.


