

Abstract
To obtain rates of mRNA synthesis and decay in yeast, we established dynamic transcriptome analysis (DTA). DTA combines non-perturbing metabolic RNA labeling with dynamic kinetic modeling. DTA reveals that most mRNA synthesis rates are around several transcripts per cell and cell cycle, and most mRNA half-lives range around a median of 11 min. DTA can monitor the cellular response to osmotic stress with higher sensitivity and temporal resolution than standard transcriptomics. In contrast to monotonically increasing total mRNA levels, DTA reveals three phases of the stress response. During the initial shock phase, mRNA synthesis and decay rates decrease globally, resulting in mRNA storage. During the subsequent induction phase, both rates increase for a subset of genes, resulting in production and rapid removal of stress-responsive mRNAs. During the recovery phase, decay rates are largely restored, whereas synthesis rates remain altered, apparently enabling growth at high salt concentration. Stress-induced changes in mRNA synthesis rates are predicted from gene occupancy with RNA polymerase II. DTA-derived mRNA synthesis rates identified 16 stress-specific pairs/triples of cooperative transcription factors, of which seven were known. Thus, DTA realistically monitors the dynamics in mRNA metabolism that underlie gene regulatory systems.
Keywords: gene expression, gene regulation, mRNA transcription, mRNA turnover, salt stress response
Introduction
Cellular growth and stress response require gene regulation at the level of mRNA transcription and stability. To study gene regulation in a eukaryotic cell, the rates of mRNA synthesis and decay must be measured without perturbation of the cellular system, and changes in these rates must be monitored to follow a cellular response. This cannot be achieved by standard transcriptomics, which only measures mRNA abundance. The yeast Saccharomyces cerevisiae is an ideal model eukaryote for systemic analysis, but mRNA synthesis and decay rates can currently not be measured without cellular perturbation. Synthesis rates can be measured by nuclear run-on (Garcia-Martinez et al, 2004), but this requires sarkosyl treatment that inhibits cellular processes. Decay rates can be measured after blocking transcription with inhibitors (Lam et al, 2001; Grigull et al, 2004; Shalem et al, 2008) but this is inherently cell invasive. In addition, decay rates can be measured with a temperature-sensitive yeast strain (Holstege et al, 1998; Wang et al, 2002), but this requires a perturbing heat shock.
Unperturbed RNA synthesis and decay rates can be obtained via metabolic RNA labeling and kinetic modeling (Cleary et al, 2005; Kenzelmann et al, 2007; Dolken et al, 2008; Friedel and Dolken, 2009; Miller et al, 2009). The nucleoside analog 4-thiouridine (4sU) is taken up by eukaryotic cells and incorporated into mRNA during Pol II transcription (Melvin et al, 1978). The thiol-labeled newly transcribed RNA can then be isolated by affinity chromatography (Kenzelmann et al, 2007) or by biotinylation and purification with streptavidin-coated magnetic beads (Cleary et al, 2005; Dolken et al, 2008). Although this approach is generally applicable to mammalian, insect, and plant cells, RNA labeling is not directly applicable to yeast.
In this study, we report on the development of an easy-to-use, non-perturbing method to measure mRNA synthesis and decay rates in yeast, referred to as dynamic transcriptome analysis (DTA). DTA is based on genetically facilitated uptake of 4sU and metabolic RNA labeling, microarray measurements, and an altered quantitative, dynamic model that describes mRNA metabolism in growing cells. Thereby, changes in synthesis and decay rates can be monitored in yeast at unprecedented sensitivity and temporal resolution. This is exemplified by analysis of the osmotic stress response, a conserved stress response pathway and one of the best-studied gene-regulatory systems in yeast (Hohmann et al, 2007; de Nadal and Posas, 2010).
Osmotic stress response is induced in yeast upon exposure to high concentrations of salt. The stress response involves activation of the conserved MAP kinase Hog1, which induces an altered activity of ion membrane transporters (Proft and Struhl, 2004), cell cycle arrest (Escote et al, 2004), dissociation of many chromatin-bound proteins (Proft and Struhl, 2004), translation inhibition (Uesono and Toh, 2002), and reprogramming of transcription (Macia et al, 2009). The osmotic stress response was analyzed globally by transcriptomics (Gasch et al, 2000; Causton et al, 2001; Melamed et al, 2008; Macia et al, 2009), run-on analysis (Romero-Santacreu et al, 2009), and transcription inhibition (Molin et al, 2009). These studies revealed changes in mRNA synthesis and decay and suggested three phases of the stress response, referred to as shock, induction, and recovery phase.
We report that DTA recaptures many known features of the stress response, but that it also provides new insights and uncovers misleading drawbacks of traditional methods. DTA reveals new salt stress genes, new sets of transcription factors (TFs) that cooperate during stress, and a temporary interdependence of mRNA synthesis and decay. The results are validated by genomic occupancy profiling of Pol II before and after stress. This confirmed that redistribution of Pol II over the genome predicts global changes in mRNA synthesis rates. These results establish DTA as a highly valuable tool for the analysis of dynamic changes in mRNA metabolism and as a method that can provide quantitative data for modeling complex gene-regulatory systems.
Results
Non-perturbing RNA labeling in yeast
The nucleoside analog 4sU is readily taken up by cells of a broad range of eukaryotic organisms and is efficiently incorporated into their newly transcribed RNA. This can be used to metabolically label and isolate newly transcribed RNA from total cellular RNA with high specificity (Kenzelmann et al, 2007; Dolken et al, 2008). To establish 4sU labeling in the budding yeast S. cerevisiae, we cultured cells in the presence of 100 μM–5 mM 4sU. Although we observed concentration-dependent, specific incorporation of 4sU, the efficiency of incorporation was low and the amount of recovered newly transcribed RNA was very small (not shown). This hinted at inefficient uptake of 4sU into yeast cells rather than an intracellular block in activation or incorporation by RNA polymerases.
In the fission yeast Schizosaccharomyces pombe, expression of the human equilibriative nucleoside transporter (hENT1) enables cellular uptake of the nucleoside analog 5-bromo-2′-deoxyuridine, resulting in labeling of DNA during replication (Hodson et al, 2003). To test whether this transporter could also mediate efficient uptake of 4sU in the budding yeast S. cerevisiae, and thus install efficient RNA labeling, we grew a BY4741 strain expressing hENT1 up to a logarithmic phase, added 4sU, and isolated RNA at several time points (Figure 1A, Materials and methods). This significantly enhanced 4sU incorporation to a level similar to that generally achieved in mammalian cells, thereby facilitating efficient separation of total cellular RNA into newly transcribed and pre-existing RNA.
Figure 1.
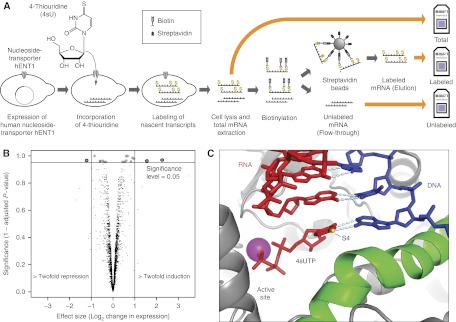
Dynamic transcriptome analysis in yeast. (A) Scheme of metabolic mRNA labeling in yeast. Nascent mRNA is labeled with 4-thiouridine (4sU) and thiol-specifically biotinylated following cell lysis and preparation of total cellular RNA. Fractionation into pre-existing and nascent mRNA is achieved with streptavidin beads. (B) The yeast transcriptome is undisturbed by expression of the human nucleoside transporter hENT1. The volcano plot compares mRNA levels after 6 min labeling versus wild-type cells without labeling. Each dot corresponds to one gene, the x axis displays the log2(fold) of that gene, the y axis represents the multiple testing adjusted P-value (see Supplementary Section 12.5). In all, 17 genes showed a significant change in mRNA levels (adjusted P-value <5%), only three of which were at least twofold. The results for the other tested labeling periods are given in the Supplementary Section 12.6. (C) 4sUTP is modeled into the crystal structure of a Pol II transcribing complex (PDB code: 116H). The thiol group at position 4 can form a hydrogen bond with the DNA template strand (blue). Nascent RNA is in red.
We next tested whether Pol II incorporates the thionucleotide normally into RNA in vitro (Brueckner et al, 2007; Sydow et al, 2009). Pol II used the substrates UTP and 4sU-triposphate (4sUTP) with very similar kinetics (Supplementary Figure S1). Whereas kcat was unchanged, KM increased from 3 nM for UTP to 13 nM for 4sUTP, indicating a slightly decreased substrate affinity that may result from weaker base pairing between 4sUTP and the template (Figure 1C). This minor difference is likely irrelevant in vivo, where substrate concentration is higher by several orders of magnitude than these KM values. To investigate whether RNA labeling perturbed gene expression in vivo, we compared RNA levels in 4sU-treated hENT1-expressing cells with untreated wild-type cells (Materials and methods). For a labeling period of 6 min, there were no significant changes in RNA levels as measured with Affymetrix expression arrays (Figure 1B, Supplementary section 12.6, Supplementary Table 4, Supplementary Figures S11, S12). Thus, RNA labeling perturbs neither transcription nor the yeast transcriptome. Although other cellular processes may be influenced by 4sU, their effect on mRNA metabolism is apparently not significant, as changes in the total mRNA levels were not observed.
Dynamic transcriptome analysis
To determine the optimum labeling time, we purified total, newly transcribed (labeled), and pre-existing (unlabeled) RNA at 3, 6, 12, and 24 min after 4sU addition, and subjected these fractions to expression array analysis (Materials and methods). Replicate data always showed correlations above 0.9 for each RNA fraction at each time point (Supplementary Figure S2). To estimate mRNA synthesis and decay rates from individual time point measurements, a new quantitative steady-state model was developed (Materials and methods, Supplementary section 13, Supplementary Figures S15–S18). The model assumes constant RNA synthesis and decay rates during the labeling time. The model accounts for exponential cell growth and for variations in RNA extraction efficiencies. It also corrects for differences in the fraction of newly synthesized RNAs that escape labeling. This fraction is larger for shorter RNAs, and depends on the uridine content of the RNA and the labeling efficiency (Figure 2A).
Figure 2.

Determination of mRNA synthesis and decay rates. (A) Labeling bias. A plot of the number of uridines (x axis) versus the log ratio of labeled and total mRNA levels revealed that the labeling efficiency varies with the uridine content of the gene. As a consequence, synthesis rates for short transcripts are systematically underestimated. Modeling of the bias function (Material and methods, determination of mRNA synthesis and decay rates) showed that ∼1 out of 200 uridines is replaced by 4sU. (B) Center, scatter plot of the mRNA half-lives and synthesis rates for exponentially growing yeast cells. Colored points belong to the indicated gene sets (green, ribosomal biogenesis genes; violet, ribosomal protein genes; red, stress genes; dark gray, transcription factors (TFs). Assuming Gaussian distributions, ellipses show the 75% regions of highest density for the respective sets. Histograms along the x axis resp. y axis show the global half-life resp. synthesis rate distribution (light gray) and the half-life resp. synthesis rate distribution of the TFs (dark gray). Overall half-lives and synthesis rates are uncorrelated (Spearman correlation 0.06), however some gene groups behave differently (correlations: Ribosomal protein genes (Rp) −0.79, Ribosomal biogenesis genes (RiBi) 0.35, ISA stress module genes 0, TFs 0.07). (C) Gene Ontology (GO) analysis of the short-lived mRNAs (lower 25% of the half-life distribution). The 10 most significant categories are displayed, sorted from bottom (most significant) to top (Materials and methods). Red line, proportion of short-lived transcripts in the whole population (25% by construction). The number of short-lived transcripts in the resp. GO category is given relative to the GO category size (green bar) and relative to the number of short-lived transcripts (black line). Dashed line, relative size of the GO set in the whole population. (D) GO analysis of the long-lived mRNAs (upper 25% of the half-life distribution), analogous to (C).
Reproducibility assessment of the data (Supplementary section 12.6) and simulation studies (Supplementary section 13.4) suggested an optimum labeling time of 6 min, which was subsequently used in all experiments. This was short enough to meet the assumption of constant synthesis and decay rates during labeling, but sufficiently long to yield enough labeled RNA for robust measurements. The relative decay rates within an experiment can be estimated reliably, but the absolute values are more difficult to obtain (Supplementary section 13.5). To investigate this, we conducted a classical decay time course experiment using transcription inhibition and RT–PCR, and obtained generally consistent decay rates (Supplementary Figure S3). We refer to this method of deriving mRNA synthesis and decay rates after a short RNA labeling pulse as DTA.
Synthesis rates are low for most mRNAs
We used DTA to derive synthesis rates and decay rates (half-lives) for most (4508) of the yeast mRNAs (Supplements, Part I, Supplementary website). On the basis of a published rough estimate of 15 000 mRNA transcripts per yeast cell (Hereford and Rosbash, 1977), we calculated the synthesis rate as the number of mRNA molecules produced per cell per cell cycle time (150 min) (Figure 2B). The obtained rates correlated with previously reported rates obtained by nuclear run-on (Pelechano and Perez-Ortin, 2010) (Supplementary Figure S4). Synthesis rates ranged from 1 to ∼600 mRNAs per cell per cell cycle time. The synthesis rate distribution is strongly right skewed (skewness 5), with a median synthesis rate of 18 RNAs per cell and cell cycle time (mean 31, 1st quartile 11, and 3rd quartile 33). This shows that only a few copies are made for most mRNAs (Figure 2B). This observation is generally consistent with single molecule live-cell imaging (Park et al, 2010). We observed that mRNAs with high synthesis rates encoded ribosomal protein genes and genes involved in ribosome biogenesis, whereas mRNAs with low synthesis rates stemmed from genes that are silenced during normal growth, including most TFs (Figure 2B).
mRNA decay is not correlated with synthesis
DTA measured a median mRNA half-life of 11 min (mean 14, 1st quartile 9, and 3rd quartile 17 min, Figure 2B). The half-life distribution is strongly right skewed (skewness 8). Thus, most mRNAs in yeast are synthesized and degraded several times during a cell cycle time. Gene ontology (GO) analysis revealed that mRNAs with the shortest half-lives are involved in the regulation of transcription and the cell cycle, and mRNA processing (Figure 2C). In contrast, mRNAs with long half-lives are involved in carbon and nitrogen metabolism and include many transcripts encoding housekeeping enzymes (Figure 2D). The decay rates did not correlate with published rates (Holstege et al, 1998; Wang et al, 2002; Grigull et al, 2004; Shalem et al, 2008), which were obtained with protocols that perturb mRNA metabolism (Supplementary Figure S5). The decay rates did not correlate with mRNA length (Supplementary Figure S6), inconsistent with models that assume stochastic degradation, but consistent with degradation control at the level of mRNA deadenylation and decapping. Many mRNAs with long half-lives contained AU-rich elements in their 3′-untranslated region, consistent with a stabilizing role of these elements (Barreau et al, 2005). Decay rates correlated weakly with mRNA levels (Spearman correlation −0.59), but synthesis rates correlated well with mRNA levels (Spearman correlation 0.84). However, decay rates did not correlate with synthesis rates (Spearman correlation −0.15). This indicates that mRNA decay and synthesis are functionally independent during normal growth, and that both processes contribute to setting cellular mRNA levels.
DTA monitors rate changes during osmotic stress
The above analysis and published studies estimate mRNA synthesis and decay rates only in the steady state (Dolken et al, 2008; Amorim et al, 2010). To monitor rate changes, and thus the dynamics in mRNA metabolism, we extended DTA to a time-resolved analysis of the osmotic stress response (Supplementary section 14). Cells were grown up to a logarithmic phase and split into control and sample cultures (Figure 3A). Sodium chloride was added to the sample culture and made up to a concentration of 0.8 M. Control and sample cultures were divided in aliquots, and 4sU was added at 0, 6, 12, 18, 24, and 30 min after salt addition. After labeling for 6 min, total, labeled, and unlabeled RNA was purified and analyzed with gene expression arrays. The rates were estimated using DTA within the time windows 0–6, 6–12, 12–18, 18–24, 24–30, and 30–36 min after stress induction. The results were confirmed for selected genes by quantitative RT–PCR at 12, 30 and 36 min after salt stress, wherein strong rate changes were observed (Supplementary Figure S3).
Figure 3.

Global perturbation of mRNA synthesis and decay upon osmotic stress. (A) Design of the time series experiment. Each time window ( ) corresponds to one sample, left end marks the start of the 4sU labeling, right end marks the time of mRNA extraction. Upper panel shows the drop in labeling efficiency from roughly one 4sU in 200 uridines to one 4sU in 400 uridines during the osmotic stress response. (B) Increased sensitivity and temporal resolution of DTA compared with standard transcriptomics. Gray, time course of the total mRNA fraction of the Hog1-induced genes (Capaldi et al, 2008). Red, time course of the synthesis rates of the same gene set. The solid lines represent the time course of the median, the shaded bands are the central 95% regions. In contrast to the monotonically increasing total mRNA time course, the synthesis rates clearly show three response phases. (C) Expression changes of the five clusters (up, up-even, even, down-even, down—see Materials and methods) that were defined in a normalization-independent manner. The box plot shows synthesis rate folds (30 versus 0 min). (D) Dynamics of synthesis and decay rates in the osmotic stress time series. Each diagram corresponds to one time point. Each point corresponds to one gene, which is colored according to its affiliation with one of the clusters in (C). Ellipses show the 75% regions of highest density within each cluster, assuming Gaussian distributions. The shape of the ellipses indicates the correlation structure within a cluster.
Three phases of the osmotic stress response
DTA resolved the three phases of the osmotic stress response with unprecedented clarity. In the first 12 min after salt addition (shock phase), essentially all synthesis and decay rates decreased, reflecting global transcription downregulation and mRNA stabilization. Within 12–24 min after salt addition (induction phase), synthesis rates strongly increased for a subset of mRNAs. These stress-induced mRNAs show increased decay rates, likely to ensure their rapid removal toward the end of the response. Finally, decay rates were mostly restored, whereas a fraction of the synthesis rates remained at levels distinct from the starting values (recovery phase). We could not monitor complete recovery, which takes about 2 h (Macia et al, 2009), but a fraction of synthesis rates apparently remains at values different from the starting values, to ensure continued expression of salt homeostasis genes, and lower expression of housekeeping genes. DTA also revealed a drop of labeling efficiency from 0.5% (1 4sU in ∼200 nucleotides) to 0.27% (Figure 3A), reflecting the known inhibition of cellular uptake of small molecules during stress.
Temporary correlation of mRNA synthesis and decay rates
We transformed all rates to their ranks within the rate distributions, to circumvent an error-prone estimation of an unknown normalization factor between measurements at different time points. By comparing the ranks of synthesis rates in the datasets, 6 and 36 min after salt addition, five clusters of genes were defined (Figure 3C): ‘up’ (217 genes, rank gain >2000), ‘up-even’ (456 genes, rank gain 1000–2000), ‘down-even’ (498 genes, rank loss 1000–2000), ‘down’ (401 genes, rank loss >2000), and ‘even’ (all remaining 2936 genes). Although global mRNA synthesis and decay were not correlated before stress, some gene groups showed positive and negative correlations during stress (Figure 2B). An analysis of the changes in synthesis and decay rates reveals a temporary interdependence of the rate changes of mRNA synthesis and decay during the first two stress phases (Figure 3D, Supplementary movie). During the shock phase, a decrease in synthesis rate generally goes along with a decrease in decay rate. During the induction phase, an increase in synthesis rates generally goes along with an increase in decay rate. They again become uncorrelated during recovery. The nature of a possible physical coupling underlying this temporary correlation of rates remains to be explored.
High temporal resolution reveals mRNA dynamics
Resolution of the three phases of stress response depended on DTA and was not possible by measuring total mRNA levels alone (Figure 3B). To test the performance of DTA with an unbiased gene set, we monitored the previously described 305 Hog1-responsive genes (Capaldi et al, 2008). DTA detected an initial decrease in synthesis rates during shock, whereas total RNA levels increased (Figure 3B). This was, however, not due to increased transcriptional activity, but rather due to residual transcription activity combined with mRNA stabilization (Figure 3D). Also, the signal-to-noise ratio in detection of changes in synthesis rates was on average two times higher than that of measuring differences in total mRNA levels (Supplementary Figure S7). Thus conventional transcriptomics fails to unveil the nature of the changes in mRNA metabolism upon stress, which are however monitored by DTA.
High sensitivity reveals new stress response genes
Owing to the increased sensitivity, DTA reveals many genes that are induced during stress. The up cluster contained genes associated with GO terms related to stress response. Of the stress module genes as defined by the Iterative Structure Algorithm (Ihmels et al, 2002), 74% showed a rank gain greater than 1000. The up cluster contained only three TFs, consistent with the pre-existence of TFs for stress response and their post-transcriptional activation (Proft and Struhl (2004), and references therein). The up cluster contained 62% of the genes that were considered significantly upregulated by a factor of at least two in a recent study of the osmotic stress response (Capaldi et al, 2008). However, DTA also detected 58 new genes involved in the osmotic stress response (Materials and methods, Supplementary Figure S8). These are mostly genes of unknown function, except Ubc5, which is known to mediate degradation of abnormal proteins during cellular stress. Of genes in the up cluster, 35% were uncharacterized, compared with only 16% over all yeast genes. Yeast strains with single knockouts of the newly revealed stress genes did not generally show growth defects under high salt conditions (Supplements, Part IV), providing a possible explanation for why they were not discovered previously.
TFs underlying stress response
To identify TFs that activate salt stress genes, we asked whether the target genes of a TF (MacIsaac et al, 2006) were enriched amongst genes in the up or down clusters. A Fisher test for TFs with more than 20 targets (84 TFs) found nine significant TFs (Figure 4A, Materials and methods). TFs with targets enriched in the up cluster included Msn2, Msn4, and Sko1, which are known to act in the Hog1 MAPK pathway, and the heat shock factor Hsf1, consistent with the existence of a core set of stress response TFs in yeast. Other TFs included Nrg1, which inhibits stress response genes under non-stress conditions (Vyas et al, 2005), and Aft1 and Aft2, which control Hsp26 and are involved in the oxidative stress response (Courel et al, 2005). The analysis further revealed Snt2, which has not been implicated in osmotic stress response. In the down cluster, the only overrepresented TF was Gcn4, an activator of amino acid biosynthesis (Hinnebusch, 2005), which is downregulated during stress (Gasch and Werner-Washburne, 2002). GO analysis of the down cluster genes revealed an enrichment of genes with functions in ribosome biogenesis and RNA processing, consistent with a halt of ribosome production during stress (Gasch and Werner-Washburne, 2002). Generally, only 10–30% of the target genes of a TF were induced or repressed (Figure 4B). Such regulation of specific subsets of genes is likely achieved by cooperative TF interactions.
Figure 4.

Analysis of transcription factor (TF) activity. (A) For each TF, the proportion of induced/repressed genes in the set of the TF targets is compared with that in the TF target complement set. TFs with less than 20 targets were filtered out beforehand. Log odds ratios for the induced (up cluster, red) and repressed (down cluster, blue) genes are plotted on the left hand side. The right side shows the negative decadic log P-value of the corresponding Fisher tests (red for the induced genes, blue for the repressed genes). A P-value of 10−5 was considered significant, and only these findings are shown. (B) Time series of TF activity. Each line represents the time course of the 90% quantiles (solid lines) resp. 10% quantiles (dotted lines) of the synthesis rates of the target genes of a TF. The 90% quantiles of the activatory TFs from (A) are shown in red, the 10% quantiles of the repressive TF is shown in blue.
TF cooperativity
We established an in silico TF–TF interaction screen to predict condition-specific TF cooperativity between pairs of TFs using the DTA mRNA synthesis rates. As the basis for our investigation, we used the target gene sets defined for a larger number of TFs (MacIsaac et al, 2006). To score the interaction of a TF pair (TF1, TF2), the TF target sets from MacIsaac et al, were used to divide genes into four classes: genes targeted neither by TF1 nor TF2 (the baseline group), genes targeted by TF1 only (group 1), genes targeted by TF2 only (group 2), and genes targeted by TF1 and TF2 simultaneously (group 3) (Supplementary section 22.1). We compared the mRNA synthesis rates in groups 1–3 with the baseline group and assessed whether the effects in group 3 can be explained by the combined effects in group 1 and group 2. The difference between the observed effects in group 3 and the expected effects in group 3 (calculated from the effects in groups 1 and 2) gives a measure of interaction.
Two different models were developed that assign an interaction score to each TF pair (logistic regression model, Supplementary section 22.2, odds ratio model, Supplementary section 22.3). The calculation of interaction scores for all TF1–TF2 pairs results in a quadratic interaction score matrix. The single entries of this matrix cannot be estimated reliably, because the number of entries to be estimated is on the same order of magnitude as the number of data points (Supplementary section 22.1). Therefore, we follow a strategy for the analysis of synthetic genetic arrays (Pan et al, 2006). An interaction between two proteins is claimed if the interaction profiles of these proteins, i.e., the corresponding rows in the interaction matrix, are sufficiently similar (Figure 5). In our context, profile similarity is quantified with correlation distance, and hierarchical average linkage clustering is used to group TFs according to their similarity.
Figure 5.

Transcription factor cooperativity. Excerpt from the synthetic interaction matrix (SI). Colors from blue (negative) to yellow (positive) map the strength of an interaction, as quantified by our interaction score. Each row shows all interaction scores of one TF with all other TFs. Pairs of triples of TFs having highly correlated interaction profiles are grouped together. Groups that could be validated in the literature are shaded in green.
This analysis resulted in 16 pairs/triples of cooperative TFs (Figure 5). Seven of these TF pairs/triples are known to act synergistically, including Ndd1-Fkh1-Fkh2 (Voth et al, 2007; Romero-Santacreu et al, 2009) and Msn2-Msn4, Ino2-Ino4, Swi4-Swi6, Hap3-Hap4, Arg80-Arg81, and Ste12-Dig1 (Stark et al, 2006). Thus, our screen detected TF cooperativity with high specificity. Nine novel cooperative TF pairs/triples were detected for which we could not find evidence in literature or in databases (SGD, STRING), namely Yap1-Yap7, Yap5-Gat3, Sok2-Sut1, Gcr2-Azf1, Gln3-Yap6, Cst6-Dal80, Sko1-Aft2, Tec1-Stb1, and Spt23-Arr1-Stb2 (Figure 5).
Genomic Pol II redistribution predicts mRNA synthesis rate changes
To investigate whether mRNA synthesis rates correlate with the presence of Pol II at transcribed genes, we determined occupancy profiles for the Pol II subunit Rpb3 by chromatin immunoprecipitation (ChIP) and tiling microarray (chip) analysis, and calculated the mean Pol II occupancy between the transcription start site (TSS) and the polyadenylation site (pA) for each gene (Mayer et al, 2010). We also measured ChIP-chip profiles 12 and 24 min after salt addition, to investigate whether Pol II is redistributed over the genome upon stress. At all three time points (0, 12, and 24 min), the mean Pol II gene occupancy was calculated. The three resulting Pol II occupancy vectors were compared with the vectors of total RNA, newly synthesized RNA, and synthesis rates at all six 6-min time windows of the osmotic stress (Figure 6).
Figure 6.

Pol II gene occupancy predicts mRNA synthesis. The vectors of mean Pol II occupancies on transcribed regions were calculated from ChIP-chip data at 0, 12, and 24 min after salt stress and compared with the vectors of total mRNA levels (left), labeled mRNA (middle), and synthesis rates (right) at each time point of the osmotic stress time course experiment. The pair-wise Spearman correlation values are represented by color-coded squares.
Pol II gene occupancies at 0, 12 and 24 min correlated only weakly with mRNA levels, but very well with the levels of labeled mRNA and with the synthesis rates at the corresponding time points (Figure 6). The results also demonstrated the inferior temporal resolution of standard transcriptomics, as Pol II occupancy 12 and 24 min after stress induction correlated with mRNA levels at a later time point (Figure 6). We averaged Pol II occupancy profiles over genes belonging to the even, down, and up clusters (Figure 7). The even cluster showed a typical gene-averaged profile with elevated Pol II levels on the transcribed region and peaks around the TSS and pA site. This profile persisted during stress, although overall polymerase levels decreased. The down cluster genes apparently lost most if not all Pol II during stress. In contrast, the up cluster genes did not contain detectable amounts of Pol II before stress but gained Pol II during stress. The shape of the averaged profile of up cluster genes after 24 min of salt stress showed an even distribution of Pol II that was very different from the canonical profile (Figure 7), maybe because of a high density of Pol II on these stress-induced genes. Thus, Pol II occupancy predicted mRNA synthesis rates and Pol II redistribution upon stress predicted changes in synthesis rates. On the other hand, the observed correlations confirm that DTA realistically monitors changing transcriptional activity.
Figure 7.

Global Pol II redistribution upon osmotic stress. Dynamics of the mean Pol II occupancy profiles of the up-, even- and down clusters from Figure 3C. Only genes of at least 1000 base pairs (bps) are considered. Profiles are taken after 0, 12, and 24 min of osmotic stress (light blue, blue, and dark blue lines). Vertical dotted lines are drawn at the transcription start site (TSS) and the polyadenylation site (pA) site. The plot shows the ±500 bp regions around the TSS and the pA sites, together with the intermediate part, which has been rescaled to a length of 400 (Supplementary section 16). The Pol II profiles of all genes and all clusters are displayed in (Supplementary Figure S26).
Discussion
In this study, we develop DTA as a tool for measuring mRNA synthesis and decay rates in yeast on a global scale and in a dynamic manner without system perturbation. DTA involves genetically facilitated cellular uptake of the nucleoside analog 4sU, metabolic RNA labeling, separation and microarray analysis of three different RNA fractions (total, newly transcribed, and pre-existing RNA). A quantitative dynamic model then enables extraction of synthesis and decay rates from the array data. As we select for polyadenylated RNA in the protocol, and the probes on the array are predominantly located in the 3′ region of transcripts, only complete transcripts are detected and the obtained synthesis rates reflect the production of complete mRNAs. The application of DTA to growing yeast cells revealed that most genes produce only a few copies of mRNA per cell per cell cycle time, and that transcript turnover is generally rapid, with a median mRNA half-life of 11 min, as well as that synthesis and decay are generally not correlated.
DTA was used to follow dynamic changes in mRNA synthesis and decay rates, as exemplified by the osmotic stress response. This showed that DTA has higher sensitivity and temporal resolution than ordinary transcriptomics, and thus provides new biological insights. DTA identified 58 new genes induced by osmotic stress, including many genes of unknown function. By combining this approach with a new in silico interaction screen, TFs that cooperate in stress gene induction were readily detected without the need to perform single and double perturbations for each pair of candidates. DTA also revealed a correlated alteration of mRNA synthesis and decay during the first two phases of the stress response. In the initial shock phase, transcription is globally slowed down and mRNAs are stabilized, apparently to store them. During the subsequent induction phase, synthesis rates for a subset of mRNAs are strongly increased, and the resulting mRNAs are destabilized, thus allowing for their rapid removal after stress. During recovery, decay rates are restored whereas synthesis rates may remain at altered values.
More generally, altered gene expression programs resulting from cellular adaptation may involve persistently altered mRNA synthesis rates, whereas mRNA decay rates may be similar for different programs. Indeed, theoretical considerations show that changes in synthesis rate can more quickly change mRNA levels for transcripts with low abundance, which dominate in the cell (Alon, 2006). Changes in decay rate can only efficiently change mRNA levels for highly abundant transcripts. This concept is realized in the osmotic stress response, and likely in other gene regulatory systems.
Many of our observations are consistent with published data on the osmotic stress response. Genomic run-on analysis showed that osmotic stress provokes mRNA stabilization and sequestration into P-bodies (Romero-Santacreu et al, 2009). P-bodies develop at 0.8 M NaCl within minutes (Teixeira and Parker, 2007). Global transcription inhibition showed that repressed mRNAs are stabilized, whereas induced mRNAs are destabilized (Molin et al, 2009). The rapid decrease of mRNA synthesis and decay rates during the shock phase is pre-transcriptional as suggested (Proft and Struhl, 2004; Mettetal et al, 2008). This may go along with a transient depression of translationally active ribosomes (Warringer et al, 2010). Part of the shock response may stem from changing the post-translational modification of pre-existing proteins, as 15% of protein phosphorylation sites change within 5 min after stress (Soufi et al, 2009). Only during the induction phase, an increase in abundance of a subset of proteins occurs that correlates with an increase in mRNA levels (Supplementary Figure S27). A correlated response of mRNA levels and the translatome is also revealed by global analysis of ribosome-associated mRNAs (Halbeisen and Gerber, 2009). In the future, insights from DTA and Pol II profiling may be used to improve models of the osmotic stress response (Capaldi et al, 2008; Muzzey et al, 2009).
The mRNA synthesis rates obtained by DTA are robust and realistic, as they correlate with Pol II occupancy of transcribed regions, as measured here by ChIP-chip profiling. DTA and Pol II ChIP-chip apparently monitor the same biological process, transcriptional activity, in contrast to conventional transcriptomics, which monitors mRNA levels. Thus, previously obtained correlations of Pol II occupancy with mRNA levels (Andrau et al, 2006; Steinmetz et al, 2006; Pelechano et al, 2009; Venters and Pugh, 2009; Mayer et al, 2010; Rodriguez-Gil et al, 2010) are only an indirect effect of the correlation of mRNA synthesis rates with mRNA levels as reported here. DTA-derived rates of mRNA synthesis are averaged over a cell population and a time period of 6 min, suggesting that they are independent of the nature of transcription, which may occur in bursts and discontinuously.
DTA has a great potential for studying gene regulatory systems and mRNA metabolism. It may be used to characterize gene expression programs under defined conditions, and to analyze the influence of changes in environmental conditions or the effect of small molecules on mRNA turnover. It may also be used to study the global mechanisms of gene regulation by introducing mutations that interfere with particular aspects of transcription and its regulation. DTA may further be used to decipher the pathways of mRNA decay and the global regulation of mRNA half-lives by RNA-binding proteins. Such studies however require genetic perturbation and, therefore, new tools for the normalization of rates extracted from array measurements with mutant and wild-type yeast strains.
Materials and methods
RNA labeling and microarray analysis
We used S. cerevisiae strain BY4741 MATa, his2Δ1, leu2Δ0, met15Δ0, ura3Δ0 (Euroscarf). The strain was transformed with plasmid YEpEBI311 (2 μm, LEU2) carrying the human equilibrative nucleoside transporter hENT1. Samples for establishing DTA were grown in SD medium overnight, diluted to an OD600 of 0.1 the next day and grown up to a mid-log phase (a final OD600 of 0.8 corresponding to 1.75 × 10⁷ cells per ml). 4sU (Sigma) was added to the media and made up to a final concentration of 500 μM, and cells were harvested after different labeling times. Cells were centrifuged at 4000 r.p.m. for 1 min and pellets were flash-frozen in liquid nitrogen. Samples for quantitative RT–PCR and for salt-stress experiments were grown in SILAC medium lacking leucine (6.7 g/l Formedia yeast nitrogen base without amino acids, 2% glucose, 2% agar, 200 mg/l adenine, 200 mg/l tyrosine, 10 mg/l histidine, 10 mg/l methionine, 60 mg/l phenylalanine, 40 mg/l tryptophan, and 20 mg/l uracil) overnight, diluted to an OD600 of 0.1 the next day and grown up to a final OD600 of 0.8. Cells were harvested 0, 6, 12, 18, 24, 30, and 36 min after addition of NaCl up to a final concentration of 0.8 M. Other steps were as above.
Total RNA was extracted with the RiboPure-Yeast Kit (Ambion/Applied Biosystems), following the manufacturer's protocol. Labeled RNA was chemically biotinylated and purified using strepatavidin-coated magnetic beads as described (Dolken et al, 2008). Labeling of samples for array analysis was performed using the GeneChip 3′IVT labeling assay (Affymetrix) with 100 ng input RNA. Samples were hybridized to GeneChip Yeast Genome 2.0 microarrays following the instructions from the supplier (Affymetrix). Quality control and array processing was done using GCRMA (Wu et al, 2004) for expression quantification and LIMMA (Smyth and Speed 2003) for elementary array comparisons (Supplementary sections 12.1–12.5).
Pol II in vitro transcription
To determine the incorporation efficiency of 4sUTP by Pol II, we performed in vitro RNA extension assays with reconstituted elongation complexes containing a synthetic nucleic acid scaffold with an adenine base in templating position +1 and +2 (Scaffold A, Sydow et al, 2009). The assembled ECs were incubated with 0.002, 0.01, 0.05, 0.25, or 1.25 μM of 4sUTP or UTP. Reactions were stopped at 10 min and product RNAs were separated by gel electrophoresis and quantified with a fluorimager. Lineweaver-Burk plots were used to analyze Michaelis-Menten kinetics KM values of 13 nM and 3 nM for 4sUTP and UTP, respectively, but the same rate constant kcat. Bead-based assays were as described (Dengl and Cramer, 2009; Sydow et al, 2009).
mRNA decay analysis by RT–PCR
mRNA levels were determined for eight genes: ACT 1 (YFL039C), CTT1 (YGR088W), GPD1 (YDL022W), KSS1 (YGR040W), RDN1 (rRNA locus), SFG1 (YOR315W), STL1 (YDR536W), and TUB2 (YFL037W). The experiment was performed in two steps. Step 1 was performed under normal growth conditions whereas step 2 was performed the same way after addition of 0.8 M NaCl. mRNA levels were analyzed at 0, 2.5, 6, 10, and 16 min after addition of 1,10-phenanthroline (100 μg/ml final concentration) and at 0, 12, 30, and 36 min. 4sU labeling was carried out for 6 min at a final concentration of 500 μM (Supplementary Figure S3). RNA was extracted as above. cDNA synthesis was performed with 500 ng RNA originating from total, unlabeled and labeled mRNA using the iScript cDNA Synthesis Kit (BioRad). Primers were designed with the ProbeFinder software (Roche Applied Science) and individual primer-pair efficiency was tested and ranged between 95 and 100%. Sequence information of primer pairs used in this study is available upon request. PCR reactions contained 1 μl DNA template, 2 μl of 10 μM primer pairs, and 12.5 μl SsoFast EvaGreen Supermix (BioRad). Quantitative RT–PCR was performed on a Bio-Rad CFX96 Real-Time System (Bio-Rad Laboratories Inc.) using a 3 min denaturing step at 95°C, followed by 49 cycles of 30 s at 95°C, 30 s at 61°C, and 15 s at 72°C. Threshold cycle (Ct) values were determined by application of the corresponding Bio-Rad CFX Manager software version 1.1 using the Ct determination mode ‘Regression’. Two biological and three technical replicates were used for each time point and technical variance was minimized using in-plate controls.
Extraction of mRNA synthesis and decay rates
Suppose we performed an experiment in which the cells were harvested after a 4sU-labeling period of t minutes. During the labeling period, 4sU is integrated into newly synthesized mRNA. The total mRNA amount at time t, therefore, consists of two fractions, the pre-existing (unlabeled) mRNA and the newly synthesized (labeled) mRNA. Without any disturbance of the cells, the synthesis rates μg and decay rates λg pertaining to a transcript g are considered constant if averaged over a cell cycle period. Although there are transcripts whose synthesis rates vary considerably during the cell cycle, this assumption is valid as we measure a large, unsynchronized ensemble of cells. The same argument holds if transcription happens in bursts. Thus, for unsynchronized cells, DTA measures the cell cycle and population average of mRNA synthesis and decay rates. Synthesis and decay together determine the equilibrium (steady-state) mRNA level. Let Ag (resp. Bg,Cg) represent the newly synthesized (resp. pre-existing, total) mRNA amount of gene g, after appropriate normalization. The pre-existing mRNA fraction follows an exponential decay law given by 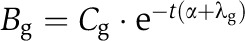 , or equivalently,
 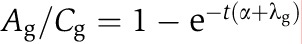 . Here, α is a parameter accounting for the fact that the total mRNA amount of all cells is exponentially growing at a rate α (recall that we harvest the cells during mid-log phase). The unknown decay rate can be obtained by solving for λg. Once the decay rate is known, the corresponding half-life is given by (ln2)/λg. The steady-state assumption implies that mRNAs decay at the same rate as they are synthesized, thus the synthesis rates can be derived from the decay rates by
The above equations reflect an idealized situation in which the three mRNA fractions can be measured without any bias caused by mRNA labeling inefficiency, incomplete biotinylation and strepavidin purification, differences in the preparation of arrays etc. Moreover, the equations do not account for unsystematic variance in the measurements. A complete and detailed description of the model is provided in the supplements (Supplementary section 13.1 for the model, Supplementary section 13.2 for the normalization/estimation algorithm).
Estimation of mRNA labeling efficiency
A key feature of the data normalization is the correction for incomplete 4sU labeling, the so-called labeling bias. Let p be the fraction of uridine residues that are replaced by 4sU during transcription in the labeling period and which are afterwards biotinylated. We assume that every biotinylated mRNA is captured and contributes to the measured labeled mRNA fraction. Furthermore, assuming that the incorporation of uridine resp. 4sU at each position happens stochastically and independently, the probability that a newly synthesized mRNA molecule with a total of #u uridines does not accidentally contain any 4sU residue is given by 1−(1−p)#u. This introduces a #u-dependent bias in favor of the unlabeled mRNA fraction such that the measured quotient of labeled/total mRNA becomes #u-dependent and is proportional to 1−(1−p)#u (Figure 2A). This bias in turn results in a systematic, non-linear prolongation of half-life estimates, in particular for short transcripts (Supplementary section 13.3, Supplementary Figures S15, S17 and S18). The analysis of our experimental data revealed that every ∼200th uridine residue of the mRNA pool is replaced by 4sU (Figure 3A). Note that without this bias correction, the Spearman correlation between mRNA lengths and decay rates is 0.64, whereas it vanishes after normalization (correlation 0.06, Supplementary Figure S6). We performed extensive simulations to make sure that our estimation procedure is able to recover the true decay rates (supplements Section 13.4), and we checked whether it yields reproducible results for replicate experiments (Supplementary section 13.5). If the steady-state assumption (constant mRNA levels) does not hold, the normalization procedure and the half-life estimation process have to be adapted (Supplements, Section 14).
Discovery of TFs involved in the osmotic stress response
In order to discover the main players of transcriptional regulation during osmotic stress, we needed to define for each TF a set of reliably targeted genes with a low number of false positive annotations. We decided to use the TF-target relation obtained from a reanalysis of the (Harbison et al, 2004) ChIP-chip data by McIsaac et al (2006). We defined the set of induced and repressed genes as the up or down cluster genes. For each TF, a Fisher's test was performed to assess whether the fraction of induced or repressed genes is enriched in the set of TF targets, relative to the set of non-targets (Supplementary section 21). We considered TFs active if they had a P-value of <10−6 (significance) and an odds ratio >2 (relevance).
TF interaction screen
We considered only TFs with more than 20 targets to make inference more stable. Let TF1 and TF2 be TFs. Let I[g∈TFj] denote the function which indicates whether a gene g is targeted by TF TFj (MacIsaac et al, 2006). For each pair (TF1, TF2) of TFs, we perform a second-order logistic regression on all genes g∈G:
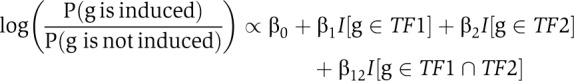 |
The log odds for a gene of being induced are explained by a baseline effect (β0), the single TF effects (β1 and β2), and an interaction effect (β12).
The log odds term at the left hand side of the above equation is obtained from the R package limma (Gordon Smyth), using the eBayes function for the statistical comparison of the synthesis rates at t=30 min versus wild type. The interaction score of TF1 and TF2 is defined as the interaction coefficient β12=β12(TF1, TF2) obtained from the regression. This procedure leads to a matrix M=(β12(TF1, TF2))TF1,TF2. The distance between two TFs is defined as the correlation distance of their corresponding row vectors, d(TF1,TF2)=1−cor(MTF1,MTF2,). Average linkage hierarchical clustering is applied to group TFs according to their similarity. The tightest subclusters are reported in Results. For details, see Supplementary section 22.
Genomic occupancy profiling
For genomic occupancy profiling by ChIP-chip, we used S. cerevisiae strain BY4741 containing a C-terminal tandem affinity purification (TAP) tag on the Pol II subunit Rpb3 (Open Biosystems). We confirmed that the TAP tag was at the correct genomic position, that the tagged Rpb3 subunit was expressed, and that the strain grew normally at 30°C. Yeast cells were grown in YPD medium until exponential phase (OD600∼0.8) and then stressed by the addition of 0.8 M NaCl. ChIP-chip was performed for biological replicates 0, 12, and 24 min after salt addition with high-resolution tiling microarrays as described in (Mayer et al, 2010). The bioinformatics analysis has been done using the R/Bioconductor software package Starr (Zacher et al, 2010), see (Supplements, Part II, Section 16–18).
Accession codes
Microarray data were deposited in ArrayExpress under accession code E-MTAB-439.
Supplementary Material
Supplementary information, Supplementary figures S1–8, Supplementary tables S1–3
Acknowledgments
We thank R-P Jansen (Universität Tübingen) and S Jellbauer (Gene Center Munich) for providing the plasmid expressing hENT1. PC was supported by the Deutsche Forschungsgemeinschaft, the SFB646, the TR5, the Jung-Stiftung, and the Boehringer Ingelheim Fonds. DM, KM, and PC were supported by a LMUexcellent research professorship. LD was supported by the German Bundesministerium für Bildung und Forschung (NGFN-Plus #01GS0801). BS and AT were supported by a LMUexcellent guest professorship.
Author contributions: CM and KM conducted DTA experiments, BS, SD, BZ, and AT developed the statistical workflow and carried out computational analysis, DS and AM conducted ChIP experiments, JS conducted enzymatic assays, LM, LD, and DEM conducted initial experiments, LD and PC initiated the study, DEM supervised experimental work, and AT and PC supervised research and wrote the manuscript.
Footnotes
The authors declare that they have no conflict of interest.
References
- Alon U (2006) An Introduction to Systems Biology: Design Principles of Biological Circuits. Boca Raton, Florida: Chapman & Hall/CRC Press [Google Scholar]
- Amorim MJ, Cotobal C, Duncan C, Mata J (2010) Global coordination of transcriptional control and mRNA decay during cellular differentiation. Mol Syst Biol 6: 380. [DOI] [PMC free article] [PubMed] [Google Scholar]
- Andrau JC, van de Pasch L, Lijnzaad P, Bijma T, Koerkamp MG, van de Peppel J, Werner M, Holstege FC (2006) Genome-wide location of the coactivator mediator: Binding without activation and transient Cdk8 interaction on DNA. Mol Cell 22: 179–192 [DOI] [PubMed] [Google Scholar]
- Barreau C, Paillard L, Osborne HB (2005) AU-rich elements and associated factors: are there unifying principles? Nucleic Acids Res 33: 7138–7150 [DOI] [PMC free article] [PubMed] [Google Scholar]
- Brueckner F, Hennecke U, Carell T, Cramer P (2007) CPD damage recognition by transcribing RNA polymerase II. Science 315: 859–862 [DOI] [PubMed] [Google Scholar]
- Capaldi AP, Kaplan T, Liu Y, Habib N, Regev A, Friedman N, O’Shea EK (2008) Structure and function of a transcriptional network activated by the MAPK Hog1. Nat Genet 40: 1300–1306 [DOI] [PMC free article] [PubMed] [Google Scholar]
- Causton HC, Ren B, Koh SS, Harbison CT, Kanin E, Jennings EG, Lee TI, True HL, Lander ES, Young RA (2001) Remodeling of yeast genome expression in response to environmental changes. Mol Biol Cell 12: 323–337 [DOI] [PMC free article] [PubMed] [Google Scholar]
- Cleary MD, Meiering CD, Jan E, Guymon R, Boothroyd JC (2005) Biosynthetic labeling of RNA with uracil phosphoribosyltransferase allows cell-specific microarray analysis of mRNA synthesis and decay. Nat Biotechnol 23: 232–237 [DOI] [PubMed] [Google Scholar]
- Courel M, Lallet S, Camadro JM, Blaiseau PL (2005) Direct activation of genes involved in intracellular iron use by the yeast iron-responsive transcription factor Aft2 without its paralog Aft1. Mol Cell Biol 25: 6760–6771 [DOI] [PMC free article] [PubMed] [Google Scholar]
- de Nadal E, Posas F (2010) Multilayered control of gene expression by stress-activated protein kinases. EMBO J 29: 4–13 [DOI] [PMC free article] [PubMed] [Google Scholar]
- Dengl S, Cramer P (2009) Torpedo nuclease Rat1 is insufficient to terminate RNA polymerase II in vitro. J Biol Chem 284: 21270–21279 [DOI] [PMC free article] [PubMed] [Google Scholar]
- Dolken L, Ruzsics Z, Radle B, Friedel CC, Zimmer R, Mages J, Hoffmann R, Dickinson P, Forster T, Ghazal P, Koszinowski UH (2008) High-resolution gene expression profiling for simultaneous kinetic parameter analysis of RNA synthesis and decay. RNA 14: 1959–1972 [DOI] [PMC free article] [PubMed] [Google Scholar]
- Escote X, Zapater M, Clotet J, Posas F (2004) Hog1 mediates cell-cycle arrest in G1 phase by the dual targeting of Sic1. Nat Cell Biol 6: 997–1002 [DOI] [PubMed] [Google Scholar]
- Friedel CC, Dolken L (2009) Metabolic tagging and purification of nascent RNA: Implications for transcriptomics. Mol BioSystems 5: 1271–1278 [DOI] [PubMed] [Google Scholar]
- Garcia-Martinez J, Aranda A, Perez-Ortin JE (2004) Genomic run-on evaluates transcription rates for all yeast genes and identifies gene regulatory mechanisms. Mol Cell 15: 303–313 [DOI] [PubMed] [Google Scholar]
- Gasch AP, Spellman PT, Kao CM, Carmel-Harel O, Eisen MB, Storz G, Botstein D, Brown PO (2000) Genomic expression programs in the response of yeast cells to environmental changes. Mol Biol Cell 11: 4241–4257 [DOI] [PMC free article] [PubMed] [Google Scholar]
- Gasch AP, Werner-Washburne M (2002) The genomics of yeast responses to environmental stress and starvation. Funct Integr Genomics 2: 181–192 [DOI] [PubMed] [Google Scholar]
- Grigull J, Mnaimneh S, Pootoolal J, Robinson MD, Hughes TR (2004) Genome-wide analysis of mRNA stability using transcription inhibitors and microarrays reveals posttranscriptional control of ribosome biogenesis factors. Mol Cell Biol 24: 5534–5547 [DOI] [PMC free article] [PubMed] [Google Scholar]
- Halbeisen RE, Gerber AP (2009) Stress-Dependent Coordination of Transcriptome and Translatome in Yeast. PLoS Biol 7: e105. [DOI] [PMC free article] [PubMed] [Google Scholar]
- Harbison CT, Gordon DB, Lee TI, Rinaldi NJ, MacIsaac KD, Danford TW, Hannett NM, Tagne JB, Reynolds DB, Yoo J, Jennings EG, Zeitlinger J, Pokholok DK, Kellis M, Rolfe PA, Takusagawa KT, Lander ES, Gifford DK, Fraenkel E, Young RA (2004) Transcriptional regulatory code of a eukaryotic genome. Nature 431: 99–104 [DOI] [PMC free article] [PubMed] [Google Scholar]
- Hereford LM, Rosbash M (1977) Number and distribution of polyadenylated RNA sequences in yeast. Cell 10: 453–462 [DOI] [PubMed] [Google Scholar]
- Hinnebusch AG (2005) Translational regulation of GCN4 and the general amino acid control of yeast. Annu Rev Microbiol 59: 407–450 [DOI] [PubMed] [Google Scholar]
- Hodson JA, Bailis JM, Forsburg SL (2003) Efficient labeling of fission yeast Schizosaccharomyces pombe with thymidine and BUdR. Nucleic Acids Res 31: e134. [DOI] [PMC free article] [PubMed] [Google Scholar]
- Hohmann S, Krantz M, Nordlander B (2007) Yeast osmoregulation. Methods Enzymol 428: 29–45 [DOI] [PubMed] [Google Scholar]
- Holstege FC, Jennings EG, Wyrick JJ, Lee TI, Hengartner CJ, Green MR, Golub TR, Lander ES, Young RA (1998) Dissecting the regulatory circuitry of a eukaryotic genome. Cell 95: 717–728 [DOI] [PubMed] [Google Scholar]
- Ihmels J, Friedlander G, Bergmann S, Sarig O, Ziv Y, Barkai N (2002) Revealing modular organization in the yeast transcriptional network. Nat Genet 31: 370–377 [DOI] [PubMed] [Google Scholar]
- Kenzelmann M, Maertens S, Hergenhahn M, Kueffer S, Hotz-Wagenblatt A, Li L, Wang S, Ittrich C, Lemberger T, Arribas R, Jonnakuty S, Hollstein MC, Schmid W, Gretz N, Gröne HJ, Schütz G (2007) Microarray analysis of newly synthesized RNA in cells and animals. Proc Natl Acad Sci USA 104: 6164–6169 [DOI] [PMC free article] [PubMed] [Google Scholar]
- Lam LT, Pickeral OK, Peng AC, Rosenwald A, Hurt EM, Giltnane JM, Averett LM, Zhao H, Davis RE, Sathyamoorthy M, Wahl LM, Harris ED, Mikovits JA, Monks AP, Hollingshead MG, Sausville EA, Staudt LM (2001) Genomic-scale measurement of mRNA turnover and the mechanisms of action of the anti-cancer drug flavopiridol. Genome Biol 2: RESEARCH0041. [DOI] [PMC free article] [PubMed] [Google Scholar]
- Macia J, Regot S, Peeters T, Conde N, Sole R, Posas F (2009) Dynamic signaling in the Hog1 MAPK pathway relies on high basal signal transduction. Sci Signal 2: ra13. [DOI] [PubMed] [Google Scholar]
- MacIsaac KD, Wang T, Gordon DB, Gifford DK, Stormo GD, Fraenkel E (2006) An improved map of conserved regulatory sites for Saccharomyces cerevisiae. BMC Bioinformatics 7: 113. [DOI] [PMC free article] [PubMed] [Google Scholar]
- Mayer A, Lidschreiber M, Siebert M, Leike K, Söding J, Cramer P (2010) Uniform transitions of the general RNA polymerase II transcription complex. Nat Struct Mol Biol 10: 1272–1278 [DOI] [PubMed] [Google Scholar]
- Melamed D, Pnueli L, Arava Y (2008) Yeast translational response to high salinity: global analysis reveals regulation at multiple levels. RNA 14: 1337–1351 [DOI] [PMC free article] [PubMed] [Google Scholar]
- Melvin WT, Milne HB, Slater AA, Allen HJ, Keir HM (1978) Incorporation of 6-thioguanosine and 4-thiouridine into RNA. Application to isolation of newly synthesised RNA by affinity chromatography. Eur J Biochem 92: 373–379 [DOI] [PubMed] [Google Scholar]
- Mettetal JT, Muzzey D, Gomez-Uribe C, van Oudenaarden A (2008) The frequency dependence of osmo-adaptation in Saccharomyces cerevisiae. Science 319: 482–484 [DOI] [PMC free article] [PubMed] [Google Scholar]
- Miller MR, Robinson KJ, Cleary MD, Doe CQ (2009) TU-tagging: cell type-specific RNA isolation from intact complex tissues. Nat Methods 6: 439–441 [DOI] [PMC free article] [PubMed] [Google Scholar]
- Molin C, Jauhiainen A, Warringer J, Nerman O, Sunnerhagen P (2009) mRNA stability changes precede changes in steady-state mRNA amounts during hyperosmotic stress. RNA 15: 600–614 [DOI] [PMC free article] [PubMed] [Google Scholar]
- Muzzey D, Gomez-Uribe CA, Mettetal JT, van Oudenaarden A (2009) A systems-level analysis of perfect adaptation in yeast osmoregulation. Cell 138: 160–171 [DOI] [PMC free article] [PubMed] [Google Scholar]
- Pan X, Ye P, Yuan DS, Wang X, Bader JS, Boeke JD (2006) A DNA integrity network in the yeast Saccharomyces cerevisiae. Cell 124: 1069–1081 [DOI] [PubMed] [Google Scholar]
- Park HY, Buxbaum AR, Singer RH (2010) Single mRNA tracking in live cells. Methods Enzymol 472: 387–406 [DOI] [PMC free article] [PubMed] [Google Scholar]
- Pelechano V, Jimeno-Gonzalez S, Rodriguez-Gil A, Garcia-Martinez J, Perez-Ortin JE, Chavez S (2009) Regulon-specific control of transcription elongation across the yeast genome. PLoS Genet 5: e1000614. [DOI] [PMC free article] [PubMed] [Google Scholar]
- Pelechano V, Perez-Ortin JE (2010) There is a steady-state transcriptome in exponentially growing yeast cells. Yeast 27: 413–422 [DOI] [PubMed] [Google Scholar]
- Proft M, Struhl K (2004) MAP kinase-mediated stress relief that precedes and regulates the timing of transcriptional induction. Cell 118: 351–361 [DOI] [PubMed] [Google Scholar]
- Rodriguez-Gil A, Garcia-Martinez J, Pelechano V, Munoz-Centeno MD, Geli V, Perez-Ortin JE, Chavez S (2010) The distribution of active RNA polymerase II along the transcribed region is gene-specific and controlled by elongation factors. Nucleic Acids Res 38: 4651–4664 [DOI] [PMC free article] [PubMed] [Google Scholar]
- Romero-Santacreu L, Moreno J, Perez-Ortin JE, Alepuz P (2009) Specific and global regulation of mRNA stability during osmotic stress in Saccharomyces cerevisiae. RNA 15: 1110–1120 [DOI] [PMC free article] [PubMed] [Google Scholar]
- Shalem O, Dahan O, Levo M, Martinez MR, Furman I, Segal E, Pilpel Y (2008) Transient transcriptional responses to stress are generated by opposing effects of mRNA production and degradation. Mol Syst Biol 4: 223. [DOI] [PMC free article] [PubMed] [Google Scholar]
- Smyth GK, Speed T (2003) Normalization of cDNA microarray data. Methods 31: 265–273 [DOI] [PubMed] [Google Scholar]
- Soufi B, Kelstrup CD, Stoehr G, Frohlich F, Walther TC, Olsen JV (2009) Global analysis of the yeast osmotic stress response by quantitative proteomics. Mol Biosyst 5: 1337–1346 [DOI] [PubMed] [Google Scholar]
- Stark C, Breitkreutz BJ, Reguly T, Boucher L, Breitkreutz A, Tyers M (2006) BioGRID: a general repository for interaction datasets. Nucleic Acids Res 34: D535–D539 [DOI] [PMC free article] [PubMed] [Google Scholar]
- Steinmetz EJ, Warren CL, Kuehner JN, Panbehi B, Ansari AZ, Brow DA (2006) Genome-wide distribution of yeast RNA polymerase II and its control by Sen1 helicase. Mol Cell 24: 735–746 [DOI] [PubMed] [Google Scholar]
- Sydow JF, Brueckner F, Cheung AC, Damsma GE, Dengl S, Lehmann E, Vassylyev D, Cramer P (2009) Structural basis of transcription: mismatch-specific fidelity mechanisms and paused RNA polymerase II with frayed RNA. Mol Cell 34: 710–721 [DOI] [PubMed] [Google Scholar]
- Teixeira D, Parker R (2007) Analysis of P-body assembly in Saccharomyces cerevisiae. Mol Biol Cell 18: 2274–2287 [DOI] [PMC free article] [PubMed] [Google Scholar]
- Uesono Y, Toh EA (2002) Transient inhibition of translation initiation by osmotic stress. J Biol Chem 277: 13848–13855 [DOI] [PubMed] [Google Scholar]
- Venters BJ, Pugh BF (2009) A canonical promoter organization of the transcription machinery and its regulators in the Saccharomyces genome. Genome Res 19: 360–371 [DOI] [PMC free article] [PubMed] [Google Scholar]
- Voth WP, Yu Y, Takahata S, Kretschmann KL, Lieb JD, Parker RL, Milash B, Stillman DJ (2007) Forkhead proteins control the outcome of transcription factor binding by antiactivation. EMBO J 26: 4324–4334 [DOI] [PMC free article] [PubMed] [Google Scholar]
- Vyas VK, Berkey CD, Miyao T, Carlson M (2005) Repressors Nrg1 and Nrg2 regulate a set of stress-responsive genes in Saccharomyces cerevisiae. Eukaryot Cell 4: 1882–1891 [DOI] [PMC free article] [PubMed] [Google Scholar]
- Wang Y, Liu CL, Storey JD, Tibshirani RJ, Herschlag D, Brown PO (2002) Precision and functional specificity in mRNA decay. Proc Natl Acad Sci USA 99: 5860–5865 [DOI] [PMC free article] [PubMed] [Google Scholar]
- Warringer J, Hult M, Regot S, Posas F, Sunnerhagen P (2010) The HOG Pathway Dictates the Short-term Translational Response after Hyperosmotic Shock. Mol Biol Cell 21: 3080–3092 [DOI] [PMC free article] [PubMed] [Google Scholar]
- Wu Z, Irizarry RA, Gentleman R, Martinez-Murillo F, Spencer FA (2004) A model based background adjustment for oligonucleotide expression arrays. J Am Stat Assoc 468: 909–917 [Google Scholar]
- Zacher B, Kuan P, Tresch A (2010) Starr: Simple Tiling ARRay analysis of Affymetrix ChIP-chip data. BMC Bioinformatics 11: 194. [DOI] [PMC free article] [PubMed] [Google Scholar]
Associated Data
This section collects any data citations, data availability statements, or supplementary materials included in this article.
Supplementary Materials
Supplementary information, Supplementary figures S1–8, Supplementary tables S1–3