

Abstract
How cells manage to get equal distribution of their structures and molecules at cell division is a crucial issue in biology. In principle, a feedback mechanism could always ensure equality by measuring and correcting the distribution in the progeny. However, an elegant alternative could be a mechanism relying on self-organization, with the interplay between system properties and cell geometry leading to the emergence of equal partitioning. The problem is exemplified by the bacterial Min system that defines the division site by oscillating from pole to pole. Unequal partitioning of Min proteins at division could negatively impact system performance and cell growth because of loss of Min oscillations and imprecise mid-cell determination. In this study, we combine live cell and computational analyses to show that known properties of the Min system together with the gradual reduction of protein exchange through the constricting septum are sufficient to explain the observed highly precise spontaneous protein partitioning. Our findings reveal a novel and effective mechanism of protein partitioning in dividing cells and emphasize the importance of self-organization in basic cellular processes.
Keywords: bacterial cell division, Min system, oscillations, protein partitioning, self-organization
Introduction
Many cellular processes and structures are organized around principles of self-organization: the macroscopic organization arises from the dynamic interactions that individual ‘agents’, e.g., proteins, carry out with one another, without the need of global clues and regulation (Karsenti, 2008). Self-organized systems are, therefore, robust and flexible, and examples of self-organization pervade cell biology, ranging from the organization of the mitotic spindle (Sawin et al, 1992) and cleavage furrow positioning (Burkard et al, 2009) to cilia orientation (Marshall, 2010). Self-organization seems to be particularly important for the partitioning of cellular structures, e.g., the centriole and the Golgi, at division (Rodrigues-Martins et al, 2007; Karsenti, 2008). Indeed, proper distribution of all components to the progeny is one of the central problems of cell division, to avoid the adverse effects that an unequal distribution would have on cell growth and regulation.
Fast-growing bacterial cells are particularly exposed to this problem, as corrections of inequalities in protein distribution by biosynthesis could be too slow, given that the timescale of protein production and folding (several minutes) is comparable to the generation time of fast-growing bacteria (∼20 min). Moreover, bacterial proteins are usually stable and, therefore, their levels are not easily adjustable in one generation. It could thus be expected that symmetrically dividing bacteria such as Escherichia coli must have evolved mechanisms to partition proteins that possess a specific address within the cell, but the mechanisms of such partitioning are largely unknown. The problem is exemplified by the oscillating Min proteins—MinC, MinD and MinE—that control the site of the cell division in E. coli to prevent the formation of minicells lacking DNA (de Boer et al, 1989). MinC is the inhibitor of septal ring formation, whereas MinD and MinE confine MinC to the cell poles (Hu and Lutkenhaus, 1999; Raskin and de Boer, 1999b). This set of proteins is most often referred to as the Min system, a name that captures its ‘systemic essence’: the proper function and correct localization pattern arise only when the three proteins are expressed together. In the absence of its partners, each Min protein is in fact homogeneously distributed—MinC (de Boer et al, 1992) and MinE in the cytoplasm (Raskin and de Boer, 1999a), and MinD on the membrane (Raskin and de Boer, 1999a). MinD oscillations arise spontaneously in the presence of MinE (Howard and Kruse, 2005; Kruse et al, 2007): MinD binds to the membrane in the ATP form, MinE binds to MinD on the membrane and catalyzes the ATP hydrolysis to ADP, which causes the release of the MinD/MinE complex from the membrane (Figure 1A). Once in the cytoplasm, ADP to ATP exchange on MinD can occur, and MinD rebinds to the region of the membrane with the lowest MinE levels, which ultimately leads to the periodic spatial oscillations of both proteins between cell poles. MinC is dispensable for the oscillations (Raskin and de Boer, 1999b) and is targeted to the polar regions through its binding to MinD (Hu and Lutkenhaus, 1999). Averaging over multiple cycles creates a non-uniform intracellular distribution of MinD—and thereby of MinC—with the minimum at mid-cell, licensing the assembly of the FtsZ ring and the rest of the cell division machinery there (Hale et al, 2001). Oscillations of the system consisting of purified MinD and MinE have been reproduced in vitro (Loose et al, 2008).
Figure 1.

Min proteins function and transcriptional regulation. (A) Schematic showing how the Min proteins self-organize into a spatial oscillator. See main text for more details. (B) Schematic of the minB operon organization in Escherichia coli. Two promoters controlling the expression of min genes are represented as ovals, with black arrows indicating the direction of transcription; genes are shown as open arrows. Bottom, schematic representation of the expression constructs used to study promoter activity. (C) Activity of indicated promoter constructs in wild-type (wt) MG1655, with or without overexpression of the minB operon, and in MG1655 [ΔminB]. Wild-type cells carrying the empty plasmid were analyzed as a negative control for background fluorescence. Cells were grown in LB medium at 37°C until early exponential phase. Values represent the mean±s.e.m. of data collected in two independent experiments. More than 100 cells were analyzed in each experiment. +minB indicates overexpression of the minB operon at 10 μM salicylate induction.
The complex dynamics of the Min proteins, and the relatively few components involved, have inspired the development of multiple computational models that successfully capture key molecular events leading to oscillations (Howard et al, 2001; Meinhardt and de Boer, 2001; Kruse, 2002; Kulkarni et al, 2004; Drew et al, 2005; Fange and Elf, 2006; Kerr et al, 2006; Pavin et al, 2006). However, despite this relatively good understanding of the system, the behavior of the Min proteins during cell division remained unclear (Hu and Lutkenhaus, 1999; Raskin and de Boer, 1999b). Two models that addressed this question by including cell division (Tostevin and Howard, 2006; Sengupta and Rutenberg, 2007) predicted that each daughter cell should inherit very unequal amounts of Min proteins, often resulting in one daughter cell losing the oscillations altogether. As such unequal partitioning could be detrimental to the cell—rendering oscillations aperiodic and making the determination of mid-cell less precise (Fange and Elf, 2006; Kerr et al, 2006)—it was further proposed that this inequality might be partly compensated by a negative transcriptional feedback of Min proteins on their own expression (Tostevin and Howard, 2006) akin to a feedback existing for the plasmid segregation Par system (Friedman and Austin, 1988). However, a negative feedback would only function efficiently for both the under- and overendowing daughter cells if Min proteins had a short half-life. If they were stable, their levels in the overendowing daughter cell could only be reduced through cell division, with the consequence of these cells having too high levels of the FtsZ inhibitor. Alternatively, the cell could have evolved a mechanism to ensure equal partitioning of Min proteins at division, which was not accounted for by the previous computational analyses. A very recent experimental study of MinD oscillation in dividing cells (Juarez and Margolin, 2010) argued in favor of the later explanation, reporting a relatively equal distribution of MinD between daughter cells at division and proposing that this partitioning is related to a change in the oscillatory regime of MinD about the time of division. However, the mechanism behind this change and its relation to the partitioning remained unclear. In this study, we combine time-lapse fluorescence imaging with stochastic 3D modeling (Di Ventura et al, 2006) to show that all Min proteins are equally inherited by daughter cells after division, and to elucidate the mechanism behind this partitioning. Our analyses demonstrate that partitioning of Min proteins at cell division is achieved as a consequence of (i) the appearance of independent oscillations in each daughter cell just before cell separation and (ii) the following rapid diffusional equilibration of protein concentrations between the two still-connected daughter cells. The first event ensures that each daughter cell possesses a running Min oscillator and that proteins are roughly split between daughters and allows the second event to take place. These two events can, thus, be seen as mechanisms of Min partitioning, and no further regulatory mechanisms appear to be involved. Moreover, we show that the observed changes in Min oscillations can be explained by the known properties of the system, spontaneously arising from the interplay between oscillatory behavior and cell geometry. Self-organization is, therefore, not only responsible for the oscillations of the Min system in a cell, but also ensures equal protein partitioning without the need of any additional regulatory network.
Results
Transcriptional regulation does not compensate for concerted variation in the levels of Min proteins
We first investigated whether the expression of Min proteins might be affected by concerted variation in their levels, subjecting the system to a negative feedback that could compensate initial inequalities in protein partitioning at cell division. For that, the activity of the two promoters that can control transcription of min genes (Figure 1B) was tested in the presence and absence of the Min proteins, or on overexpression of all Min proteins. If a negative feedback was present, we would expect an increased promoter activity in the min operon knockout strain (ΔminB) and reduced activity upon Min overexpression. However, we found no significant differences in expression of the EYFP reporter from either promoter (Figure 1C) and thus conclude that the concerted loss or excess of all Min proteins inherited at cell division cannot be compensated by a negative transcriptional feedback. Moreover, we found that the Min proteins are stable (Supplementary Figure S1), making it further unlikely that transcriptional regulation can efficiently compensate for the inherited excess of these proteins and, therefore, functions as the mechanism to ensure equal distribution of the Min system during successive generations.
All Min proteins are equally partitioned between daughter cells at division
We next determined the precision of segregation of all Min proteins during cell division. To quantify protein fractions inherited by each daughter cell, EYFP fusions to each of the Min proteins were expressed either in the knockout strains or in the wild type, and cells were followed up to their first division under the microscope (see Materials and methods). The resulting distribution of fluorescently labeled proteins in divided cells revealed that MinC, MinD and MinE are rather equally distributed between the two daughter cells (Figure 2A and Supplementary Figure S2A), in contrast to predictions of computational models (Tostevin and Howard, 2006; Sengupta and Rutenberg, 2007), but consistent with a very recent experimental study for MinD (Juarez and Margolin, 2010). Interestingly, the distribution appeared to be somewhat more precise for protein concentrations—estimated as the cell fluorescence divided by the cell area—than for total protein amounts (Supplementary Figure S2A and B). Although the difference in the two distributions was only minor, because of a high accuracy of cell division (Supplementary Figure S2C), it suggested that the underlying partitioning mechanism might primarily work at the level of concentrations. To confirm this hypothesis we determined the distribution of GFP–MinD in the ΔminB strain, in which the divisome assembly is not confined to mid-cell, making it easy to find cells that divide asymmetrically. For such asymmetric divisions wherein the two daughter cells had different volumes, a much better partitioning for protein concentration was obvious (Figure 2B and Supplementary Figure S2D), confirming that proteins get distributed among daughter cells according to their volume. In this study, we only analyzed asymmetric divisions that produced smaller cells of about 2–4 μm length—comparable to that of newborn wild-type cells—and not much smaller anucleate ‘minicells’. Notably, under our conditions, cells as short as 1.4 μm displayed normal pole to pole oscillations, in contrast to a recent report by Fischer-Friedrich et al in which it was proposed that the Min system in short cells does not oscillate but rather exhibits stochastic switching (Fischer-Friedrich et al, 2010).
Figure 2.
Distribution of Min proteins between divided daughter cells. (A) Distribution of fluorescently labeled Min proteins between daughter cells after division. Left panel, strain JW1165 (ΔminC) expressing EYFP–MinC (10 μM IPTG induction). Middle panel, strain JS964 (ΔminB) coexpressing GFP–MinD and MinE (50 μM IPTG induction) from one bicistronic construct. Right panel, strain PB114 (ΔminB) coexpressing MinD and MinE–EYFP (10 μM IPTG induction) from one bicistronic construct. The analysis was performed for pairs of daughter cells originating from the same mother cell. Histograms show the distribution of relative protein levels, defined as the fluorescence in each daughter cell divided by the sum fluorescence in the pair of daughter cells. (B) Distribution of relative concentrations, defined as fluorescence normalized by the cell area (right panel), or levels (left panel) of EYFP–MinD in daughter cells that divided asymmetrically. Both parameters were normalized to the total value in the pair of daughter cells. Asymmetric cell division was analyzed using strain JS964 (ΔminB) coexpressing GFP–MinD and MinE from one bicistronic construct (50 μM IPTG induction). (C) Correlation in relative single-cell concentrations of ECFP–MinD and MinE–EYFP, coexpressed from one bicistronic construct (10 μM IPTG induction) in strain PB114 (ΔminB). Points correspond to individual daughter cells. Source data is available for this figure at www.nature.com/msb.

Finally, we observed a strong correlation in the partitioning of coexpressed fluorescent protein fusions to MinD and MinE in individual cells (Figure 2C), suggesting that the partition of these proteins is tightly coupled and follows a common mechanism.
Changes in the Min oscillatory pattern during cytokinesis
To investigate the nature of the underlying partitioning mechanism, we monitored EYFP–MinD oscillations in single cells over the cell cycle using time-lapse microscopy. Through most of the cycle the oscillations ran from pole to pole, as expected for unconstricted cells. As cells approached division and started constricting the septum, pole to pole oscillations initially continued but the fluorescent area corresponding to membrane-bound MinD gradually extended toward mid-cell (Figure 3A, from 0 to 2456 s, green parentheses). When the septum reached a considerable degree of constriction, the mode of oscillations changed and the fluorescence signal became distributed along the entire membrane of one of the future daughter cells during one half-cycle of the oscillation (Figure 3A, from 3473 to 3522 s, black parentheses). This mode is further referred to as ‘half-cell to half-cell oscillations’. Several minutes later, the second transition occurred toward independent oscillations in each daughter cell, to which we later on also refer as ‘split oscillations’ (Figure 3A, from 3653 to 3921 s, cyan parentheses). These transitions occurred in all analyzed cells that were close to septation.
Figure 3.
Changes in MinD oscillations and protein equilibration between daughter cells during cytokinesis. (A) Changes in MinD oscillatory pattern during the cell cycle, shown for one representative cell. MG1655 cells expressing EYFP–MinD (30 μM IPTG induction) were synchronized (see Materials and methods) and then imaged for short periods at intervals of 7 s at the indicated time points. Green parentheses, pole to pole oscillations. Black parentheses, half-cell to half-cell oscillations. Cyan parentheses, split oscillations. (B) Representative cell of strain JS964 (ΔminB) coexpressing GFP–MinD and MinE (200 μM IPTG induction) showing the transition from half-cell-to-half-cell to split oscillations. Images were acquired every 7 s. Scale bars in A and B represent 3 μm. (C) Quantification of oscillations in a dividing cell. Top, Schematics of the regions used to quantify polar fluorescence in each future daughter cell. LL, left pole of the left daughter cell; LR, right pole of the left daughter cell; RL, left pole of the right daughter cell; RR, right pole of the right daughter cell. Middle and bottom, Fluorescence intensity curves obtained for individual poles of a left daughter cell (middle) and right daughter cell (bottom). Symbol color and filling are as in the top panel. The red arrow indicates the time at which oscillations split between daughter cells (ts). (D) Kinetics of equilibration of EYFP–MinD (diamonds) levels after oscillation splitting indicated by the absolute value of the difference (dfc) between relative protein levels in the two future daughter cells. Equilibration was followed in strain MG1655 expressing EYFP–MinD at 30 μM IPTG (left), or in strain JS964 (ΔminB) coexpressing GFP–MinD and MinE at 200 (middle) or 50 μM (right) IPTG induction. A freely diffusing cytosolic protein, EYFP, is shown as a control (squares) in the left panel. To define the time of splitting in the latter case, EYFP (10 μM salicylate induction) was coexpressed with ECFP–MinD (30 μM IPTG induction). Values represent averages of 22 (left), 5 (middle) and 15 (right) dividing cells, aligned by the time of splitting. Error bars represent s.e.m. Left panel, cells were synchronized before microscopic analysis (see Materials and methods). (E, F) Correlation between septum size and half-cell to half-cell (E) or split oscillations (F). MG1655 cells coexpressing FtsZ–ECFP and EYFP–MinD and MinE from a EYFP–MinDE bicistronic construct were analyzed by time-lapse microscopy to determine the oscillatory MinD pattern and an image of FtsZ–ECFP was taken afterwards to quantify the septum size. Images show the overlay between the YFP and CFP channels. Scale bar represents 3 μm. MinD and MinE were induced using 0.01% arabinose for 3 h, while FtsZ was induced with 5 μM IPTG for 40 min. Source data is available for this figure at www.nature.com/msb.
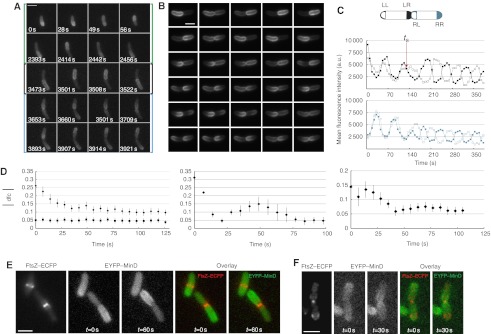
Equilibration of Min proteins levels before completion of cytokinesis
Next, we examined in more detail the EYFP–MinD distribution between daughter cells during the transition from half-cell-to-half-cell to split oscillations and beyond (Figure 3B, Supplementary Figure S3 and Supplementary Movie S1). Although the splitting of the oscillations was apparently already sufficient to partition Min proteins, their distribution was typically skewed. However, this initial inequality was eventually levelled, leaving two daughter cells akin in their fluorescence intensity. To explore this effect quantitatively, we visualized the oscillations as four curves corresponding to the measured fluorescence intensity at each cell pole (Figure 3C). From the curves, it was possible to define a time—which we called ‘time of splitting’ or ts—after which the oscillations run from pole to pole in at least one of the daughter cells. For each time point after ts, we quantified the relative number of EYFP–MinD molecules by the total fluorescence intensity in each future daughter cell, divided by the total fluorescence intensity in the entire mother cell. We then calculated the difference between the relative EYFP–MinD molecules in the respective daughter cells and averaged the absolute value of this difference for all analyzed cells starting from the time of splitting. Although the initial difference between MinD levels in the daughter cells was significant, it decayed rapidly following the splitting of the oscillations (Figure 3D, left panel). This tells us that the oscillation splitting occurs before the septum is completely closed and that Min proteins can indeed equilibrate through the open septum. The precision of protein partitioning, often resulting from several refinements during which the daughter cells alternatively possess a transiently higher fluorescence (Supplementary Figure S6C), was consistent with our previous observations (Figure 2A and B) and approached that of the freely diffusing cytoplasmic control protein (EYFP).
To exclude the possibility that the observed behavior stems from an unphysiological ratio of MinD to MinE, we repeated the experiment while coexpressing GFP–MinD with MinE from a bicistronic construct in the ΔminB background. The observed oscillation and equilibration patterns were similar for this construct (Figure 3B and D, middle and right panels, and Supplementary Movies S2 and S3).
To estimate at which septum size the observed transitions in the oscillatory regime take place, we coexpressed FtsZ–ECFP, EYFP–MinD and MinE in otherwise wild-type cells and correlated MinD oscillatory pattern with the size of the FtsZ ring (Figure 3E and F). In these experiments, half-cell to half-cell oscillations occurred in cells with a septum in the range of 500–200 nm (Figure 3E), whereas cells with a septum of size ∼200 nm or smaller underwent a transition to split oscillations (Figure 3F), although the exact analysis of the septum size below 200 nm was not possible because of the resolution limit of conventional fluorescence microscopy.
All Min proteins behave similarly during septation
As MinC colocalizes with MinD, we expected it to undergo similar changes in its oscillatory pattern followed by the same protein equilibration. Our results confirmed this expectation (Figure 4A and B), although the initial difference between MinC levels in the daughter cells was less than for MinD, possibly because of the fact that the former is essentially a cytoplasmic protein when not bound to MinD.
Figure 4.
Behavior of MinC and MinE during cell division. (A) Half-cell to half-cell oscillations in a representative cell of strain JW1165 (ΔminC) expressing EYFP–MinC. (B) Equilibration of EYFP–MinC in strain JW1165 during cytokinesis. (C) Transition from half-cell-to-half-cell to split oscillations in a representative cell of strain PB114 (ΔminB) coexpressing untagged MinD and MinE–EYFP. Asterisks, E-ring. (D) Equilibration of MinE–EYFP during cytokinesis in strain PB114 (black diamonds) or MG1655 (red squares) coexpressing MinD and MinE–EYFP. Induction levels were 10 μM IPTG in all experiments. Values represent averages of 9 (B), 4 (D, black diamonds) and 6 (D, red squares) dividing cells, aligned by the time of splitting. Images were acquired every 7 s. The scale bars represent 3 μm. Error bars represent s.e.m. Source data is available for this figure at www.nature.com/msb.

We next examined the behavior of MinE during septation and observed the same transitions in its oscillatory regime. During half-cell to half-cell oscillations, the E-ring was at times clearly visible in one of the daughter cells (Figure 4C, white asterisks, and Supplementary Movies S4 and S5). After splitting of the oscillations, the E-ring was visible in each daughter cell (Figure 4C, cyan asterisks) and MinE proteins levels equilibrated between daughter cells in a similar way as for MinD (Figure 4D).
Modeling Min oscillations in a constricted cell
Using computational modeling we tested whether the known properties of the Min system are sufficient to reproduce the observed dynamics of oscillation and equilibration during cell division, or whether additional mechanisms are needed to explain the observed equal protein partitioning. As the number of Min proteins in a cell is on the order of few thousands (Shih et al, 2002), and local fluctuations in protein levels are, therefore, likely to have an important role, we opted for a stochastic description of the Min system. Moreover, we wanted to use a spatially resolved 3D model because our experimental results indicated that the geometry of the cell is key to the partitioning. An appropriate stochastic 3D model of the Min system—which is a slightly modified version of the model proposed by Huang and colleagues (Huang et al, 2003)—has been recently proposed by Fange and Elf (2006) and we, therefore, adapted this model to simulate a cell undergoing cytokinesis. We kept the parameters of the original model (Supplementary Figure S5A), as they could reproduce well the behavior of the Min proteins in non-dividing wild-type and mutant cells, but we modified the model geometry to represent a dividing cell and to include the septum (Figure 5A; see Materials and methods for details).
Figure 5.
Simulations of a 3D stochastic model of the Min system at different degrees of septum constriction. (A) Schematic planar view of the 3D geometry used to simulate the stochastic model of the Min system using the software MesoRD. D, cell width (1 μm); d, septum width. Cell length, 6 μm. (B) Results of the simulation runs with the indicated fixed septum size. Black dots, MinD molecules on the membrane; yellow dots, MinDE complex on the membrane. Green boxes, pole to pole oscillatory regime; black boxes, half-cell to half-cell oscillatory regime; cyan boxes, split oscillations. For a septum width of 400 nm two oscillatory regimes alternate with each other, showing birhythmicity. Time at 0 s does not indicate the beginning of the simulation, but rather the time point to which the subsequent snapshots are referred. For each septum size, five independent simulations of 2000 s were run. Source data is available for this figure at www.nature.com/msb.

To investigate the effects of the presence of a septum and of its size, we first ran independent simulations with cells of fixed septum size ranging from 880 to 60 nm (Figure 5B). With the largest septum size (corresponding to a weakly constricted cell), there was only one stable solution corresponding to pole to pole oscillations (Figure 5B, green boxes), consistent with our experimental observations and with previously published simulations for unconstricted cells. We also observed, in this case, that MinD localization extended to mid-cell, as seen experimentally (Figure 3A). With a septum of intermediate size, the half-cell to half-cell oscillations became the stable solution (Figure 5B, black boxes). Interestingly, decreasing the septum further drove the system into birhythmicity—defined as the capability of an oscillatory system to operate in either one of two simultaneously stable periodic regimes (Decroly and Goldbeter, 1982)—with half-cell to half-cell and independent oscillations in each daughter cell alternating with each other (Figure 5B, black and cyan boxes respectively). Finally, with the smallest septum size (corresponding to a heavily constricted cell), there was again only one solution corresponding to independent oscillations in each daughter cell (Figure 5B, cyan boxes; Supplementary Movie S6).
The results of simulations and experiments were, thus, in excellent qualitative agreement. Moreover, the model made the non-trivial prediction of birhythmicity in cells with a septum of intermediate size. Such birhythmicity was unlikely to be observed in normal dividing cells, as the septum does not remain at this size for long enough. To verify this prediction experimentally, we generated cells with a range of ‘frozen’ septum sizes using a cell-division inhibitor (cephalexin) to block further septal closure in the dividing cell population. In such populations, we indeed observed several cells in which half-cell to half-cell oscillations alternated with split oscillations (Supplementary Figure S4 and Supplementary Movie S7), whereby the differences between the oscillatory patterns in individual cells were likely due to the stochasticity of the process as well as to the differences in septum sizes.
Simulated behavior of Min proteins during cytokinesis
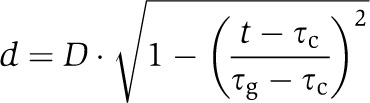
To simulate cytokinesis in a more realistic way, we introduced a stepwise septal closure into the model. In this study, we took advantage of the ability of the simulation software MesoRD to set as initial conditions the state of the system at any time point in a previous simulation (Hattne et al, 2005). The dynamics of septal closure in E. coli, i.e., the time spent by the septum at a certain size (Figure 6A), was described using a previously reported equation (Reshes et al, 2008), although a simple linear dependence of the septum size on time produces similar results (data not shown). As septal closure is much faster than the entire cell cycle, longitudinal cell growth could be neglected in our simulations. As the initial change of the oscillatory regime—the transition to half-cell to half-cell oscillations—occurs at the septum size of 600 nm (Figure 5B, black boxes), we simulated the system at this septum size long enough to achieve a stable solution, and used the resulting inhomogenous protein distribution as the initial condition for the subsequent simulation of septal closure. A typical cytokinesis simulation thus starts with a 600 nm septum and initial conditions that reflect the established half-cell to half-cell oscillatory regime. Different time points of the pre-simulation could be taken to represent initial protein distribution with essentially identical results, confirming robustness of our model (Supplementary Figure S5B). After running the simulation for the specified time, the septum size is set to 400 nm and the final distribution of molecules in the simulation at 600 nm is used as initial conditions for the new simulation (Figure 6A). This process is repeated in the sequence of indicated steps until the septum is closed. All other parameters are kept constant throughout the entire simulation.
Figure 6.
 |
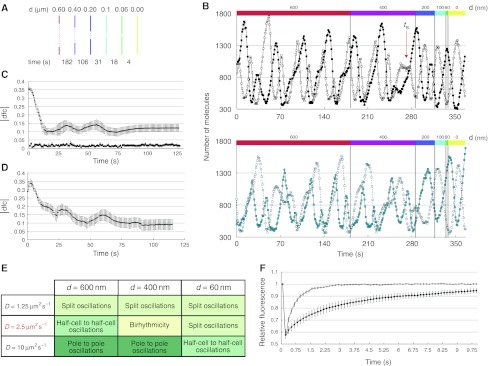
Our cytokinesis simulations were consistent with the experimental data (Figure 3) and with the simulations at fixed septum sizes (Figure 5B), invariantly showing splitting of the oscillations between daughter cells before the completion of division (Figure 6B). Splitting typically occurred at the 400–200 nm septum size, only slightly larger than the size range at which splitting was observed experimentally (Figure 3F). Owing to the stochastic nature of the simulation process, the timing and the details of splitting depended on the simulation, again resembling the experimental observations (Supplementary Figure S6). Furthermore, when the differences in the simulated levels of MinD and MinE proteins in both daughter cells were evaluated over time applying the same procedure used for the experimental data, we observed an equilibration resembling that seen in real cells (Figure 6C and D).
Taken together, our simulations could reproduce all relevant aspects of the partitioning process. Despite some minor quantitative differences, the overall agreement between modeling and experimental results was excellent, especially considering that we purposely did not adjust any of the modeling parameters to fit the experimental data. In that sense, simulations and experiments were performed independently of each other, and experimental results can be equally seen as a confirmation of modeling predictions.
Changes in the oscillatory pattern during cytokinesis depend on diffusion through the constricting septum
Finally, we used our model to better understand the determinants of the observed changes in the Min oscillatory regime. We reasoned that slower protein exchange between the two cell halves due to the constricting septum might be key to the process, in which case varying the diffusion coefficient while keeping all other model parameters constant should affect the oscillatory pattern. Consistent with our expectations, faster or slower diffusion shifted the dependence of the oscillatory pattern on the septum size in opposite directions (Figure 6E). For a four times higher diffusion coefficient, half-cell to half-cell oscillations still persisted even at the septum size of 60 nm. On the other hand, for a halved diffusion coefficient, split oscillations arose already at the septum size of 600 nm, although these oscillations are not as regular as those obtained with the default diffusion coefficient (Supplementary Figure S5C).
These simulation results confirmed that impeded protein exchange through the constricting septum is indeed the primary cause of the observed changes in the oscillatory regime. To directly verify such impediment, we performed fluorescence recovery after photobleaching (FRAP) experiments on constricted and unconstricted cells using an EYFP fusion to the freely diffusing cytoplasmic chaperone HtpG (see Materials and methods). Indeed, fluorescence recovery in the bleached half of the cell was substantially slower for cells with a visible constriction (Figure 6F and Supplementary Movies S8 and S9), confirming that a constricted septum effectively slows down the exchange of molecules between daughter cells.
Discussion
The oscillatory Min system in E. coli and other bacteria is essential for the correct positioning of the cell division machinery and, therefore, for the normal propagation of a bacterial population, and inequalities in the distribution of the Min proteins into the progeny could have a negative evolutionary impact. Nevertheless, no clear partitioning mechanism was yet proposed for the Min system and previous computational analyses predicted a very unequal inheritance. In this study, we have investigated the precision of Min partitioning between daughter cells during division and demonstrated that cells use an efficient partitioning mechanism, relying on the self-organizing properties of the Min system. The partitioning arises from the changes in the Min oscillatory pattern, as cells progress through the last stages of the cell cycle and change their geometry (Figure 7). Our combined experimental and theoretical analyses suggest that the last steps in septal closure have the greatest impact on Min oscillations, eventually leading to their splitting in the daughter cells just before completion of cytokinesis (Figure 7). This event and its timing are key to the equal partitioning. First, the splitting of oscillations itself already ensures that Min proteins are distributed to both daughter cells, often with only a moderate skew. Second, the timing of splitting—just before septal closure—allows further quick reduction of initial inequalities by diffusion, to achieve an almost perfect distribution of the Min system between the two daughter cells before their separation (Figure 7). This occurs because the Min proteins will diffuse from the daughter cell that has inherited higher concentration of these proteins to the daughter cell that has the lower concentration, as soon as the oscillation is no longer running though the entire mother cell but has split and as long as the septum is not completely closed. Thus, the split in the oscillations and the diffusion through the open septum are both required for the equilibration to take place.
Figure 7.

Model of Min proteins partitioning during cell division. For simplicity, only MinD molecules on the membrane are shown. Cell division progress is shown from top to bottom. Oscillatory regime corresponding to the cellular geometry is indicated at the top of each cellular stage. We propose that oscillations split before completion of cytokinesis, which allows initial separation and subsequent fast equilibration of proteins levels between daughter cells. As depicted in the figure, slow protein exchange through the gradually constricting septum is key to this partitioning mechanism.
The primary factor behind the splitting of the oscillations ahead of cytokinesis completion is protein exchange through the septum, which becomes critically slow for a heavily pinched cell (Figure 6F). As a result, protein movement from daughter cell to daughter cell is no longer sufficient to prevent Min complex assembly at the newly formed septal membrane, and the oscillations naturally continue on each side of the septum (Figure 7).
Our study is in a general agreement with the very recent work of Juarez and Margolin (2010), which also reported changes in the oscillatory regime of MinD around the time of cell division and proposed a possible relation of these changes to protein partitioning. However, both our experiments and computer simulations suggest that the periodic oscillations of Min proteins persist throughout the cell cycle, rather than being interrupted by irregular pausing, as reported by Juarez and Margolin, although the type of oscillation indeed changes depending on the septum size. More importantly, our computational analysis—performed without any parameter fitting—strongly argues that the interplay between the known properties of the Min system and the changes of cell geometry during division is fully sufficient to explain the observed equal partitioning, without the need for any additional regulatory mechanisms, such as changes in MinD affinity for the septum proposed by Juarez and Margolin.
Taken together, our results provide a comprehensive view of Min partitioning at cell division and suggest that E. coli cells have evolved a very simple and elegant way to ensure equal concentrations of these key proteins in the progeny, with the underlying mechanisms being based entirely on the interplay between the intrinsic self-organizing properties of the Min system and the cell geometry. It seems likely that molecular parameters that determine dynamics of the Min oscillation have been evolutionary tuned to one another and to the dynamics of the cell division machinery, to reach the level of coordination that is required for the equal partitioning to take place. Indeed, our simulations suggest that even a moderate misbalance between the diffusion coefficient and other parameters of the Min system would cause the timing of transitions in the Min oscillatory regime to occur during the wrong stages of septal closure (Figure 6E). Moreover, oscillations are lost altogether when changing some reaction rates, such as the affinity of MinD for the membrane or the dissociation rate from the membrane (data not shown). Superficially, such parameter sensitivity may argue for the poor robustness of the system. However, diffusion coefficients and affinities are defined protein properties that are not easily subjected to perturbations, which we believe has allowed an evolutionary fine-tuning of the system.
As most gram-negative bacteria possess a Min system homolog and divide symmetrically, the mechanism described here might operate in other bacteria as well. Another example of dynamic protein localization is given by the cell motility control system in Myxococcus xantus, which consists of several proteins, FrzS, AglZ and RomR, that regularly relocalize between cell poles in a highly coordinated fashion (Mignot et al, 2005; Leonardy et al, 2007). In any such case, a mechanism must be in place to ensure proper partitioning of localized proteins at cell division. Moreover, the problem of partitioning is not limited to dynamically localized proteins, but arises for any structure—in bacteria or in eukaryotes—that has a specific cellular address and must be duplicated at cell division. Given its simplicity and low evolutionary cost, self-organized partitioning may be a widely used strategy, and self-organization has indeed been shown to be the driving force of spindle assembly in eukaryotes (Heald et al, 1996) and of the distribution of chemoreceptor clusters in bacteria (Thiem and Sourjik, 2008; Wang et al, 2008).
Well recognized to be important in many aspects of multicellular biology—from embryogenesis to formation of animal social structures—self-organization is thus likely to have a similarly important role in the regulation of even the simplest intracellular processes.
Materials and methods
Strains, plasmids and growth conditions
The strains and plasmids used in this study are listed in Table I. MG1655 [ΔminB] (MG1655, minB∷kanR) was obtained by P1-mediated transduction of minB∷kanR from PB114 to MG1655. JS964 was a gift from Karsten Kruse. PB114 was a gift from Piet de Boer. EYFP–MinD plasmid construction was previously reported (Thiem et al, 2007). We used the same method to clone EYFP–MinC and ECFP–MinD. Briefly, the gene of interest was amplified by PCR and then cloned using BamHI and NotI as N-terminal EYFP or ECFP fusion into a pDK4 or pDK2 vector respectively (Kentner et al, 2006). To coexpress MinD and MinE–EYFP, we made a bicistronic construct by amplifying the entire minDE portion of the minB operon by PCR, and then cloning the product using NcoI/BamHI as C-terminal fusion to EYFP into a pDK3 vector (yielding vector pBDV-1). To coexpress ECFP–MinD and MinE–EYFP, we made a bicistronic construct ligating ECFP–MinD into pBDV-1 using NcoI/PacI restriction sites (yielding vector pBDV-2). EYFP under the salicylate promoter was cloned into vector pRR31 using NdeI/KpnI restriction sites.
Table 1. Bacterial strains and plasmids used in this study.
| Strain/plasmid | Relevant genotype | Reference |
|---|---|---|
| MG1655 | Wild-type; K-12 derivative | (Blattner et al, 1997) |
| MG1655 [ΔminB] | ΔminB∷kanR; MG1655 derivative | This study |
| PB114 | ΔminB∷ kanR; PB103 (dadR trpE trpA tna) derivative | (de Boer et al, 1989) |
| JS964 | Δmin∷kanR; MC1061 (malP∷lacIq) derivative | (Pichoff et al, 1995) |
| JW1165 | ΔminC∷ kanR; K-12 BW25113 derivative | (Baba et al, 2006) |
| pDK2 | N-terminal ECFP fusions expression plasmid; pTrc99a derivative | (Kentner et al, 2006) |
| pDK3 | C-terminal EYFP fusions expression plasmid; pTrc99a derivative | (Kentner et al, 2006) |
| pDK4 | N-terminal EYFP fusions expression plasmid; pTrc99a derivative | (Kentner et al, 2006) |
| pRR31 | nahR/pnahG cloning vector; pACYC184 derivative | (Ames et al, 2002) |
| pES-2 | EYFP–MinC expression plasmid; pDK4 derivative | This study |
| pES-10 | ECFP–MinD expression plasmid; pDK2 derivative | This study |
| pSR-4 | EYFP–MinD expression plasmid; pDK4 derivative | (Thiem et al, 2007) |
| pVS118 | EYFP expression plasmid; pRR31 derivative | This study |
| pKG100 | Expression vector; pLC112 derivative | JS Parkinson |
| pBDV-1 | MinDE–EYFP expression plasmid; pDK3 derivative | This study |
| pBDV-2 | ECFP-MinDE-EYFP expression plasmid; pDK3 derivative | This study |
| pBDV-3 | MinB–ECFP expression plasmid; pKG100 | This study |
| pAM238 | GFP–MinDE expression plasmid; | (Fischer-Friedrich et al, 2010) |
| pJC66 | FtsZ–CFP expression plasmid; pTrc99a derivative | (Chen and Beckwith, 2001) |
| pVS627 | HtpG–EYFP expression plasmid; pTrc99a derivative | (Kumar et al, 2010) |
To overexpress all Min proteins, the minB operon was amplified by PCR (using primers 5′: TCGCATGCGGCCGCGTAAGGCCAGGATGTCAAACACGC; 3′: AGTTATGGATCCCCTTAACTCGAGCGGGCTTATTTCAGCTCTTCTGC) and cloned into pKG100 using NotI/BamHI restriction sites. An internal XhoI restriction site upstream of the BamHI site was inserted in the 3′ primer to subsequently clone ECFP downstream of the minB operon using XhoI/BamHI restriction sites, to control for the expression of the untagged Min proteins. Plasmid pJC66 carrying FtsZ–CFP was a gift from Jon Beckwith. Plasmid pVS627 expressing HtpG–EYFP was described in (Kumar et al, 2010).
Cells were inoculated from a glycerol stock in LB medium containing the appropriate antibiotics (ampicillin: final concentration 100 μg ml−1; chloramphenicol: final concentration 35 μg ml−1) and grown over night at 37°C. Overnight cultures were diluted 1:100 in fresh LB medium and were grown until OD600∼0.2/0.4 in the presence of antibiotics and isopropyl β-D-thiogalactoside (IPTG) or salicylate.
Synchronization of E. coli cultures
Synchronization of E. coli cultures was essentially performed as previously described (Ferullo et al, 2009). After resuspension in fresh pre-warmed LB medium, the cultures were grown for additional 20–30 min before being processed for microscopy. This growing time maximized the number of cells on the microscopy slide that were advanced in the septation process.
Fluorescence microscopy
Cells were harvested by centrifugation (8000 r.p.m., 1 min), washed and resuspended in a tethering buffer (10 mM potassium phosphate, 0.1 mM EDTA, 1 μM L-methionine and 10 mM sodium lactate; pH 7) and applied to a thin agarose pad (0.5% agarose and 0.1% LB in tethering buffer) for microscopy. Fluorescence microscopy was performed at room temperature on a Zeiss AXIO Observer.Z1 microscope equipped with an ORCA CCD camera (Hamamatsu) and filter sets for CFP (Excitation BP 436/20; Dichroic LP 455; Emission BP 480/40), YFP (Excitation BP 510/20; Dichroic LP 530; Emission BP 560/40) and GFP (Excitation BP 475/40; Dichroic LP 500; Emission BP 530/50). For the fast time-lapse experiments, images were made at room temperature using a DeltaVision RT (Applied Precision) microscope equipped with YFP and GFP filters (Chroma Technology Corp.), a plan Apo × 100 NA 1.4 oil immersion objective (IX70; Olympus), softWoRx software (Applied Precision) and a camera (CoolSNAP HQ; Photometrics).
Image analysis
Images were evaluated using ImageJ software (W Rasband, http://rsb.info.nih.gov/ij/). The cell contour was manually marked with the polygon selections tool and used to calculate the cell area. Integral density and mean intensity of the fluorescence in single cells were then quantified within this area. To quantify polar fluorescence, the region of interest was drawn only at the poles (see main text and Figure 3). The background intensity was calculated by drawing a rectangular region in the background and subtracted to the values obtained for each cell. Statistics and plotting of the data were performed using either KaleidaGraph 3.6 (Synergy Software) or Microsoft Excel.
FRAP analysis
Measurements were performed at room temperature on a DeltaVision RT system (Applied Precision; see above) using the QLM 50 mW 488 nm laser for photobleaching. One image before the photobleaching was acquired, followed by one photobleaching event (laser power: 50%, duration: 0.05 s) and subsequent time-lapse microscopy at 0.15 s time resolution. The background intensity was calculated by drawing a rectangular region in an empty area and subtracted from the values obtained for each cell. Fluorescence recovery curves were obtained by calculating the ratio between the mean fluorescence intensities of the two cell halves.
Determination of Min proteins distribution between daughter cells after division
Cells at the early stage of division, as assessed by the constriction degree or alternatively by the presence of pole to pole oscillations, were followed until division was completed, as assessed by the presence of split oscillations for at least 5 min. To avoid bleaching, the degree of constriction was primarily estimated using bright field imaging, and a series of fluorescence images (every 7 s for several minutes) was only acquired once to verify the mode of the Min oscillation before acquiring the final image used for quantification. The images were then quantified using ImageJ software to obtain following quantities: background fluorescence concentration (conc BG), area of the left daughter cell (area L), area of the right daughter cell (area R), fluorescence concentration of the left daughter cell (conc L), fluorescence concentration of the right daughter cell (conc R), integral density of the left daughter cell (Int L) and integral density of the right daughter cell (Int R). Using these quantities we then calculated: Total integral density (TotInt=Int L+Int R), Total Area (TotA=area L+area R), Total background integral density (Int BG=conc BG × TotA). By subtracting the background we obtained: TotInt–BG=TotInt−Int BG. This quantity was then used to calculate the total fluorescence concentration minus the background: TotConc–BG=TotInt–BG/TotA. Background was then subtracted from the fluorescence concentrations in the daughter cells: conc L–BG=conc L−conc BG and conc R–BG=conc R−conc BG; same procedure was applied to the integral densities: Int L–BG=Int L−Int BG and Int R–BG=Int R−Int BG. The relative fluorescence concentration was then calculated for the left and right daughter cells: conc L–BG/TotConc–BG, conc R–BG/TotConc–BG. The same was done to obtain the relative integral density: Int L–BG/TotInt–BG, Int R–BG/TotInt–BG.
In the histograms, the value ‘0.5’ corresponds to perfect equi-distribution of protein numbers, while the value ‘1’ corresponds to perfect equi-distribution of concentrations. Let us assume that a cell has volume V and protein number N. The protein concentration is: c=N/V. When the cell has divided, we have these quantities for both daughter cells: c1=N1/V1 and c2=N2/V2. If we assume perfect partitioning, then N1=N2=N/2 and V1=V2=V/2, therefore, we obtain for the concentrations: c1=c2=c, so when calculating relative concentrations we get: c1/c=1.
Modeling and simulation
A detailed explanation of the mathematical framework and the software package MesoRD used to model and simulate stochastic reaction-diffusion kinetics can be found in Fange and Elf (2006). Simulations results were analyzed using Matlab_R2009b (Mathworks Inc., USA).
Introduction of a septum into the model geometry
The geometry used by Fange and Elf consisted of a cylinder of length 3.5 μm with half-sphere caps of diameter 1 μm. To model a constricted cell, we have intersected two cylinders of length 2 μm with half-sphere caps of diameter 1 μm (see Figure 5A). The septum at mid-cell was modeled by two adjacent cylinders (one on either side of the origin of the axes) of length 0.03 μm and diameter 0.94 μm. This way, we can model an impermeable membrane (of final length 0.06 μm), wherein molecules can bind from the cytoplasm without getting through it. To open the septum, a cylinder of length 0.03 μm and defined radius (depending on the extent of constriction we aimed at) was subtracted from each cylinder of length 0.03 μm and diameter 0.94 μm. The 3D geometries were always discretized into cubic subvolumes with side length 0.03 μm.
Supplementary Material
Movie of eYFP-MinD partitioning during cell division
Movie of GFP-MinD partitioning during cell division
Movie of GFP-MinD partitioning during cell division
Movie of MinE-EYFP partitioning during cell division
Movie of MinE-EYFP partitioning during cell division
3D view of simulation results showing split oscillations
Example of birhythmicity
Movie of the FRAP experiment on an un-constricted cell
Movie of the FRAP experiment on a constricted cell
Supplementary Information, Supplementary Figures S1–6, Legends for the Supplementary Movies
Acknowledgments
We thank Erik Sommer for constructing the plasmids for the expression of fluorescently labeled MinC and MinD; Robert Grosse, Mohit Kumar, Mark Isalan and Luis Serrano for critical reading of the paper; David Kentner and Gabriele Malengo for helpful discussions; David Fange for support with MesoRD; Nick Kepper for support with the BIOQUANT cluster that was used to run simulations. This work was financed by the Center for Modeling and Simulation in the Biosciences (BIOMS).
Author contributions: BDV and VS designed the experiments; BDV performed the experiments, constructed materials and performed data analysis; performed model simulations and designed and performed model analysis; BDV and VS wrote the paper.
Footnotes
The authors declare that they have no conflict of interest.
References
- Ames P, Studdert CA, Reiser RH, Parkinson JS (2002) Collaborative signaling by mixed chemoreceptor teams in Escherichia coli. Proc Natl Acad Sci USA 99: 7060–7065 [DOI] [PMC free article] [PubMed] [Google Scholar]
- Baba T, Ara T, Hasegawa M, Takai Y, Okumura Y, Baba M, Datsenko KA, Tomita M, Wanner BL, Mori H (2006) Construction of Escherichia coli K-12 in-frame, single-gene knockout mutants: the Keio collection. Mol Syst Biol 2: 2006.0008; DOI: 10.1038/msb4100050 [DOI] [PMC free article] [PubMed] [Google Scholar]
- Blattner FR, Plunkett G III, Bloch CA, Perna NT, Burland V, Riley M, Collado-Vides J, Glasner JD, Rode CK, Mayhew GF, Gregor J, Davis NW, Kirkpatrick HA, Goeden MA, Rose DJ, Mau B, Shao Y (1997) The complete genome sequence of Escherichia coli K-12. Science 277: 1453–1462 [DOI] [PubMed] [Google Scholar]
- Burkard ME, Maciejowski J, Rodriguez-Bravo V, Repka M, Lowery DM, Clauser KR, Zhang C, Shokat KM, Carr SA, Yaffe MB, Jallepalli PV (2009) Plk1 self-organization and priming phosphorylation of HsCYK-4 at the spindle midzone regulate the onset of division in human cells. PLoS biology 7: e1000111. [DOI] [PMC free article] [PubMed] [Google Scholar]
- Chen JC, Beckwith J (2001) FtsQ, FtsL and FtsI require FtsK, but not FtsN, for co-localization with FtsZ during Escherichia coli cell division. Mol Microbiol 42: 395–413 [DOI] [PubMed] [Google Scholar]
- de Boer PA, Crossley RE, Rothfield LI (1989) A division inhibitor and a topological specificity factor coded for by the minicell locus determine proper placement of the division septum in E. coli. Cell 56: 641–649 [DOI] [PubMed] [Google Scholar]
- de Boer PA, Crossley RE, Rothfield LI (1992) Roles of MinC and MinD in the site-specific septation block mediated by the MinCDE system of Escherichia coli. J Bacteriol 174: 63–70 [DOI] [PMC free article] [PubMed] [Google Scholar]
- Decroly O, Goldbeter A (1982) Birhythmicity, chaos, and other patterns of temporal self-organization in a multiply regulated biochemical system. Proc Natl Acad Sci USA 79: 6917–6921 [DOI] [PMC free article] [PubMed] [Google Scholar]
- Di Ventura B, Lemerle C, Michalodimitrakis K, Serrano L (2006) From in vivo to in silico biology and back. Nature 443: 527–533 [DOI] [PubMed] [Google Scholar]
- Drew DA, Osborn MJ, Rothfield LI (2005) A polymerization-depolymerization model that accurately generates the self-sustained oscillatory system involved in bacterial division site placement. Proc Natl Acad Sci USA 102: 6114–6118 [DOI] [PMC free article] [PubMed] [Google Scholar]
- Fange D, Elf J (2006) Noise-induced Min phenotypes in E. coli. PLoS Comput Biol 2: e80. [DOI] [PMC free article] [PubMed] [Google Scholar]
- Ferullo DJ, Cooper DL, Moore HR, Lovett ST (2009) Cell cycle synchronization of Escherichia coli using the stringent response, with fluorescence labeling assays for DNA content and replication. Methods 48: 8–13 [DOI] [PMC free article] [PubMed] [Google Scholar]
- Fischer-Friedrich E, Meacci G, Lutkenhaus J, Chate H, Kruse K (2010) Intra- and intercellular fluctuations in Min-protein dynamics decrease with cell length. Proc Natl Acad Sci USA 107: 6134–6139 [DOI] [PMC free article] [PubMed] [Google Scholar]
- Friedman SA, Austin SJ (1988) The P1 plasmid-partition system synthesizes two essential proteins from an autoregulated operon. Plasmid 19: 103–112 [DOI] [PubMed] [Google Scholar]
- Hale CA, Meinhardt H, de Boer PA (2001) Dynamic localization cycle of the cell division regulator MinE in Escherichia coli. EMBO J 20: 1563–1572 [DOI] [PMC free article] [PubMed] [Google Scholar]
- Hattne J, Fange D, Elf J (2005) Stochastic reaction-diffusion simulation with MesoRD. Bioinformatics 21: 2923–2924 [DOI] [PubMed] [Google Scholar]
- Heald R, Tournebize R, Blank T, Sandaltzopoulos R, Becker P, Hyman A, Karsenti E (1996) Self-organization of microtubules into bipolar spindles around artificial chromosomes in Xenopus egg extracts. Nature 382: 420–425 [DOI] [PubMed] [Google Scholar]
- Howard M, Kruse K (2005) Cellular organization by self-organization: mechanisms and models for Min protein dynamics. J Cell Biol 168: 533–536 [DOI] [PMC free article] [PubMed] [Google Scholar]
- Howard M, Rutenberg AD, de Vet S (2001) Dynamic compartmentalization of bacteria: accurate division in E. coli. Phys Rev Lett 87: 278102. [DOI] [PubMed] [Google Scholar]
- Hu Z, Lutkenhaus J (1999) Topological regulation of cell division in Escherichia coli involves rapid pole to pole oscillation of the division inhibitor MinC under the control of MinD and MinE. Mol Microbiol 34: 82–90 [DOI] [PubMed] [Google Scholar]
- Huang KC, Meir Y, Wingreen NS (2003) Dynamic structures in Escherichia coli: spontaneous formation of MinE rings and MinD polar zones. Proc Natl Acad Sci USA 100: 12724–12728 [DOI] [PMC free article] [PubMed] [Google Scholar]
- Juarez JR, Margolin W (2010) Changes in Min oscillation pattern before and after cell birth. J Bacteriol 192: 4134–4142 [DOI] [PMC free article] [PubMed] [Google Scholar]
- Karsenti E (2008) Self-organization in cell biology: a brief history. Nat Rev 9: 255–262 [DOI] [PubMed] [Google Scholar]
- Kentner D, Thiem S, Hildenbeutel M, Sourjik V (2006) Determinants of chemoreceptor cluster formation in Escherichia coli. Mol Microbiol 61: 407–417 [DOI] [PubMed] [Google Scholar]
- Kerr RA, Levine H, Sejnowski TJ, Rappel WJ (2006) Division accuracy in a stochastic model of Min oscillations in Escherichia coli. Proc Natl Acad Sci USA 103: 347–352 [DOI] [PMC free article] [PubMed] [Google Scholar]
- Kruse K (2002) A dynamic model for determining the middle of Escherichia coli. Biophys J 82: 618–627 [DOI] [PMC free article] [PubMed] [Google Scholar]
- Kruse K, Howard M, Margolin W (2007) An experimentalist′s guide to computational modelling of the Min system. Mol Microbiol 63: 1279–1284 [DOI] [PMC free article] [PubMed] [Google Scholar]
- Kulkarni RV, Huang KC, Kloster M, Wingreen NS (2004) Pattern formation within Escherichia coli: diffusion, membrane attachment, and self-interaction of MinD molecules. Phys Rev Lett 93: 228103. [DOI] [PubMed] [Google Scholar]
- Kumar M, Mommer MS, Sourjik V (2010) Mobility of cytoplasmic, membrane, and DNA-binding proteins in Escherichia coli. Biophys J 98: 552–559 [DOI] [PMC free article] [PubMed] [Google Scholar]
- Leonardy S, Freymark G, Hebener S, Ellehauge E, Sogaard-Andersen L (2007) Coupling of protein localization and cell movements by a dynamically localized response regulator in Myxococcus xanthus. EMBO J 26: 4433–4444 [DOI] [PMC free article] [PubMed] [Google Scholar]
- Loose M, Fischer-Friedrich E, Ries J, Kruse K, Schwille P (2008) Spatial regulators for bacterial cell division self-organize into surface waves in vitro. Science 320: 789–792 [DOI] [PubMed] [Google Scholar]
- Marshall WF (2010) Cilia self-organize in response to planar cell polarity and flow. Nat Cell Biol 12: 314–315 [DOI] [PubMed] [Google Scholar]
- Meinhardt H, de Boer PA (2001) Pattern formation in Escherichia coli: a model for the pole-to-pole oscillations of Min proteins and the localization of the division site. Proc Natl Acad Sci USA 98: 14202–14207 [DOI] [PMC free article] [PubMed] [Google Scholar]
- Mignot T, Merlie JP Jr, Zusman DR (2005) Regulated pole-to-pole oscillations of a bacterial gliding motility protein. Science (New York, NY) 310: 855–857 [DOI] [PubMed] [Google Scholar]
- Pavin N, Paljetak HC, Krstic V (2006) Min-protein oscillations in Escherichia coli with spontaneous formation of two-stranded filaments in a three-dimensional stochastic reaction-diffusion model. Phys Rev E Stat Nonlin Soft Matter Phys 73: 021904. [DOI] [PubMed] [Google Scholar]
- Pichoff S, Vollrath B, Touriol C, Bouche JP (1995) Deletion analysis of gene minE which encodes the topological specificity factor of cell division in Escherichia coli. Mol Microbiol 18: 321–329 [DOI] [PubMed] [Google Scholar]
- Raskin DM, de Boer PA (1999a) MinDE-dependent pole-to-pole oscillation of division inhibitor MinC in Escherichia coli. J Bacteriol 181: 6419–6424 [DOI] [PMC free article] [PubMed] [Google Scholar]
- Raskin DM, de Boer PA (1999b) Rapid pole-to-pole oscillation of a protein required for directing division to the middle of Escherichia coli. Proc Natl Acad Sci USA 96: 4971–4976 [DOI] [PMC free article] [PubMed] [Google Scholar]
- Reshes G, Vanounou S, Fishov I, Feingold M (2008) Timing the start of division in E. coli: a single-cell study. Phys Biol 5: 46001. [DOI] [PubMed] [Google Scholar]
- Rodrigues-Martins A, Riparbelli M, Callaini G, Glover DM, Bettencourt-Dias M (2007) Revisiting the role of the mother centriole in centriole biogenesis. Science (New York, NY) 316: 1046–1050 [DOI] [PubMed] [Google Scholar]
- Sawin KE, LeGuellec K, Philippe M, Mitchison TJ (1992) Mitotic spindle organization by a plus-end-directed microtubule motor. Nature 359: 540–543 [DOI] [PubMed] [Google Scholar]
- Sengupta S, Rutenberg A (2007) Modeling partitioning of Min proteins between daughter cells after septation in Escherichia coli. Phys Biol 4: 145–153 [DOI] [PubMed] [Google Scholar]
- Shih YL, Fu X, King GF, Le T, Rothfield L (2002) Division site placement in E.coli: mutations that prevent formation of the MinE ring lead to loss of the normal midcell arrest of growth of polar MinD membrane domains. EMBO J 21: 3347–3357 [DOI] [PMC free article] [PubMed] [Google Scholar]
- Thiem S, Kentner D, Sourjik V (2007) Positioning of chemosensory clusters in E. coli and its relation to cell division. EMBO J 26: 1615–1623 [DOI] [PMC free article] [PubMed] [Google Scholar]
- Thiem S, Sourjik V (2008) Stochastic assembly of chemoreceptor clusters in Escherichia coli. Mol Microbiol 68: 1228–1236 [DOI] [PubMed] [Google Scholar]
- Tostevin F, Howard M (2006) A stochastic model of Min oscillations in Escherichia coli and Min protein segregation during cell division. Phys Biol 3: 1–12 [DOI] [PubMed] [Google Scholar]
- Wang H, Wingreen NS, Mukhopadhyay R (2008) Self-organized periodicity of protein clusters in growing bacteria. Phys Rev Lett 101: 218101. [DOI] [PubMed] [Google Scholar]
Associated Data
This section collects any data citations, data availability statements, or supplementary materials included in this article.
Supplementary Materials
Movie of eYFP-MinD partitioning during cell division
Movie of GFP-MinD partitioning during cell division
Movie of GFP-MinD partitioning during cell division
Movie of MinE-EYFP partitioning during cell division
Movie of MinE-EYFP partitioning during cell division
3D view of simulation results showing split oscillations
Example of birhythmicity
Movie of the FRAP experiment on an un-constricted cell
Movie of the FRAP experiment on a constricted cell
Supplementary Information, Supplementary Figures S1–6, Legends for the Supplementary Movies