

Abstract
Fermentation of plant biomass by microbes like Clostridium phytofermentans recycles carbon globally and can make biofuels from inedible feedstocks. We analyzed C. phytofermentans fermenting cellulosic substrates by integrating quantitative mass spectrometry of more than 2500 proteins with measurements of growth, enzyme activities, fermentation products, and electron microscopy. Absolute protein concentrations were estimated using Absolute Protein EXpression (APEX); relative changes between treatments were quantified with chemical stable isotope labeling by reductive dimethylation (ReDi). We identified the different combinations of carbohydratases used to degrade cellulose and hemicellulose, many of which were secreted based on quantification of supernatant proteins, as well as the repertoires of glycolytic enzymes and alcohol dehydrogenases (ADHs) enabling ethanol production at near maximal yields. Growth on cellulose also resulted in diverse changes such as increased expression of tryptophan synthesis proteins and repression of proteins for fatty acid metabolism and cell motility. This study gives a systems-level understanding of how this microbe ferments biomass and provides a rational, empirical basis to identify engineering targets for industrial cellulosic fermentation.
Keywords: bioenergy, clostridium, proteomics
Introduction
Cellulosic biomass is the world's most abundant biological energy source (Leschine, 1995). Recycling this vast carbon sink by cellulolytic microbes is one of the largest material flows in the global carbon cycle (Falkowski et al, 2000). Microbes could industrially convert over 1.3 billion metric tons of cellulosic biomass to fuels and chemicals per year in North America (Perlack et al, 2005), which could sustainably provide enough ethanol for 65% of US ground transportation fuel at current levels (Somerville, 2006). However, plant biomass is composed primarily of high-molecular weight polysaccharides in a quasicrystalline structure, making the deconstruction of biomass a key challenge to developing cellulosic biofuels (Houghton et al, 2006). Consolidated bioprocessing (Lynd et al, 2002) is a promising strategy to overcome biomass recalcitrance by using microbes such as Clostridium phytofermentans that secrete enzymes to both depolymerize biomass and then ferment the resulting hexose and pentose sugars to a biofuel such as ethanol.
C. phytofermentans is a mesophile from forest soil that ferments both of the main components of plant biomass, cellulose and hemicellulose, to ethanol and hydrogen (Warnick et al, 2002). As a group 14 clostridium, this microbe is phylogenetically distant from well-studied cellulolytic clostridia. The C. phytofermentans genome encodes 161 carbohydrate-active enzymes (CAZy) including 108 glycoside hydrolases spread across 39 families (Cantarel et al, 2009), highlighting the elaborate set of enzymes needed to breakdown different biomass types. Hydrolases in most clostridia have dockerin domains to bind a scaffolding protein on the cell exterior forming a multienzyme cellulosome. C. phytofermentans lacks scaffolding and dockerin domains, suggesting that cellulolytic enzymes are either freely secreted or are anchored to the cell in a novel, cellulosome-independent manner.
Faced with the complexity of metabolizing biomass, systems-level strategies are needed to identify hydrolases and metabolic enzymes to engineer microbes for improved cellulosic bioconversion. We demonstrate such a strategy (Figure 1) in C. phytofermentans by integrating analyses of growth, fermentation, enzyme activities, and electron microscopy with quantitative mass spectrometry-based proteomics of more than 2500 proteins. Protein concentrations were estimated by machine learning-supported spectral counting (Absolute Protein EXpression, APEX) (Lu et al, 2007). Protein levels on hemicellulose and cellulose relative to glucose were determined using reductive methylation (Hsu et al, 2003; Boersema et al, 2009), here called reductive dimethylation (ReDi) labeling, to chemically incorporate hydrogen or deuterium isotopes at lysines and N-terminal amines of tryptic peptides. We show that ReDi labeling gives accurate, low-cost quantification of a microbial proteome and can be used to discern extracellular proteins. C. phytofermentans expressed more than 100 CAZy and adapted their stoichiometries to each cellulosic substrate. Cellulosic fermentation entailed additional changes such as increased tryptophan and nicotinamide synthesis, use of alternative glycolytic enzymes, and adhesion to the substrate. We describe how these data provide a blueprint showing promising genetic targets to engineer microbes for more efficient conversion of biomass to fuels and biomaterials.
Figure 1.

Integrated systems biology strategy to study cellulosic bioconversion. Cultures metabolizing different biomass substrates were examined for (A) growth and biomass consumption rates (Figure 2A–C), (B) fermentation production rates and yields (Figure 2D–F), and (C) ability of the microbe to adhere to cellulosic substrates (Figure 2G–I). (D) Supernatant and cellular protein samples were taken for reductive dimethylation (ReDi) proteomics and analyzed for enzyme secretion (Figure 4), abundances of cellulolytic enzymes (Figure 5), and proteome-wide changes (Figure 6). (E) These data were integrated to identify key enzymes for each step in biomass deconstruction and fermentation (Table I, Figure 7).
Results
Growth, fermentation, and cell adhesion
Wild-type C. phytofermentans ATCC 700394 is well suited for cellulosic biofuels as cultures were actively growing on glucose, hemicellulose, and cellulose and converting these substrates primarily to ethanol when samples were taken for proteomics (Figure 2A–F). Growth was faster on hemicellulose (Figure 2B) than on glucose (Figure 2A) or xylose (Supplementary Figure S1), which is unexpected because hemicellulose is a beta-1,4-D-xylopyranose polymer that must be cleaved to xylose and isomerized before glycolysis. Ethanol titers reached 77% of the maximum theoretical yield in the glucose cultures (30 h, Figure 2D) and 27% in the hemicellulose cultures (24 h, Figure 2E) during the sampling period (see Supplementary Figs S2-5 for growth and ethanol yield calculations). Final ethanol concentrations in glucose cultures were >95% of the maximum theoretical yield after 48 h (Supplementary Figure S6). Stable cell densities (107–108 CFU ml−1) in the cellulose cultures resulted in linear rates of cellulose degradation (Figure 2C) and ethanol formation (Figure 2F) that correspond to a direct conversion of cellulose to ethanol at 68% of the maximum theoretical yield. The cellulose cultures produced an ethanol/acetate ratio (9.54) similar to the highest yields reported for clostridia (Lynd et al, 2002).
Figure 2.
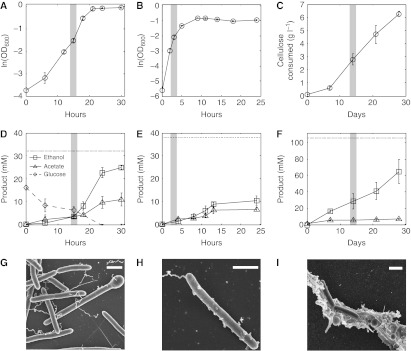
Growth (A–C), fermentation (D–F), and cell morphology (G–I) of C. phytofermentans on different carbon sources. Data points are means of triplicate cultures; error bars show one s.d. and are smaller than the symbols where not apparent. Gray bars show when samples were taken for mass spectrometry. Growth on glucose (A) and hemicellulose (B) was quantified as OD600. Growth on cellulose (C) was measured as dry mass of cellulose in culture. Production of ethanol and acetate, the two most abundant fermentation products, and glucose consumption in the glucose treatment was measured by HPLC. Dotted lines show maximum theoretical yield of ethanol. Scanning electron microscopy shows cells growing on glucose (G), hemicellulose (H), and cellulose (I). White scale bar is 1 μm.
Adhesion to plant substrates is an important adaptation in some cellulolytic bacteria to enhance cellulolysis (Lu et al, 2006) by increasing enzyme concentrations near the substrate and excluding competitors from the liberated sugars. C. phytofermentans was adhered to both cellulosic substrates when samples were taken for proteomics, even though it lacks cellulosomes that enable adhesion in other clostridia. Cells growing on hemicellulose (Figure 2H, Supplementary Figure S7) were sometimes laden with surface nodules, suggesting that hemicellulose particles were bound to the cell surface. Cells in cellulose cultures were shorter, non-flagellated, and adhered to cellulose (Figure 2I, Supplementary Figure S8). The mechanism by which C. phytofermentans adheres to plant substrates is unknown, but may include cell surface-binding proteins, secretion of an extrapolysaccharide glycocalyx, or cell surface pili visible by transmission electron microscopy (Supplementary Figure S9) that may facilitate binding as in Ruminococcus albus (Morrison and Miron, 2000).
Protein quantification
Proteins from glucose, hemicellulose, and cellulose culture lysates and the supernatants of hemicellulose and cellulose cultures were identified by liquid chromatography tandem mass spectrometry (LC-MS/MS). We quantified 2567 proteins across all five treatments (Figure 3A), representing 65% of the proteome (Supplementary Table SI). The fraction of proteins identified was comparable across all 23 Clusters of Orthologous Genes (COG) categories (Figure 3B), showing that the protein expression profiles cover diverse cellular functions. Although 357 hypothetical proteins were detected and thereby validated as real proteins, hypotheticals had the lowest percent identification among COGs, suggesting many are either expressed under specific conditions or are not expressed.
Figure 3.
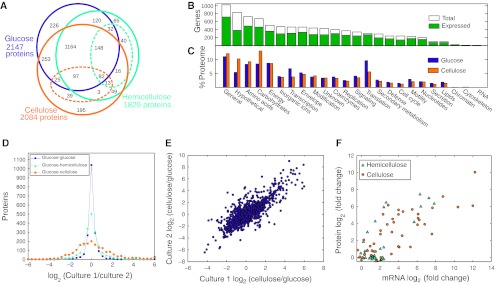
Protein identification (A–C) and quantification (D–F) by mass spectrometry. (A) Venn diagram of proteins identified in each treatment. Protein subsets in the hemicellulose and cellulose culture supernatants are shown with dashed ellipses. In total, 2567 of 3926 (65%) putative proteins were detected. (B) The 65% overall protein identification rate is conserved across Clusters of Orthologous Genes (COG) functional categories. (C) The percent of the proteome shown as summed Absolute Protein EXpression (APEX) values in each COG category for cells growing on glucose and cellulose. (D) Relative protein expression in different cultures quantified by ReDi labeling. The fraction of proteins expressed within twofold levels for the glucose treatment compared with a duplicate glucose culture (94%), hemicellulose (80%), and cellulose (49%) cultures. (E) Fold change in protein expression (MS1 peak area ratio, MPA ratio) for cellulose versus glucose duplicate cultures is highly correlated (r2=0.82). (F) Scatter plot of mRNA versus protein expression of 40 carbohydrate-active enzymes on cellulose (orange circles, r2=0.77) and hemicellulose (turquoise triangles, r2=0.71) versus glucose. The mRNA fold change was measured by qRT–PCR (−ΔΔCt).
Absolute protein abundances measured by APEX were highly correlated between duplicate cultures (Supplementary Figure S10). Comparing total protein synthesis allocated to each COG (summed APEX for all proteins in COG) in the glucose and cellulose cultures gives a general picture of cellular changes on these substrates (Figure 3C). These COG expression differences include processes directly related to cellulose degradation (i.e., increased carbohydrate metabolism) and indirect changes such as a reduced transcription and translation on cellulose, which likely resulted from slower growth. Hypothetical proteins were higher on cellulose (Figure 3C), suggesting many proteins of unknown function have roles in cellulose metabolism.
ReDi labeling modified the primary amines of all tryptic peptides with methyl groups bearing either deuterium (heavy label) or hydrogen (light label). The MS1 peak area ratio (MPA ratio), based on ion intensity peaks of the same peptide with different isotopic labels, was used to quantify proteome-wide expression changes between treatments. As an initial validation of the accuracy and reproducibility of ReDi labeling, we compared replicate experiments in which differentially labeled samples were mixed at several ratios. ReDi quantifications correspond to the ratios at which the samples were mixed (Supplementary Table SII) and replicate experiments were highly correlated across all ratios (r2=0.96) (Supplementary Figure S11).
ReDi labeling was applied to quantify proteome-wide expression changes on cellulosic substrates (heavy labeled) versus glucose (light labeled) (Supplementary Table SIII). We observed that 94% of proteins were expressed within twofold levels for differentially labeled duplicate glucose cultures, whereas 80% of proteins were within twofold when glucose was compared with hemicellulose and 49% when glucose was compared with cellulose (Figure 3D). Growth on cellulosic substrates thus results in widespread changes to the proteome relative to growth on glucose. Global expression changes on cellulose versus glucose were well correlated (r2=0.82) in replicate pairs of cultures (Figure 3E). Expression of CAZy proteins were also correlated with their mRNA expression changes on hemicellulose (r2=0.71) and cellulose (r2=0.77) relative to glucose (Figure 3F).
Secretome
Protein secretion mechanisms in C. phytofermentans are of particular interest because extracellular enzymes are needed to degrade insoluble, cellulosic polymers. The secretome was defined for hemicellulose (Supplementary Table SVI) and cellulose (Supplementary Table SVII) cultures using ReDi labeling to measure concentration differences of each protein between the supernatant (heavy labeled) and the lysate (light labeled) of the same culture (Supplementary Figure S12). Although the genome encodes several protein secretion pathways, the Sec system appears to be the primary means of secretion. N-terminal Sec-dependent secretion signals scored by SignalP3.0 (Bendtsen et al, 2004) (Supplementary Table SVIII) correlate with the probability of a protein being in the supernatant (Figure 4A) and many highly expressed CAZy have putative Sec secretion signals (Table I). Reduced N-terminal MS/MS peptide coverage of supernatant proteins with putative signal peptides supports the expectation that the signals were removed from mature proteins (Supplementary Figure S13). Defining the C. phytofermentans secretion signals will help to optimize secretion of heterologous proteins in this organism and to refine signal peptide predictions in related microbes. Type I signal peptides can be separated into a positively charged N-region, a hydrophobic H region and an alanine-rich cleavage site (Figure 4B). Type II signals for membrane-anchored lipoproteins have a shorter N-region and an lipobox anchor domain similar to C. acetobutylicum (Desvaux et al, 2005) containing the conserved cysteine for lipification (Figure 4C).
Figure 4.
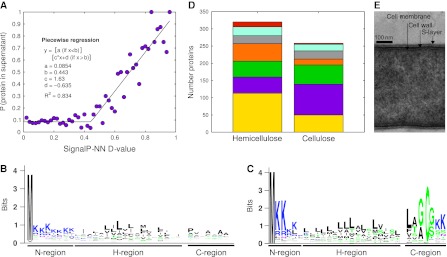
The C. phytofermentans secretome. (A) Proteins with high-scoring N-terminal signal peptides have a greater probability of being in culture supernatants. Fraction of proteins in proteome at each SignalP-NN D value observed in the supernatants of hemicellulose or cellulose cultures. Data were fit to a piecewise linear regression with the leftmost regression to a horizontal line. Consensus sequences of (B) type I and (C) type II lipoprotein N-terminal signal peptides for proteins found in the supernatant of cellulose cultures. (D) Functional categories of proteins in culture supernatants: rust, flagellum; turquoise, cell wall/surface; gray, proteases; orange, transport; green, CAZy; purple, other; gold, unknown. (E) Transmission electron micrograph of a C. phytofermentans cell cross section showing the cell membrane, cell wall, and surface layer.
Table I. Highly expressed enzymes for each step in the degradation of hemicellulose and cellulose.
| Protein | Function | CAZy | Hemicellulose | Cellulose | Psort | Signalp-NN |
|---|---|---|---|---|---|---|
| Protein ID, putative function, CAZy category, APEX expression, localization (PsortB v2.0), and significant signal peptide predictions (SignalP3.0-NN D-value>0.45) are shown. APEX values followed by (S) are supernatant proteins. | ||||||
| Hemicellulose | ||||||
| Xylan backbone to xylosaccharides | ||||||
| Cphy2108 | Cell surface 1,4-β-D-xylanase | GH10, CBM22 | 5737.9(S) | 563.8(S) | Cell wall | 0.9 |
| Cphy2105 | 1,4-β-D-Xylanase | GH11 | 3120.7(S) | 6007.9 | Extracellular | 0.97 |
| Cphy1510 | 1,4-β-D-Xylanase | GH10 | 2074.5(S) | 29559.8(S) | Extracellular | 0.9 |
| Cphy0624 | 1,4-β-D-Xylanase | GH10, CBM22 | 1055.6(S) | 4767.9(S) | Extracellular | 0.65 |
| Cphy3010 | 1,4-β-D-Xylanase | GH10 | 933.1 | 0.0 | Extracellular | — |
| Xylosaccharides to xylose | ||||||
| Cphy3009 | Non-reducing end 1,4-β-xylosidase | GH3 | 5982.0 | 542.6 | Cytoplasmic | — |
| Cphy3207 | Reducing end 1,4-β-xylosidase | GH8 | 2473.2 | 0.0 | Unknown | — |
| Remove hemicellulose side groups | ||||||
| Cphy3158 | α-1,2-Glucuronosidase | GH67 | 3508.9 | 82.4 | Cytoplasmic | — |
| Cphy3160 | β-Glucuronidase, galactosidase | GH2 | 813.3 | 1701.1 | Cytoplasmic | — |
| Cphy2632 | Arabinase | GH43 | 703.4 | 0.0 | Cytoplasmic | — |
| Cphy2848 | α-Glucuronidase, galactosidase | GH4 | 701.1 | 199.9(S) | Cytoplasmic | — |
| Cphy3862 | Xylanase, carboxylesterase | GH10, CE15 | 466.8(S) | 1511.7(S) | Extracellular | 0.9 |
| Cphy2730 | Acetyl xylan esterase | CE4 | 155.4 | 225.6 | Cytoplasmic | — |
| Cellulose | ||||||
| Hydrolysis of cellulose to cellodextrins | ||||||
| Cphy3368 | Exocellulase | GH48, CBM3 | 1911.7(S) | 9730.3(S) | Extracellular | 0.65 |
| Cphy3367 | Bifunctional endo, exocellulase | GH9, CBM3 | 2181.4(S) | 9277.7(S) | Extracellular | 0.87 |
| Cphy3202 | Cellulase | GH5, CBM2, CBM46 | 1550.3(S) | 3485.3(S) | Unknown | 0.81 |
| Cphy2058 | Cellulase | GH5 | 424.5(S) | 1199.0(S) | Unknown | 0.62 |
| Cphy1163 | Cellulase | GH5 | 136.9(S) | 525.1 | Unknown | 0.82 |
| Hydrolysis of cellodextrins | ||||||
| Cphy0220 | Non-reducing end β-glucosidase | GH3 | 688.9 | 3469.6 | Cytoplasmic | — |
| Cphy1169 | Endo-1,4-β-D-glucanase | GH51 | 112.0 | 615.3 | Cytoplasmic | — |
| Phosphorolytic cleavage of cellodextrins to glucose-1-phosphate | ||||||
| Cphy3854 | Cellodextrin, cellobiose phosphorylase | GH94 | 136.4 | 7602.4 | Membrane | — |
| Cphy0430 | Cellodextrin, cellobiose phosphorylase | GH94 | 166.2 | 4421.4 | Membrane | — |
| Cphy1929 | Cellodextrin, cellobiose phosphorylase | GH94 | 133.6 | 2743.0 | Membrane | — |
| Other highly expressed CAZy | ||||||
| Cphy1799 | Chitinase | GH18, CBM12 | 175.3(S) | 43042.0 | Unknown | 0.77 |
| Cphy1800 | Chitinase | GH18, CBM12 | 101.9(S) | 31498.1(S) | Extracellular | 0.8 |
| Cphy0218 | α-Glucosidase | GH31 | 184.5 | 3366.0 | Cytoplasmic | — |
| Cphy1687 | Polysaccharide deacetylase | CE4, CBM36 | 0.0 | 2551.3(S) | Extracellular | 0.858 |
| Cphy1888 | Pectin lyase | PL9 | 0.0 | 2334.6 | Extracellular | 0.72 |
| Cphy1071 | β-Mannanase | GH26, CBM3, CBM35 | 764.5(S) | 1664.3(S) | Extracellular | 0.68 |
| Cphy1652 | Chitinase | GH18, CBM50 | 0.0 | 1329.0(S) | Cytoplasmic | — |
| Cphy2128 | β-Mannanase | GH26, CBM3, CBM35 | 153.7(S) | 956.0(S) | Extracellular | 0.78 |
| Cphy1943 | Chitinase | GH19 | 625.6(S) | 875.4 | Unknown | 0.77 |
Proteins in culture supernatants act primarily in carbohydrate and protein degradation, cell surface and flagellar assembly, and transport (Figure 4D). Flagellar proteins were more abundant in the hemicellulose supernatant, consistent with SEM images (Figure 2H,I) showing that C. phytofermentans has a motile, planktonic phase on hemicellulose and a sessile phase when adhered to cellulose. Culture supernatants also contained numerous lipoproteins tethered to the cell surface. Lipoproteins are secreted by the Sec system, but attach to the membrane by the lipified N-terminal cysteine (von Heijne, 1989) in the lipobox. The most abundant lipoproteins were 43 expressed extracellular solute-binding proteins (ESBs) that capture substrates and pass them to a membrane transporter. In all, 47 of the 53 C. phytofermentans ESBs are involved in sugar transport and can be very highly expressed; the oligosaccharide-binding ESB Cphy2466 was the third most highly expressed protein on cellulose. In addition to nutrient-binding proteins, several CAZy are surface-attached lipoproteins.
The most highly expressed protein in the proteome, Cphy3510, is an unannotated, secreted protein with sequence similarity to the Bacillus anthracis S-layer protein, Sap (Etienne-Toumelin et al, 1995). The S-layer is a protein coat covering some bacteria that serves to attach extracellular proteins, gives mechanical stabilization, and acts as a molecular sieve (Sára and Sleytr, 1987). S-layers are generally composed of a single protein subunit which, on export by the Sec-system, spontaneously assembles into a symmetrical lattice (Sleytr and Messner, 1983). S-layers require ∼5 × 10⁵ protein molecules (Sleytr and Messner, 1988), often making the S-layer protein the most abundant of the cell. Transmission electron micrographs of C. phytofermentans show a surface layer exterior to the cell wall (Figure 4E; Warnick et al, 2002). On the basis of the high expression of Cphy3510 and its sequence similarity to Sap, we propose that the cell is covered by an Cphy3510-based S-layer that supports the cell and anchors cell surface proteins, including plant degradation enzymes.
Carbohydratases
Cells have elevated secreted and cellular cellulolytic enzyme activities on cellulosic substrates (Figure 5A). Supernatant proteins have higher activity against hemicellulose than cellulose even in cellulose cultures, showing the high activity of hemicellulases in this organism. Although most enzyme activity is found in culture supernatants, cellular enzymes also contribute to degrading these polymers (Figure 5A). Supportingly, growth on plant substrates involves the upregulation of numerous extra and intracellular CAZy, which are divided into distinct subsets that responded to each substrate (Figure 5B). CAZy were expressed at similar, basal levels on glucose (Figure 5C), whereas CAZy changed stoichiometries and represent a greater fraction of the proteome on hemicellulose and cellulose (Figure 5D and E). Combining CAZy expression with localization predicted by PsortB v2.0 (Gardy et al, 2005) and SignalP3.0 (Bendtsen et al, 2004) allows putative identification of the main enzymes to catalyze each step in the deconstruction of cellulosic substrates (Table I).
Figure 5.

Carbohydrate-active enzyme (CAZy) expression and activities in glucose, hemicellulose, and cellulose cultures. (A) Secreted and cellular cellulolytic enzyme activities. Protein lysates from cultures grown on glucose (purple), hemicellulose (turquoise), or cellulose (orange) prepared from the cellular fraction (C), supernatant (S), or whole-culture lystates (L). Proteins were incubated with hemicellulose (hemicellulase assay) or carboxymethylcellulose substrate (cellulase assay), reducing sugars were assayed using dinitrosalicyclic acid, and were normalized to protein concentration. (B) CAZy expression changes (MS1 peak area ratio, MPA ratio) on hemicellulose and cellulose versus glucose showing differentially expressed proteins (P<0.01) on hemicellulose (turquoise), cellulose (orange), or both (green). Symbols show cellular proteins (circles) and supernatant proteins (triangles). (C–E) Shifts in the relative abundances of CAZy proteins in glucose (C) hemicellulose (D), and cellulose (E) treatments by Absolute Protein EXpression (APEX) show acclimation to different carbon sources. Fraction of proteome comprised of CAZy proteins in each treatment is shown.
The first step of hemicellulose breakdown is cleavage of the xylan backbone by several extracellular endoxylanases (Table I). The most highly expressed endoxylanase, Cphy2108, is predicted by LocateP (Zhou et al, 2008) to have an LPXTG motif for covalent attachment to the peptidoglycan wall. Adhesion of a surface-bound xylanase to hemicellulose could account for the cell surface particles seen by electron microscopy (Figure 2H). Xylosaccharides are hydrolyzed to xylose by two main cellular exoxylosidases: Cphy3009 cleaves xylosides from the non-reducing end of xylosaccharides and Cphy3207 acts on the reducing end. Hardwood xylan such as the birch wood used in this study often has side chains of glucuronic and acetic acid (Shallom and Shoham, 2003), which are removed by additional enzymes (Table I).
Depolymerization of cellulose fibers is catalyzed by endocellulases, which cut random sites on the cellulose surface to generate free chain ends. Among the many CAZy upregulated on cellulose (Figure 5B), the most highly secreted putative endocellulase Cphy3367 is required for cellulose degradation (Tolonen et al, 2009) and solubilizes cellulose in vitro (Zhang et al, 2010a). Exocellulases channel the freed cellulose chains through an active site tunnel to iteratively cleave saccharides (Divne et al, 1994). Cphy3368 is an exocellulase (Zhang et al, 2010b) that is expressed similar to Cphy3367 (Figure 5) and these two enzymes synergize to accelerate cellulolysis in vitro (Zhang et al, 2010a). Expression data supports the resulting cellodextrins are transported for intracellular catabolism by hydrolysis with beta-glucosidases and phosphorolytic cleavage with cellodextrin phosphorylases. Cphy0220 was the most highly expressed putative beta-glucosidase (Figure 5D). Three cellodextrin phosphorylases (Table I) cleave terminal glucosides from cellodextrins using phosphate as an attacking group. Phosphorolysis avoids ATP hydrolysis for direct phosphorylation of glucose during import, such as with the Escherichia coli phosphotransferase system. Although the ATP savings correlates with the length of the transported cellodextrin, uptake and phosphorolytic cleavage of glucans can reduce cellular ATP requirements by 25% (Zhang and Lynd, 2005).
Carbon metabolism
Because of the low ATP yield of anaerobic metabolism, C. phytofermentans needs to optimize energy output from carbon metabolism. In addition to cellodextrin phosphorylases, ATP is conserved by highly expressing reversible, pyrophosphate (PPi)-dependent glycolytic enzymes such as PPi-dependent phosphofructokinase and pyruvate phosphate dikinase. C. phytofermentans lacks the Ppa phosphatase used by E. coli to cleave PPi and instead uses it as a phosphate donor and source of a high-energy bond. PPi-dependent glycolytic enzymes can boost yield of glycolysis from two to five ATP (Slamovits and Keeling, 2006). Clostridia have low pyrophosphatase activities and high intracellular PPi levels (Heinonen and Drake, 1988), supporting a key role of PPi in their metabolism.
To maximize glycolytic turnover, reducing equivalents from glycolysis are consumed by reducing acetyl-CoA to ethanol with five Fe-dependent and one Zn-dependent alcohol dehydrogenase (ADH) proteins. Two Fe-dependent ADH, Cphy3925 and Cphy1029, were among the several most highly expressed proteins in all treatments. Cphy3925 shares 54% amino acid identity with E. coli AdhE, a bifunctional aldehyde/ADH that converts acetyl-CoA directly to ethanol. The other highly expressed ADH, Cphy1029, shares 35% amino acid identity with Zymomonas mobilis AdhB, the primary ADH in this organism. C. phytofermentans also has a Zn-dependent ADH Cphy1179 that is homologous to the other Z. mobilis ADH, AdhA. This combination of ADHs facilitates the high ethanol yields (Figure 2). Another adaptation to increase glycolytic throughput is the high expression of two types of [FeFe]-hydrogenases that produce hydrogen by oxidizing reduced ferredoxin and NADH from glycolysis. Monomeric hydrogenases oxidize only ferredoxin, whereas the bifurcating hydrogenases oxidize both ferredoxin and NADH in a 1:1 ratio (Schut and Adams, 2009). All subunits for two multimeric, bifurcating hydrogenases were highly expressed on all carbon sources; a monomeric ferredoxin-dependent hydrogenase was expressed at a 10-fold lower level.
Proteome-wide interaction networks of proteins (circles) connected to CAZy and KEGG categories (triangles) show that expression changes on cellulose extend to diverse aspects of metabolism (Figure 6), while changes on hemicellulose (Supplementary Figure S14) occur mainly in pentose assimilation, the pentose phosphate pathway, CAZy, and transporters. Growth on cellulose results in repression of flagella, fatty acid synthesis, and many housekeeping functions (DNA replication, transcription, and translation). In addition to numerous transporters and carbohydratases, proteins upregulated on cellulose are involved in glycolysis, assimilation of alternative sugars, and nicotinamide synthesis to increase glycolytic flux.
Figure 6.

Proteome-wide expression changes on cellulose versus glucose visualized as a Cytoscape interaction network (Shannon et al, 2003). Nodes are proteins (circles) or KEGG/carbohydrate-active enzyme (CAZy) categories (yellow diamonds); edges are protein interactions defined by KEGG or CAZy databases. Protein node sizes show expression on cellulose as log2 (Absolute Protein EXpression, APEX). Node colors are expression changes as cellulose/glucose log2 protein ratios (MS1 peak area ratio, MPA ratio). Proteins less than twofold changed are white, higher on cellulose are graded orange, and higher on glucose are graded purple (see legend).
The tryptophan biosynthesis proteins are upregulated on cellulose, which could increase ethanol tolerance similar to yeast (Hirasawa et al, 2007; Zhao and Bai, 2009) and enable production of hydrolases with tryptophan-rich carbohydrate-binding modules (CBM). CBM enhance catalysis by keeping carbohydratases in close association with their substrates (Tomme et al, 1988). Thirteen glycoside hydrolases with CBM were upregulated on cellulose. CBM proteins have elevated tryptophan contents relative to the proteome (Supplementary Figure S15) because CBM contact carbohydrates using a hydrophobic platform of tryptophan residues (Ponyi et al, 2000) that form van der Waals interactions with sugar rings (Lehtiö et al, 2003). The high expression of tryptophan synthesis proteins suggests that tryptophan may be an important factor limiting conversion of cellulose to ethanol.
Discussion
Cellulolytic microbes such as C. phytofermentans reveal novel strategies for developing microbes to overcome the recalcitrance of cellulosic feedstocks, currently the main barrier to cellulosic biofuels (Houghton et al, 2006). We analyzed C. phytofermentans growth and fermentation of different cellulosic polymers (Figure 2), comprehensively quantified proteome changes that enabled fermentation of each substrate, and distilled the data into a model of cellulosic fermentation (Figure 7) showing key enzymes that can be engineered in this bacteria and other hosts to potentially optimize cellulosic biofuels. Growth on biomass involves secretion of numerous CAZy as well as proteins for motility, binding of extracellular solutes, proteolysis, and formation of a proteinaceous surface layer (Figure 4D). Oligosaccharides were uptaken before breakdown by intracellular CAZy, enabling more efficient sugar transport, conserving energy by phosphorolytic cleavage, and ensuring the sugar monomers were not available to competing microbes. Sugars were catabolized using an EMP glycolysis incorporating reversible, PPi-dependent glycolytic enzymes and fermented using pyruvate ferredoxin oxidoreductase and multiple ADHs. Growth on cellulose also resulted in broad metabolic changes such as increased tryptophan and nicotinamide synthesis and repression of fatty acid synthesis (Figure 6), which suggest ways to optimize cellulosic fermentation by supplementing growth media or genetic modification.
Figure 7.

Model of the key secreted and intracellular proteins for the degradation and fermentation of plant biomass. Protein ID numbers are colored by highest Absolute Protein EXpression (APEX) expression on glucose (purple), hemicellulose (turquoise), cellulose (orange). Number in parentheses show the number of proteins of related function.
Cellulosic bioconversion can be accelerated by expression of cellulolytic enzymes in their native hosts as well as in model organisms such as yeast (Den Haan et al, 2007; Tsai et al, 2009) and E. coli (Steen et al, 2010). C. phytofermentans cellulolytic enzymes may be particularly well suited to enable cellulosic bioconversion by heterologous expression. Unlike other clostridia that package cellulolytic enzymes into a cellulosome, C. phytofermentans freely secretes these enzymes such that they can be functionally expressed without relying on a cellulosomal scaffold. However, considering the C. phytofermentans genome encodes 161 CAZy, it would take 12 880 experiments to find the most effective enzyme pair for any particular substrate. High throughput methods such as quantitative proteomics are thus needed to systematically quantify the enzymes used by cellulolytic microbes to metabolize different biomass types. In this study, we build upon proteomic studies of cellulosomes in other clostridia (Gold and Martin, 2007; Raman et al, 2009; Blouzard et al, 2010), to show how C. phytofermentans alters the stoichiometries of more than 100 CAZy (Figure 5) as well as diverse metabolic processes (Figure 6) when fermenting cellulosic substrates. By identifying the most highly upregulated and the secreted enzymes, we can prioritize targets for more efficient bioconversion of different types of biomass (Ito et al, 2010). This approach is supported in that Cphy3367, which is the second most highly upregulated CAZy on cellulose and was secreted into the supernatant (Figure 5B), has recently been shown to be essential for cellulolysis (Tolonen et al, 2009) and to solubilize cellulose in vitro (Zhang et al, 2010a). In this study, we focused on chemically defined substrates. In the future, we will apply these methods to untreated plant biomass composed of diverse polysaccharides and non-fermentable, soluble components.
In addition to cellulolytic enzymes, cellulosic biofuels can be optimized by more efficient fermentation. C. phytofermentans ferments cellulose to ethanol with high specificity (Figure 2F), supporting that accelerating cellulose deconstruction will give larger gains than streamlining end products. This high fermentation efficiency also suggests heterologous expression of the alternative glycolytic enzymes and multiple ADHs from C. phytofermentans (Figure 7) could improve ethanol yields in other microbes. C. phytofermentans grows rapidly on hemicellulose (Figure 2B), but produces more acetate relative to ethanol (Figure 2E). Faster growth on hemicellulose than on glucose or xylose may result from faster uptake of xylosaccharides by high-affinity transporters, energy savings because of transport of oligosaccharides relative to sugar monomers (Muir et al, 1985), or the presence of an unidentified xylosaccharide phosphorylase. Higher relative acetate produced on hemicellulose than on cellulose is also supported by higher expression of acetate kinase, which could be inactivated to improve ethanol yields on hemicellulose-rich substrates. Additionally, acetate accumulation in hemicellulose cultures may partially result from cleavage of acetyl side chains from xylose subunits, which are common to hardwood xylans such as the birchwood used here (Shallom and Shoham, 2003).
Proteome-wide expression changes by ReDi proteomics are consistent with mRNA measurements by qRT–PCR (Figure 3F), but are advantageous in directly quantifying proteins and allowing discrimination of secreted and cellular enzymes. ReDi labeling is advantageous to stable isotope labeling by amino acids in cell culture (SILAC) (Ong and Mann, 2006), a widely used alternative approach for stable isotope incorporation, in not requiring strains with specific amino acid auxotrophies or optimization of growth on synthetic medium. As ReDi uses inexpensive, highly quantitative chemistry and a small mass tag, it is easily incorporated into routine proteomics protocols (Boersema et al, 2009). ReDi proteomics will be a key part of research to enable cellulosic biofuels and can be applied to many other research areas as well.
Materials and methods
Growth and HPLC
C. phytofermentans ISDg ATCC 700394 was cultured anaerobically at 32°C in GS2 medium (Johnson et al, 1981) with either 3 g l−1 glucose, 3 g l−1 birch wood hemicellulose xylan (Sigma X0502, >90% poly-beta-1,4-D-xylopyranose), or 10 g l−1 cellulose (0.5 × 5 cm strips of Whatman #1 filter paper cat 1001-090, cellulose content >98%). Degradation of cellulose was quantified as the dry mass of cellulose remaining in culture. Cellulose was collected on 11 μ filters by vacuum filtration, dried overnight at 65°C, and weighed. Growth in glucose and hemicellulose cultures was quantified as OD600 (OD600=1.1 is 109 cells ml−1). Fermentation products were quantified by HPLC using a Biorad aminex HPX-87H 300 × 7.8 mm column maintained at 60°C with a Waters 2414 refractive index detector (see Supplementary Information for growth and fermentation calculations).
Electron microscopy
Scanning electron microscopy samples were bound to glass cover slips with 0.1% poly-L-lysine and incubated for 15 min in primary fixative (2.5% glutaraldehyde, 2.5% formaldehyde, and 0.1 M sodium cacodylate). Samples were rinsed for 30 min in 0.1 M sodium cacodylate and immersed for 15 min in 1% osmium tetroxide, and 0.1 M sodium cacodylate (pH 7.2). Cells were dehydrated with a 30–100% ethanol graded series, critical point dried, and sputter coated. The samples were examined on a Hitachi S-4800 FE-SEM. Cells for transmission electron microscopy were pelleted and suspended in primary fixative for 30 min at room temperature. The fixed cells were washed in water, embedded in 2% agarose, rinsed with 0.1 M sodium cacodylate, and post-fixed (1% osmium tetroxide, and 0.1 M cacodylate, pH 7.4) for 2 h. Samples were dehydrated with a 30–100% ethanol graded series and polymerized in Spurrs/Quetol at 55C for 24 h. Agarose was sliced (<90 nm) and visualized on a JEOL JEM-1010 TEM.
Quantitative proteomics
Culture protein lysates were prepared by French press of glucose and hemicellulose cultures in mid-log phase and from cellulose cultures after 2 weeks of growth. Supernatant proteins were isolated by three rounds of centrifugation (5k, 15 min) with transfer of the supernatant to a fresh tube, followed by 0.1 μ filtration. Proteins were precipitated with ¼ volume of 100% (w/w) trichloroacetic acid (TCA) and incubated for 60 min at 37°C in 1% SDS, 0.2 M NaOH, and 10 mM DTT. Cysteines were alkylated with 30 mM iodoacetamide at room temperature in the dark for 60 min. Proteins were again TCA precipitated and resuspended in 50 mM Tris–HCl (pH 7.6), 1 M urea and digested overnight at 37°C with sequencing grade trypsin (Promega, WI, USA) in a ∼50:1 substrate-to-enzyme ratio.
Peptide solutions were acidified with trifluoroacetic acid (TFA) to a final concentration of 0.5% and 500 μg of peptides were subjected to C18 reversed-phase extraction using a 100 mg Sep-Pak cartridge (Waters, MA). Following sample loading and a 4 ml wash step with 0.1% TFA, the cartridge was washed with 2 ml of 0.2 M citric acid/sodium phosphate buffer (pH 5.5) and peptides were labeled through ReDi with 8 ml of 0.8% formaldehyde (D2 labeled or in normal isotopic distribution, Sigma, MO) and 0.12 M sodium cyanoborohydride (Sigma) or sodium cyanoborodeuteride (CDN Isotopes, Canada) for 8 min. After washing with 0.1% TFA and 0.5% acetic acid AcOH, labeled peptides were eluted with 40% acetonitrile (ACN), 0.5% AcOH and 80% ACN, 0.5% AcOH. Light and heavy peptides were mixed and separated into 16 fractions by immobilized pH gradient isoelectric focusing (IPG-IEF) on a 18 cm pH 3–10 IPG strip using a IPGphor apparatus (Chick et al, 2008) (GE Healthcare, WI). Peptides were desalted using C18-StageTips (Rappsilber et al, 2003) and analyzed by microcapillary lLC-MS/MS using a hybrid dual pressure linear ion trap/Orbitrap mass spectrometer (LTQ Orbitrap Velos, Thermo Scientific, Bremen, Germany) essentially as described (Haas et al, 2006). Peptides were dissolved in 5% formic acid (FA) and 5% ACN and ∼1 μg was separated on a 100 μm × 20 cm C18-reversed phase (Magic C18AQ, Michrom Bioresources) column applying a gradient from 10% ACN to 32% ACN in 0.125% FA over a 75 or 100 min gradient at a flow rate of ∼300 nl min−1. The mass spectrometer was operated in a data-dependent mode with a full MS scan (resolution, 60 000) acquired in the Orbitrap analyzer followed by linear ion trap MS/MS spectra on the 20 most abundant ions detected in the full MS spectrum. Automatic gain control (AGC) targets were 3 × 10⁶ for the full MS and 2000 for MS/MS, maximum ion accumulation times were set to 1000 ms (MS) and 150 ms (MS/MS). Fragmented peptide precursor ions were excluded from further selection for MS/MS for 20–60 s (see RAW data). The RAW data files have been deposited in Proteome Commons (http://www.proteomecommons.org) and can be downloaded using the following hash key:
 |
Peptides were identified from MS/MS spectra using SEQUEST and were filtered to a 1% MS/MS spectra assignment false discovery rate using a target-decoy sequence database (Elias and Gygi, 2010) of the 3926 C. phytofermentans (NCBI NC_010001.faa) proteins, common contaminants such as trypsin and human keratins, and a decoy component of the reversed sequences of these proteins. Absolute protein abundances within each treatment were estimated from MS/MS spectral counts using APEX, a machine learning-supported analysis based on spectral counting (see APEX section of Supplementary Information). Extracted ion current peak areas (MS1 peaks) of light and heavy versions of the same peptide were compared to determine their relative concentration differences using VISTA (Bakalarski et al, 2008). Protein expression changes were calculated as the median peptide concentration change, here called the median MPA ratio. Significant differential expression was assessed using aggregate Z-scores for all peptides in a protein (see ReDi section of Supp Info). Peptide pairs were quantified only when their average signal-to-noise ratio was above five and proteins for which exclusively light or heavy peptides were detected are reported only if their identification was based on at least two unique peptides. After this additional filtering, the protein false discovery rate for each experiment was lower than 5%. Expression measurements are from individual cultures (APEX) or culture comparisons (ReDi). Replicate experiments were run to establish high reproducibility between biological replicates for APEX (Supplementary Figure S10) and for ReDi labeling of biological duplicates (Figure 3D), treatment comparisons (Figure 3E), and differentially labeled samples mixed at various ratios (Supplementary Figure S11).
DNS reduced sugar assay
Enzymatic activities of protein lysates against cellulosic substrates were quantified by 3,5-dinitrosalicylic acid (DNS) assay (Miller, 1959). Proteins from glucose, hemicellulose, and cellulose cultures were assayed as French press lysates of cellular pellets resuspended in fresh medium, whole-culture lysates, or supernatant fractions. Proteins were incubated with either 0.1% hemicellulose xylan or carboxymethylcellulose for 15 min at 50°C before addition of DNS (Sigma D0550) and boiling for 15 min. Reduced sugars were quantified colorimetrically as OD600. Reduced sugar equivalents were calibrated using standard curves of glucose (for carboxymethylcellulose) or xylose (for hemicellulose). Enzyme activities were normalized to protein concentrations by BCA assay (Pierce product 23227).
qRT–PCR
Cells were collected by centrifugation for mRNA analysis from cultures at the same time points as protein samples. A Ribopure Bacteria Kit (Ambion AM1925) was used to extract RNA; remaining DNA was removed using Dnase I (Ambion AM2222). One microgram RNA was reverse transcribed to single-stranded DNA using the Superscript First Strand cDNA Synthesis Kit (Invitrogen 11904018). Real-time PCR amplification was conducted using a MJ Research DNA Engine Opticon II machine by monitoring incorporation of SYBR green I (Invitrogen S7563). PCR primers (Supplementary Table SIV) amplified 100 bp products from each gene. Relative gene expression was quantified using the comparative CT method (Schmittgen and Livak, 2008) with the 16S ribosomal sequence serving as the internal control gene (Supplementary Table SV). Expression values are the means of duplicate measurements from duplicate cultures.
Supplementary Material
Supplementary information, Supplementary figures S1–15, Supplementary tables SI–VIII
Acknowledgments
We thank B Fowle and W Curtis for technical expertize and S Leschine, T Warnick and J Blanchard for help and sharing C. phytofermentans cultures. This work was funded by DOE GtL grant DE-FG02-02ER-63445 to GMC and an SRA with Qteros Inc. Author Contributions: ACT, WH, JA, SPG, and GMC designed experiments. ACT, WH, and ACC conducted experiments. ACT, WH, and JA analyzed the data. ACT, WH, and JA wrote the paper.
Footnotes
The authors declare that they have no conflict of interest.
References
- Bakalarski CE, Elias JE, Villén J, Haas W, Gerber SA, Everley PA, Gygi SP (2008) The impact of peptide abundance and dynamic range on stable-isotope-based quantitative proteomic analyses. J Proteome Res 7: 4756–4765 [DOI] [PMC free article] [PubMed] [Google Scholar]
- Bendtsen JD, Nielsen H, von Heijne G, Brunak S (2004) Improved prediction of signal peptides: SignalP 3.0. J Mol Biol 340: 783–795 [DOI] [PubMed] [Google Scholar]
- Blouzard JC, Coutinho PM, Fierobe HP, Henrissat B, Lignon S, Tardif C, Pagès S, de Philip P (2010) Modulation of cellulosome composition in Clostridium cellulolyticum: adaptation to the polysaccharide environment revealed by proteomic and carbohydrate-active enzyme analyses. Proteomics 10: 541–554 [DOI] [PubMed] [Google Scholar]
- Boersema PJ, Raijmakers R, Lemeer S, Mohammed S, Heck AJR (2009) Multiplex peptide stable isotope dimethyl labeling for quantitative proteomics. Nat Protoc 4: 484–494 [DOI] [PubMed] [Google Scholar]
- Cantarel BL, Coutinho PM, Rancurel C, Bernard T, Lombard V, Henrissat B (2009) The Carbohydrate-Active EnZymes database (CAZy): an expert resource for Glycogenomics. Nucleic Acids Res 37: D233–D238 [DOI] [PMC free article] [PubMed] [Google Scholar]
- Chick JM, Haynes PA, Molloy MP, Bjellqvist B, Baker MS, Len AC (2008) Characterization of the rat liver membrane proteome using peptide immobilized pH gradient isoelectric focusing. J Proteome Res 7: 1036–1045 [DOI] [PubMed] [Google Scholar]
- Den Haan R, Rose SH, Lynd LR, van Zyl WH (2007) Hydrolysis and fermentation of amorphous cellulose by recombinant Saccharomyces cerevisiae. Metab Eng 9: 87–94 [DOI] [PubMed] [Google Scholar]
- Desvaux M, Khan A, Scott-Tucker A, Chaudhuri RR, Pallen MJ, Henderson IR (2005) Genomic analysis of the protein secretion systems in Clostridium acetobutylicum ATCC 824. Biochim Biophys Acta 1745: 223–253 [DOI] [PubMed] [Google Scholar]
- Divne C, Ståhlberg J, Reinikainen T, Ruohonen L, Pettersson G, Knowles JK, Teeri TT, Jones TA (1994) The three-dimensional crystal structure of the catalytic core of cellobiohydrolase I from Trichoderma reesei. Science 265: 524–528 [DOI] [PubMed] [Google Scholar]
- Elias JE, Gygi SP (2010) Target-decoy search strategy for mass spectrometry-based proteomics. Methods Mol Biol 604: 55–71 [DOI] [PMC free article] [PubMed] [Google Scholar]
- Etienne-Toumelin I, Sirard JC, Duflot E, Mock M, Fouet A (1995) Characterization of the Bacillus anthracis S-layer: cloning and sequencing of the structural gene. J Bacteriol 177: 614–620 [DOI] [PMC free article] [PubMed] [Google Scholar]
- Falkowski P, Scholes RJ, Boyle E, Canadell J, Canfield D, Elser J, Gruber N, Hibbard K, Högberg P, Linder S, Mackenzie FT, Moore B III, Pedersen T, Rosenthal Y, Seitzinger S, Smetacek V, Steffen W (2000) The global carbon cycle: a test of our knowledge of earth as a system. Science 290: 291–296 [DOI] [PubMed] [Google Scholar]
- Gardy JL, Laird MR, Chen F, Rey S, Walsh CJ, Ester M, Brinkman FS (2005) PSORTb v.2.0: expanded prediction of bacterial protein subcellular localization and insights gained from comparative proteome analysis. Bioinformatics 21: 617–623 [DOI] [PubMed] [Google Scholar]
- Gold ND, Martin VJJ (2007) Global view of the Clostridium thermocellum cellulosome revealed by quantitative proteomic analysis. J Bacteriol 189: 6787–6795 [DOI] [PMC free article] [PubMed] [Google Scholar]
- Haas W, Faherty BK, Gerber SA, Elias JE, Beausoleil SA, Bakalarski CE, Li X, Villén J, Gygi SP (2006) Optimization and use of peptide mass measurement accuracy in shotgun proteomics. Mol Cell Proteomics 5: 1326–1337 [DOI] [PubMed] [Google Scholar]
- Heinonen JK, Drake HL (1988) Comparative assessment of inorganic pyrophosphate and pyrophosphatase levels of Escherichia coli, Clostridium pasteurianum, and Clostridium thermoaceticum. FEMS Microbiol Lett 52: 205–208 [Google Scholar]
- Hirasawa T, Yoshikawa K, Nakakura Y, Nagahisa K, Furusawa C, Katakura Y, Shimizu H, Shioya S (2007) Identification of target genes conferring ethanol stress tolerance to Saccharomyces cerevisiae based on DNA microarray analysis. J Biotechnol 131: 34–44 [DOI] [PubMed] [Google Scholar]
- Houghton J, Weatherwax S, Ferrell J (2006) Breaking the biological barriers to cellulosic ethanol. US Dept of Energy Research Roadmap. pp 1–206 (http://www.genomicscience.energy.gov/biofuels/b2bworkshop.shtml#page=news) [Google Scholar]
- Hsu J, Huang S, Chow N, Chen S (2003) Stable-isotope dimethyl labeling for quantitative proteomics. Anal Chem 75: 6843–6852 [DOI] [PubMed] [Google Scholar]
- Ito J, Petzold CJ, Mukhopadhyay A, Heazlewood JL (2010) The role of proteomics in the development of cellulosic biofuels. Curr Proteomics 7: 121–134 [Google Scholar]
- Johnson EA, Madia A, Demain AL (1981) Chemically Defined Minimal Medium for Growth of the Anaerobic Cellulolytic Thermophile Clostridium thermocellum. Appl Environ Microbiol 41: 1060–1062 [DOI] [PMC free article] [PubMed] [Google Scholar]
- Lehtiö J, Sugiyama J, Gustavsson M, Fransson L, Linder M, Teeri TT (2003) The binding specificity and affinity determinants of family 1 and family 3 cellulose binding modules. Proc Natl Acad Sci USA 100: 484–489 [DOI] [PMC free article] [PubMed] [Google Scholar]
- Leschine SB (1995) Cellulose degradation in anaerobic environments. Annu Rev Microbiol 49: 399–426 [DOI] [PubMed] [Google Scholar]
- Lu P, Vogel C, Wang R, Yao X, Marcotte EM (2007) Absolute protein expression profiling estimates the relative contributions of transcriptional and translational regulation. Nat Biotechnol 25: 117–124 [DOI] [PubMed] [Google Scholar]
- Lu Y, Zhang YH, Lynd LR (2006) Enzyme-microbe synergy during cellulose hydrolysis by Clostridium thermocellum. Proc Natl Acad Sci USA 103: 16165–16169 [DOI] [PMC free article] [PubMed] [Google Scholar]
- Lynd LR, Weimer PJ, van Zyl WH, Pretorius IS (2002) Microbial cellulose utilization: fundamentals and biotechnology. Microbiol Mol Biol Rev 66: 506–577 [DOI] [PMC free article] [PubMed] [Google Scholar]
- Miller GL (1959) Use of dinitrosalicylic acid reagent for determination of reducing suga. Anal Chem 31: 426 [Google Scholar]
- Morrison M, Miron J (2000) Adhesion to cellulose by Ruminococcus albus: a combination of cellulosomes and Pil-proteins? FEMS Microbiol Lett 185: 109–115 [DOI] [PubMed] [Google Scholar]
- Muir M, Williams L, Ferenci T (1985) Influence of transport energization on the growth yield of Escherichia coli. J Bacteriol 163: 1237–1242 [DOI] [PMC free article] [PubMed] [Google Scholar]
- Ong S, Mann M (2006) A practical recipe for stable isotope labeling by amino acids in cell culture (SILAC). Nat Protoc 1: 2650–2660 [DOI] [PubMed] [Google Scholar]
- Perlack RD, Wright LL, Turhollow A, Graham RL, Stokes B, Erbach DC (2005) Biomass as a feedstock for a bioenergy and bioproducts industry: the technical feasibility of a billion-ton annual supply. A Joint Study by the US Dept of Energy and the US Dept of Agriculture. pp 1–78 (http://www.ornl.gov/~webworks/cppr/y2001/rpt/123021.pdf) [Google Scholar]
- Ponyi T, Szabó L, Nagy T, Orosz L, Simpson PJ, Williamson MP, Gilbert HJ (2000) Trp22, Trp24, and Tyr8 play a pivotal role in the binding of the family 10 cellulose-binding module from Pseudomonas xylanase A to insoluble ligands. Biochemistry 39: 985–991 [DOI] [PubMed] [Google Scholar]
- Raman B, Pan C, Hurst GB, Rodriguez M Jr, McKeown CK, Lankford PK, Samatova NF, Mielenz JR. (2009) Impact of pretreated Switchgrass and biomass carbohydrates on Clostridium thermocellum ATCC 27405 cellulosome composition: a quantitative proteomic analysis. PLoS ONE 4: e5271. [DOI] [PMC free article] [PubMed] [Google Scholar]
- Rappsilber J, Ishihama Y, Mann M (2003) Stop and go extraction tips for matrix-assisted laser desorption/ionization, nanoelectrospray, and LC/MS sample pretreatment in proteomics. Anal Chem 75: 663–670 [DOI] [PubMed] [Google Scholar]
- Sára M, Sleytr UB (1987) Molecular sieving through S layers of Bacillus stearothermophilus strains. J Bacteriol 169: 4092–4098 [DOI] [PMC free article] [PubMed] [Google Scholar]
- Schmittgen TD, Livak KJ (2008) Analyzing real-time PCR data by the comparative C(T) method. Nat Protoc 3: 1101–1108 [DOI] [PubMed] [Google Scholar]
- Schut GJ, Adams MWW (2009) The iron-hydrogenase of Thermotoga maritima utilizes ferredoxin and NADH synergistically: a new perspective on anaerobic hydrogen production. J Bacteriol 191: 4451–4457 [DOI] [PMC free article] [PubMed] [Google Scholar]
- Shallom D, Shoham Y (2003) Microbial hemicellulases. Curr Opin Microbiol 6: 219–228 [DOI] [PubMed] [Google Scholar]
- Slamovits CH, Keeling PJ (2006) Pyruvate-phosphate dikinase of oxymonads and parabasalia and the evolution of pyrophosphate-dependent glycolysis in anaerobic eukaryotes. Eukaryot Cell 5: 148–154 [DOI] [PMC free article] [PubMed] [Google Scholar]
- Shannon P, Markiel A, Ozier O, Baliga NS, Wang JT, Ramage D, Amin N, Schwikowski B, Ideker T (2003) Cytoscape: a software environment for integrated models of biomolecular interaction networks. Genome Res 13: 2498–2504 [DOI] [PMC free article] [PubMed] [Google Scholar]
- Sleytr UB, Messner P (1983) Crystalline surface layers on bacteria. Annu Rev Microbiol 37: 311–339 [DOI] [PubMed] [Google Scholar]
- Sleytr UB, Messner P (1988) Crystalline surface layers in procaryotes. J Bacteriol 170: 2891–2897 [DOI] [PMC free article] [PubMed] [Google Scholar]
- Somerville C (2006) The billion-ton biofuels vision. Science 312: 1277. [DOI] [PubMed] [Google Scholar]
- Steen EJ, Kang Y, Bokinsky G, Hu Z, Schirmer A, McClure A, Del Cardayre SB, Keasling JD (2010) Microbial production of fatty-acid-derived fuels and chemicals from plant biomass. Nature 463: 559–562 [DOI] [PubMed] [Google Scholar]
- Tolonen AC, Chilaka AC, Church GM (2009) Targeted gene inactivation in Clostridium phytofermentans shows that cellulose degradation requires the family 9 hydrolase Cphy3367. Mol Microbiol 74: 1300–1313 [DOI] [PMC free article] [PubMed] [Google Scholar]
- Tomme P, Van Tilbeurgh H, Pettersson G, Van Damme J, Vandekerckhove J, Knowles J, Teeri T, Claeyssens M. (1988) Studies of the cellulolytic system of Trichoderma reesei QM 9414. Analysis of domain function in two cellobiohydrolases by limited proteolysis. Eur J Biochem 170: 575–581 [DOI] [PubMed] [Google Scholar]
- Tsai S, Oh J, Singh S, Chen R, Chen W (2009) Functional assembly of minicellulosomes on the Saccharomyces cerevisiae cell surface for cellulose hydrolysis and ethanol production. Appl Environ Microbiol 75: 6087–6093 [DOI] [PMC free article] [PubMed] [Google Scholar]
- von Heijne G (1989) The structure of signal peptides from bacterial lipoproteins. Protein Eng 2: 531–534 [DOI] [PubMed] [Google Scholar]
- Warnick TA, Methé BA, Leschine SB (2002) Clostridium phytofermentans sp. nov., a cellulolytic mesophile from forest soil. Int J Syst Evol Microbiol 52: 1155–1160 [DOI] [PubMed] [Google Scholar]
- Zhang YH, Lynd LR (2005) Cellulose utilization by Clostridium thermocellum: bioenergetics and hydrolysis product assimilation. Proc Natl Acad Sci USA 102: 7321–7325 [DOI] [PMC free article] [PubMed] [Google Scholar]
- Zhang X, Sathitsuksanoh N, Zhang YH (2010a) Glycoside hydrolase family 9 processive endoglucanase from Clostridium phytofermentans: heterologous expression, characterization, and synergy with family 48 cellobiohydrolase. Bioresour Technol 101: 5534–5538 [DOI] [PubMed] [Google Scholar]
- Zhang XZ, Zhang Z, Zhu Z, Sathitsuksanoh N, Yang Y, Zhang YH (2010b) The noncellulosomal family 48 cellobiohydrolase from Clostridium phytofermentans ISDg: heterologous expression, characterization, and processivity. Appl Microbiol Biotechnol 86: 525–533 [DOI] [PubMed] [Google Scholar]
- Zhao XQ, Bai FW (2009) Mechanisms of yeast stress tolerance and its manipulation for efficient fuel ethanol production. J Biotechnol 144: 23–30 [DOI] [PubMed] [Google Scholar]
- Zhou M, Boekhorst J, Francke C, Siezen RJ (2008) LocateP: genome-scale subcellular-location predictor for bacterial proteins. BMC Bioinformatics 9: 173. [DOI] [PMC free article] [PubMed] [Google Scholar]
Associated Data
This section collects any data citations, data availability statements, or supplementary materials included in this article.
Supplementary Materials
Supplementary information, Supplementary figures S1–15, Supplementary tables SI–VIII