

Abstract
Oxygen transport imposes a possible constraint on the brain's ability to sustain variable metabolic demands, but oxygen diffusion in the cerebral cortex has not yet been observed directly. We show that concurrent two-photon fluorescence imaging of endogenous nicotinamide adenine dinucleotide (NADH) and the cortical microcirculation exposes well-defined boundaries of tissue oxygen diffusion in the mouse cortex. The NADH fluorescence increases rapidly over a narrow, very low pO2 range with a p50 of 3.4±0.6 mm Hg, thereby establishing a nearly binary reporter of significant, metabolically limiting hypoxia. The transient cortical tissue boundaries of NADH fluorescence exhibit remarkably delineated geometrical patterns, which define the limits of tissue oxygen diffusion from the cortical microcirculation and bear a striking resemblance to the ideal Krogh tissue cylinder. The visualization of microvessels and their regional contribution to oxygen delivery establishes penetrating arterioles as major oxygen sources in addition to the capillary network and confirms the existence of cortical oxygen fields with steep microregional oxygen gradients. Thus, two-photon NADH imaging can be applied to expose vascular supply regions and to localize functionally relevant microregional cortical hypoxia with micrometer spatial resolution.
Keywords: Krogh cylinder, microregional hypoxia, NADH, oxygen diffusion, penetrating arterioles, vascular supply regions
Introduction
A fundamental impediment to the current investigation of cortical function is the uncertain causality between changes in neural activity, cerebral blood flow, and tissue oxygenation under nonactivated and activated conditions (Raichle and Mintun, 2006). Thus, the physiological purpose that leads to the highly conserved response of increased cerebral blood flow to focally stimulated brain tissue (Roy and Sherrington, 1890) remains an enigma. Nevertheless, many contemporary neuroimaging studies rely exclusively on localizing the hemodynamic response. Although the total amount of oxygen transported to the brain exceeds the total consumed oxygen by a factor of ∼2.5 (Buchweitz et al, 1980), oxygen is distributed from the vasculature to the brain parenchyma solely by diffusion, with uncertainties regarding the functional relevance of perivascular tissue oxygen gradients (Thews, 1960a; Ndubuizu and LaManna, 2007) and oxygen diffusion times (Masamoto et al, 2007) for neurometabolic (Thompson et al, 2003; Masamoto et al, 2003) and neurovascular coupling (Buxton and Frank, 1997; Vafaee and Gjedde, 2000; Mintun et al, 2001; Gjedde, 2002).
A direct experimental observation of tissue oxygen diffusion from the cortical microcirculation could expose the actual geometry of cortical vascular supply regions (Fletcher, 1978; Wang and Bassingthwaigthe, 2001), provide clarification for this mismatch between oxygen supply and demand, and further assist in the interpretation of functional neuroimaging studies. Such observations are not feasible using conventional polarographic oxygen measurements because the exact three-dimensional origin of the measurement with respect to the diffusion boundary is unknown and further because of uncertainties regarding their spatial resolution (Connelly, 1957).
The intracellular coenzyme nicotinamide adenine dinucleotide (NADH) has long been used as an intrinsically fluorescent indicator for cellular metabolic states and tissue oxygen supply in vivo (Chance et al, 1962), and it was more recently shown that two-photon NADH imaging enables high-resolution imaging and spectroscopy of metabolic transitions and hypoxia in hippocampal tissue slices (Kasischke et al, 2004; Vishwasrao et al, 2005) and mouse cortex (Takano et al, 2007). In this study, we resolve well-defined tissue boundaries of NADH fluorescence in the mouse cortex and their strong geometric association with the regional microcirculation. We provide a biophysical interpretation of the observed NADH patterns as observable boundaries of tissue oxygen diffusion. This enables the visualization of cortical vascular supply regions and the localization of functionally relevant microregional cortical hypoxia with micrometer spatial resolution.
Materials and methods
Mice, Physiological Monitoring, Cranial Window Surgery
All experiments were approved by the University Committee on Animal Resources of the University of Rochester Medical Center. We used C57/Bl6 mice (Jackson Laboratory, Bar Harbor, ME, USA), FVB-Ntac mice (Taconic Farms, Germantown, NY, USA) and transgenic mice (B6-Tg(Eno2-YFP/Cox8a)1819R21Rwb/J) with neuron-specific expression of mitochondrially targeted yellow fluorescent protein (YFP) under control of the neuron-specific enolase2 (Eno2) promoter (Misgeld et al, 2007). All mice were used at age 10 to 12 weeks. C57Bl6 and Eno2-YFP/Cox8a mice were anesthetized with isoflurane (1% to 1.5%) and ventilated through a facemask. FVB mice were anesthetized with ketamine (0.12 mg/g intraperitoneally) and xylazine (0.01 mg/g intraperitoneally) and ventilated through a tracheostomy using a small animal ventilator (SAR-830, CWE Inc., Woodland Hills, CA, USA) set at 100 breaths/min with a tidal volume of 0.3 to 0.4 mL. The body temperature was maintained using a water-flow heating pad (TP-500, Gaymar, Orchard Park, NY, USA) and a temperature controller (ACT1000, WPI Inc., Sarasota, FL, USA). The femoral artery was cannulated for measurements of systemic blood pressure (BLPR2/SYS-BP1, WPI Inc.) and blood gases (Ciba-Corning 238, GMI Inc., Ramsey, MN, USA). Blood gases in our mice were pO2=108±8 mm Hg, pCO2=33±5 mm Hg, and pH=7.32±0.03 (average±s.d., n=6). Optical access to the cortex was provided through a parietal craniectomy (diameter 3 to 4 mm centered at bregma −0.5 mm, lateral 3 mm). A metal plate was glued to the skull, the dura mater removed, and artificial cerebrospinal fluid containing (in mmol/L) 126 NaCl, 2.5 KCl, 1.25 NaH2PO4, 2 MgCl2, 2 CaCl2, 10 glucose, and 26 NaHCO3, pH 7.4, was applied. The window was covered with 2% agarose dissolved in artificial cerebrospinal fluid at 37°C and a 0.17-mm glass coverslip. For the purpose of two-photon microangiographies the femoral vein was injected with Texas-Red-dextran (MW 70 kDa, D1830, Invitrogen, Carlsbad, CA, USA).
Bright Field Imaging of the Pial Vasculature
Cranial window-prepared mice were mounted on the microscope stage. The cortex was illuminated with white light using a fiber optic illuminator (DC-950-Fiber-Lite, Dolan-Jenner, Boxborough, MA, USA). Bright field images of the cortex were captured using a CMOS camera (Moticam 1000, Motic, Xiamen, China) at × 4 NA 0.13 air objective (Olympus, Tokyo, Japan; UPlanFLN) and a × 10 NA 0.45 (Zeiss C-Apochromat, Oberkochen, Germany) water-immersion objective. Pial arterioles and venules were identified by direction of blood flow, color, and branching pattern.
Two-Photon Imaging of Nicotinamide Adenine Dinucleotide and the Microcirculation
We used an Olympus Fluoview1000-AOM or Fluoview300 multiphoton imaging system with femtosecond Ti:Sa lasers as excitation sources (Spectra-Physics MaiTai or MaiTaiHP Deep See). For imaging, we used × 10 NA 0.45 (Zeiss C-Apochromat), × 20 NA 0.95 (Olympus XLUMPlan F), or × 25 NA 1.05 (Olympus XLPlan N) water-immersion objectives. Images were taken at 12-bit depth at a resolution of 512 × 512 pixels with a pixel dwell time of 2 microseconds. The NADH and Texas-Red-dextran were two-photon excited at 710 nm, YFP at 900 nm. Fluorescence was separated from the excitation light using a dichroic mirror/near-IR-blocking filter combination (FF665-Di01; FF01-680/SP, Semrock, Rochester, NY, USA) divided into two channels using a dichroic mirror (505DCXRU, Chroma, Rockingham, VT, USA), and bandpass filtered (NADH—Semrock FF460/80, YFP—Chroma 535/30ET, Texas-Red-dextran—Semrock FF607/36). All optical bandpass filters are specified according to the manufacturer's convention ‘center wavelength/filter bandwidth'. Two-photon microangiographies were taken from the pial surface down to layer IV using 1 μm z-steps. Concurrent two-photon imaging of NADH and the vasculature was performed at imaging depths ranging from 50 to 200 μm. The laser power after the objective was kept below 10 mW. To conduct four-color imaging of neurons, astrocytes, microvessels, and NADH in the cortex, we used transgenic mice with expression of YFP in a subset of cortical neurons (Jackson Labs, B6.Cg-TgN(Thy1-YFPH)2Jrs). We labeled astrocytes in these mice by topically application of the astrocyte-specific dye sulforhodamine 101 (5 μmol/L in artificial cerebrospinal fluid, Sigma S7635, St Louis, MO, USA), and labeled the blood serum by injecting red fluorescent (655 nm) water-soluble quantum dots (Invitrogen, Q21021MP) into the femoral vein.
Whisker Stimulation, Hypoxemia, Electrophysiology, Measurement of Tissue Oxygen, and Cerebral Blood Flow
We induced neural activity in the barrel cortex with electrical whisker stimulation using repeated 5 Hz trains, with a duration of 20 seconds separated by a 2-minute interval during an 8-minute period. Pulses (1.2 mA, 0.3 milliseconds) were generated using a stimulator/isolation unit (Master8/ISO-Flex, AMPI, Jerusalem, Israel) and applied through two insulated electrodes (E363/1, Plastics One, Roanoke, VA, USA) placed against the lower posterior quadrant of the whisker field. Extracellular recordings of the local field potential and the DC potential were obtained through patch pipettes (TW150F-4, WPI) with a tip diameter of 2 to 3 μm. The electrodes were filled with artificial cerebrospinal fluid and placed in the imaging plane in cortical layer I at a depth of 50 to 100 μm. The local field potential signals were amplified using an Axopatch 200B amplifier (Axon Instruments, Sunnyvale, CA, USA), bandpass filtered at 1 to 100 Hz, and digitized at 20 kHz (Digidata 1320, Axon Instruments). For measurement of cerebral blood flow, we used a laser Doppler system, with a 1-mm needle probe (BLF21, Transonic Systems Inc., Ithaca, NY, USA) that was placed above the barrel cortex. For direct oxygen measurements in layer I, we used customized Clark-type electrodes, with a fast response time and a 3 to 4 μm tip diameter (Unisense A/S, Aarhus, Denmark). These oxygen electrodes were calibrated before each experiment in saline equilibrated with room air (21% O2) and a solution of ascorbate in NaOH (0% O2). Experimental hypoxemia was induced by lowering the oxygen concentration in the inspired air from 21% to 10% for a period of 120 seconds.
Fluorescence Spectroscopy
Intrinsic fluorescence from cortical layer I was two-photon excited at 710 nm, focused into a 1-mm diameter multimode fiber and coupled into a cooled spectrometer (BWT1112E, B&W-Tek Inc. Newark, DE, USA). Reference spectra of purified ß-NADH (Sigma, N9410-15VL) in aqueous solution and bound to mitochondrial malate-dehydrogenase (Worthington Biochemical Corp., Lakewood, NJ, USA) were taken at 340 nm excitation using a Cary Eclipse fluorescence spectrometer (Varian Inc., Palo Alto, CA, USA).
Image Processing and Visualization
We performed image analysis using Matlab (MathWorks Inc., Natick, MA, USA). Thus, we digitally registered bright field images of the pial vasculature with the corresponding two-photon microangiographies. We then followed the arterial or venous vascular trees until they branched into capillaries and digitally pseudocolored them. For three-dimensional reconstructions of the Texas-Red-dextran labeled cerebral vasculature, we intensity adjusted the z-stacks, Fourier filtered, and visualized them using maximum intensity projections. We restricted image analysis to averaging subsequent images with calculation of the mean and the s.d. for each pixel, and normalizing the 12-bit pixel intensities of the Fluoview1000 images to a continuous gray-intensity scale ranging from 0 to 1.
Curve Fitting and Statistical Analysis
We used OriginPro 8 (OriginLab, Northampton, MA, USA) software to create graphs, for curve fitting, and statistical testing. We measured NADH tissue fluorescence (% of baseline) as a function of tissue pO2 (mm Hg). In Figure 1D, we show a fit of the sigmoidal Boltzmann function,
to these measurements. We performed hypothesis testing using independent, two-sample t-tests with an α-level of 0.01. We tested the normality of the sample distribution of our data with the Shapiro–Wilk test, and we determined the equality of the sample variances with Levene's test. We report experimental error as±s.d.
Figure 1.

Intrinsic fluorescence from the mouse cortex reports nicotinamide adenine dinucleotide (NADH) and increases steeply at very low oxygen levels. (A) Schematic of the combined two-photon imaging and spectroscopy setup used to acquire the images, spectroscopy, and oxygen measurements from mouse cortical layer I. (B) The intrinsic tissue fluorescence exhibits a well-defined, solitary emission spectrum (black plot, avg.±s.d., n=6) when two-photon excited at 710 nm. This spectrum lies bounded between the spectra of free NADH (red plot) and protein-bound NADH (blue plot). (C) To determine the relationship between NADH fluorescence and tissue oxygenation, we concurrently imaged NADH fluorescence (red plot) and directly measured the tissue oxygenation (blue plot) with Clark electrodes. We induced hypoxemia by reducing the oxygen fraction of the inspired gas mixture from 21% to 0% at a rate of ∼16% over 10 seconds. (D) When plotting NADH tissue fluorescence as a function of tissue oxygen tension (x- and y-error bars are s.d., n=3), the inverse relationship between NADH and oxygen becomes obvious. The inflection point p50=3.4±0.6 mm Hg of the sigmoidal curve fit (red line, R2=0.99) indicates the critical extracellular oxygen tension for cortical layer I.
Results
Blue Intrinsic Tissue Fluorescence Is a Specific Reporter for Nicotinamide Adenine Dinucleotide and a Sensitive Indicator of Cellular Hypoxia
We first addressed the specificity of intrinsic tissue fluorescence of the mouse somatosensory cortex as a reporter for NADH. Using a combined multiphoton imaging and spectroscopy setup (Figure 1A), we acquired fluorescence emission spectra from layer I on two-photon excitation at 710 nm. To minimize the interference from hemoglobin absorption, we took the spectra from tissue volumes that were free of large blood vessels. The bounded position of the intrinsic fluorescence spectrum (Figure 1B, black plot, avg.±s.d from six mice) between the spectrum of free, aqueous NADH (Figure 1B, red plot) and the blue-shifted spectrum of NADH bound to mitochondrial malate-dehydrogenase (Figure 1B, blue plot) shows that intracellular NADH in the neocortex exists in equilibrium between free and protein-bound molecules, in analogy to the hippocampal neuropil (Vishwasrao et al, 2005). The strong congruity of the spectra depicted in Figure 1B establishes that intrinsic signal is essentially pure pyridine nucleotide fluorescence with spectrally indistinguishable fractions from NADH and nicotinamide adenine dinucleotide phosphate (NADPH). As NADH contributes ∼86% and NADPH contributes only ∼14% to the total tissue concentrations of the reduced pyridine nucleotides in the mouse cortex (Klaidman et al, 1995), the intrinsic tissue fluorescence can be interpreted as predominately representing NADH and thus as a specific reporter for neural energy metabolism.
As the next step, we calibrated the NADH fluorescence intensity in layer I as a function of tissue oxygenation by concurrent NADH imaging and Clark electrode oxygen measurements during experimentally induced hypoxemia (Figure 1C). Controlled hypoxemia was induced by gradual reduction of the oxygen concentration in the ventilated gas mixture from 21% to 0%. The inverse relationship between NADH fluorescence and oxygen becomes obvious when plotting the tissue fluorescence as a function of the extracellular oxygen tension (Figure 1D). The NADH fluorescence remained first unchanged, with decreasing tissue oxygen levels from 25 to 10 mm Hg and eventually exhibited an abrupt increase at extracellular tissue oxygen levels below 10 mm Hg. Our measurements of the oxygen dependence of NADH fluorescence in mouse cortex are consistent with previously published studies on mitochondrial metabolism in cultured cells. Wilson et al (1979a) reported that there is little change in intramitochondrial (NAD+/NADH) until very low oxygen tensions are reached. It was also reported that the respiratory rate is essentially independent of oxygen concentrations above 20 μM (∼12 mm Hg), which is in full agreement with the flat slope of our calibration curve between 10 and 25 mm Hg. Mathematical modeling (Wilson et al, 1979b) suggested that mitochondrial (NAD+/NADH) may still be weakly dependent on oxygen concentration at higher concentrations throughout the entire physiological range up to 200 μM (∼120 mm Hg), albeit with a slope much less than that noted below 10 mm Hg.
The red line in Figure 1D shows the fit of the sigmoidal Boltzmann function (R2=0.99) to these measurements. Using equation (1), we extracted the two asymptotes A1=193.85±30.81, A2=100.26±0.96 and the inflection point p50=3.43±0.62 mm Hg with dx=1.15±0.09. The oxygen tension p50 for half-maximum NADH fluorescence indicates loss of respiratory chain function and mitochondrial ATP production and is equivalent to the critical extracellular oxygen tension for the brain. Our estimate of the critical extracellular oxygen tension of 3.4±0.6 mm Hg is in good agreement with a previous report of critical oxygen tensions in the brain of 1 to 3 mm Hg (MacMillan and Siesjö, 1971) and also with the reported p50 for mitochondrial oxidation reduction of 2.5 mm Hg (Hull and Foster, 2001). The critical oxygen tensions stated here lie all within the broad range between 0.01 and <9 mm Hg reported in the classical literature (Chance, 1957).
Geometric Relationship Between Nicotinamide Adenine Dinucleotide Tissue Patches and the Cortical Microcirculation
At the beginning of each intravital imaging experiment, we verified the integrity of the cranial window site under bright field illumination (Figure 2A) and identified arterioles and venules using branching pattern, blood flow direction, and blood color as independent criteria. A subsequent two-photon angiography of the same area (Figure 2B) was conducted to determine the arteriolar and venous vascular trees in three dimensions.
Figure 2.

Geometric relationship between tissue regions with elevated nicotinamide adenine dinucleotide (NADH) fluorescence and cortical blood vessels. (A) The bright field image shows the intact surface and microcirculation in the pia and layer I of the mouse somatosensory cortex under the cranial window. (B) Subsequent two-photon angiography. (C) The intrinsic NADH fluorescence exhibits steep intensity gradients in regions distant to the vasculature. (D) Homogeneous distribution of neuronal mitochondria, labeled with targeted YFP (Eno2-YFP/Cox8a). (E) The superimposition of NADH fluorescence with pseudocolored arterioles (red) and venules (blue) exposes a strong geometric association of the NADH tissue gradients to the cerebral microcirculation. The yellow sketches highlight circular borders enclosing perpendicularly oriented vessels; the orange sketches highlight linear borders parallel to horizontally oriented vessels. Scale bars represent 200 μm.
The NADH fluorescence in layer I under resting conditions with 21% inspired oxygen exhibited transient tissue patches with steeply elevated NADH fluorescence, delineated by conspicuous borders with circular indentations (Figure 2C). The NADH fluorescence levels within the tissue patches were 48% to 58% elevated with respect to adjacent tissue with uniformly low NADH fluorescence. We could consistently unmask these tissue patches with short (20 seconds) episodes of mild hypoxemia that we induced by lowering the oxygen concentration in the ventilated gas mixture from 21% to 15% oxygen. Electrophysiological recordings under these conditions revealed a transient silencing of the spontaneous electrical activity with only minimal shifts of the DC potential (Supplementary Figure S1). The stability of the DC potential excludes pathological conditions like anoxic depolarization or spreading depression (Takano et al, 2007), as underlying causes for the observed NADH patches. Possible confounding effects of anesthesia were addressed by using two fundamentally different regimes (isoflurane or ketamine/xylazine). The NADH tissue patches were consistently observed under both regimens, and they did not respond to changes in anesthetic depth.
To answer the question whether the inhomogeneous NADH tissue fluorescence is related to the distribution of neuronal mitochondria in the neuropil of layer I or is an independent signal, we used transgenic mice with pan-cortical, neuron-specific expression of mitochondrially targeted YFP (Misgeld et al, 2007). These mice offer the unique opportunity to directly compare the distributions of NADH fluorescence and neuronal mitochondria in the same cortical region. In stark contrast to the described heterogeneities in the NADH tissue fluorescence, the spatial distribution of YFP fluorescence from neuronal mitochondria was homogenous, regardless of their location within the vascular bed (Figure 2D). The even distribution of neuronal mitochondria described here is consistent with a regionally uniform metabolic rate for oxygen in layer I. In contrast, the sharply delineated, dark appearance of the cortical blood vessels in both the NADH and mitochondrial YFP fluorescence images can be attributed to the high two-photon absorptivity of hemoglobin (Clay et al, 2007).
To further delineate the apparent spatial relationship between NADH tissue patches and the microcirculation, we digitally superimposed pseudocolored arterioles (red in Figure 2E) and venules (blue in Figure 2E) over the raw NADH image (grayscale, Figure 2E). The montage highlights distinct circular indentations (yellow sketches) and linear borders (orange sketches) of the NADH tissue patches. These NADH tissue patches were always located in tissue areas distant to regional blood vessels, notably at greater distances to arterioles than to venules. We further conducted four-compartment fluorescence imaging of NADH (Figure 3A), neuronal processes (Figure 3B), astrocytes (Figure 3C), and the vasculature (Figure 3D) under resting conditions, with 21% inspired oxygen to investigate whether the NADH patches were related to the distribution of cellular elements in the neuropil of layer I. However, the superimposition of all four fluorescence channels (Figure 3E) did not reveal any association of NADH patches to astrocytes or neuronal processes in layer I, whereas it confirmed their strong geometrical association with neighboring blood vessels (Figures 3F–3H). The described geometry is instantly recognizable and consistent with an underlying relationship to oxygen supply from the vascular bed. Thus, the boundaries of the tissue patches could be related to the perimeter of oxygen diffusion from neighboring microvessels. We interpreted these tissue NADH patches as hypoxic (pO2 ≤3.4 mm Hg) watershed areas and asked whether similar patterns could be observed in the physiologically activated brain.
Figure 3.

Four-compartment imaging of nicotinamide adenine dinucleotide (NADH), neuronal processes, astrocytes, and cortical blood vessels. (A) Intrinsic NADH fluorescence, (B) YFP-expressing neuronal processes, (C) sulforhodamine-stained astrocytes, (D) quantum-dot label blood vessels in layer I. (E) The merge of the four compartments (A–D) reveals no spatial relationship between the NADH tissue patches and neuronal processes or astrocytes. (F) The indentations that define the boundaries of the NADH tissue patches are indeed of circular geometry, as demonstrated in G by their close match with superimposed circles (red pseudocolor) with radii R between 18 and 39 μm. (H) The further superimposition of the microangiography (cyan pseudocolor) confirms that circular indentations that delineate NADH tissue patches are concentric, which their respective central blood vessels. Scale bars represent 100 μm.
Unmasking of the Krogh Tissue Cylinder
Focal neural activity in the barrel cortex was induced by intermittent whisker stimulation using 20 second trains at 5 Hz and validated by recording of well-described neurovascular responses in layer I (Supplementary Figure S2), specifically bursts of local field potentials, the hemodynamic response, and the previously reported (Thompson et al, 2003; Masamoto et al, 2003) biphasic change in tissue oxygenation. We applied five intermittent 20 second trains separated by 2 minute-intervals during an 8-minute period. The microregional intensity distribution of the time-averaged NADH tissue fluorescence (Figure 4A) in layer I appeared homogenous. However, we frequently observed evanescent, spatially confined NADH transients delineated by conspicuous circular borders. These microregional fluctuations emerged at various times during the stimulation period, some appeared spontaneously, whereas others were correlated with the applied stimuli. To quantitatively isolate such metabolically labile regions, we computed the s.d. for each pixel of the time series. The visualization of the s.d. (Figure 4B) reveals a distinctively geometrical tissue pattern, which is consistent with two intersecting circles. Their boundaries are defined by the visible, steep transition from low to high s.d., and they effectively separate inner regions with stable NADH fluorescence from outer regions with fluctuating NADH fluorescence. To determine the radius R of the described tissue circles, we measured their radial pixel intensity values within a well-defined segment (Figure 4C). Details of this complex measurement are provided in the Supplementary Text. We then fitted a sigmoidal function (red line in Figure 4D) to the radial intensity profile (blue symbols in Figure 4D) and used its inflection point, xo, as a definition of R. The boundaries of the two intersecting circles (yellow sketches in Figure 4E) are now objectively defined, with radii R of 43 and 68 μm, respectively. Two-photon microangiography revealed the cross-section of a solitary central blood vessel in each circle, here two arterioles (red pseudocolor in Figure 4E) with radii r of ∼6 and 13 μm, respectively.
Figure 4.

Two-photon nicotinamide adenine dinucleotide (NADH) imaging enables direct visualization of the Krogh tissue cylinder. (A) The NADH fluorescence in layer I of the barrel cortex, averaged over an 8-minute period with intermittent whisker stimulation. Note homogeneous regional intensity distribution of NADH with disseminated bright cellular elements and dark blood vessels. (B) Visualization of the s.d. (depicted in vertical scale bar on the right) of the time series distinguishes two intersecting circular tissue regions. (C) To determine their radius R, we measured the radial pixel intensity profile within a well-defined tissue segment, here bounded by two cyan lines and the red circle. The red dot marks the midpoint of the central blood vessel. (D) Graph of the radial pixel intensity profile (blue symbols). The inflection point, x0, of the fitted sigmoidal curve (red line) defines the radius R, here 68.2 μm. (E) The superimposition of the pseudocolored microangiography (arterioles in red and capillaries in pink pseudocolor) reveals that the two intersecting tissue circles (yellow sketches) have the cross-section of arterioles at their center. (F) Sketch of the Krogh cylinder as proposed in 1919 where a central blood vessel with radius r supplies a tissue cylinder with radius R with radially diffusing oxygen. Scale bars in panels A–E represent 50 μm.
The well-defined geometry of the observed tissue and vessel boundaries in Figure 4E strikingly resembles the two-dimensional projection of the ideal ‘Krogh tissue cylinder' (Krogh, 1919) as shown in the sketch in Figure 4F. The influential concept of the Krogh tissue cylinder was proposed in 1919 as a mathematical description of radial oxygen diffusion from capillaries into skeletal muscle, and it has provided the groundwork for many subsequent models of tissue oxygen supply (Thews, 1960a; Popel, 1989; Foster et al, 1991). On the basis of the strong geometrical analogy to the Krogh cylinder, we hypothesized that boundaries between tissue regions with steady and fluctuating NADH fluorescence represent the perimeter of radial oxygen diffusion from the central blood vessel into the surrounding neuropil. In this scenario, the cylindrical NADH tissue boundary is the physical equivalent of the second boundary condition of the Krogh model, which is defined as the point where the microregional tissue pO2 approximates the critical oxygen tension p50 necessary to sustain mitochondrial respiration. In this transitional zone, minute fluctuations in vascular supply or microregional tissue utilization of oxygen will lead to toggling between zero-order and first-order oxygen metabolism with oscillations between low and high NADH fluorescence levels. Consequently, the radius R of the cylindrical NADH boundary must be defined by the competition between vascular oxygen delivery through diffusion and the tissue metabolic rate for oxygen. As the next step, we adapted the Krogh model for the rodent cortex.
Adaptation of the Krogh–Erlang Model for the Rodent Cortex
The Krogh model postulates that a central capillary with radius r and infinite length supplies a concentric tissue cylinder with radius R with radially diffusing oxygen. The axi-symmetric steady-state diffusion equation for this system in cylindrical coordinates (Foster et al, 1991) is
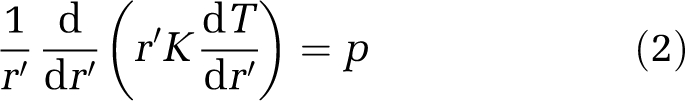 |
with the Krogh diffusion constant K, the constant rate of oxygen consumption p, and the oxygen tension T at radial distance r′ from the capillary wall. The two boundary conditions are (1) tissue oxygen equals capillary oxygen at the vessel wall and (2) metabolic flux is zero due to critically low oxygen concentration at the edge of the Krogh tissue cylinder. The solution of equation (2) is the Krogh–Erlang equation (Krogh, 1919)
 |
Here, To is the capillary oxygen tension (atm), and Tx is the tissue oxygen tension at radial distance x (cm) from the capillary center. For brain tissue, the rate of oxygen consumption p is equivalent to the product of the cerebral metabolic rate of oxygen (CMRO2) and the density ρ of brain tissue. For rat cortex (Eklöf et al, 1973)
 |
The Krogh diffusion constant K is the product of the oxygen diffusion coefficient D and the oxygen solubility α (Verduin, 1955). For rat brain at 37°C (Thews, 1960b)
 |
For the case of the second boundary condition, x=R, the simplified Krogh–Erlang equation is rearranged to afford the intravascular oxygen tension
 |
By definition, the microregional oxygen tension TR at the cylinder boundary is rate limiting. Using equation (1), we have determined that the rate limiting extracellular oxygen concentration, as displayed by the p50 for half-maximum NADH tissue fluorescence, TR, is ∼3.4 mm Hg (Figure 1D). We further substitute the numeric values for p and K and convert the original units used by Krogh for the oxygen tension and the radial distances from (atm) and (cm) to (mm Hg) and (μm)
 |
By directly imaging the central vessel radius r and the Krogh cylinder radius R in the mouse cortex (Figure 4E) and further assuming a constant metabolic rate, we can now infer the intravascular oxygen tension according to equation (7) and thus the absolute microregional tissue oxygen tension within the Krogh cylinder at any radial distance x from the vessel center according to equation (3).
A visualization of an ideal Krogh tissue cylinder according to our adaptation of the Krogh model is provided in Figure 5. The radial pO2 gradient within the cylinder (Figure 5A) is derived from equation (3). We then apply equation (1) with the previously extracted parameters A1, A2, p50, and dx as a transfer function to infer the radial NADH fluorescence intensity (Figure 5B) from the oxygen distribution. Corresponding ideal tissue pO2 and NADH fluorescence intensity maps are shown in Figures 5C and 5D. The predicted NADH fluorescence within an ideal Krogh cylinder exhibits a steep increase in the vicinity of the diffusion boundary R (Figure 5D), which is in good agreement with our experimentally observed NADH tissue cylinders.
Figure 5.

Visualization of pO2 and nicotinamide adenine dinucleotide (NADH) fluorescence within an ideal Krogh tissue cylinder. (A) Predicted radial tissue oxygen gradient in an ideal Krogh tissue cylinder with boundaries r=13 μm and R=68 μm. The variable x refers to the radial distance from the center of the cylinder. (B) By applying equation (1) as a transfer function between tissue pO2 and NADH tissue fluorescence, we can predict the ideal NADH fluorescence profile within the tissue cylinder. (C) Corresponding two-dimensional visualization of oxygen tension and (D) NADH fluorescence intensity distribution within the ideal tissue cylinder.
Capillary-Depleted Tissue Cylinders Surround Penetrating Arterioles
The NADH-bounded tissue cylinders were best defined in areas surrounding penetrating arterioles and we noted their surprisingly large radii of 54±5 μm (avg.±s.d., n=90). According to our interpretation, this implies radial oxygen diffusion distances of >50 μm, which exceeds known intercapillary diffusion distances of ≤24 μm (Thews, 1960a). In other words, the central penetrating arteriole is implied as the sole oxygen source for the entire tissue cylinder and consequently any further vessels within the tissue cylinder must be absent. To test this strong prediction, we conducted high-resolution three-dimensional reconstructions of the cerebral microvasculature encompassing cortical layers I to IV. Indeed, these reconstructions consistently revealed a complete absence of the otherwise dense cortical capillary network in the vicinity of penetrating arterioles (Figures 6A–6D) extending over several hundred micrometers along the length axis of penetrating arterioles. The first branching point of penetrating arterioles into lower-order arterioles was typically observed in cortical layer IV (Figures 6E and 6F). The radius of these capillary-depleted tissue cylinders was 53±9 μm (avg.±s.d., n=48). These vascular reconstructions unequivocally establish penetrating arterioles as major primary oxygen sources with large radial diffusion distances of >50 μm. The congruity of the capillary-depleted tissue cylinders and the periarteriolar NADH-bounded tissue cylinders further confirms our hypothesis that these geometrically delineated NADH tissue patterns can be interpreted in terms of Krogh tissue cylinders.
Figure 6.

Microangiographies reveal capillary-depleted tissue cylinders surrounding penetrating arterioles. (A–D) Maximum intensity projections of the microcirculation in the somatosensory mouse cortex consistently reveal the striking absence of the dense cortical capillary network in an elongated coaxial tissue cylinder in the vicinity of penetrating arterioles. The four shown horizontal projections were derived from four mice and range from cortical layers I to IV. Communicating and penetrating arterioles are pseudocolored in red, major venules in blue. The corresponding coronal (E) and sagittal (F) projections of the angiography stack shown in D confirm the full three-dimensional extent of the periarteriolar avascular tissue cylinder with a length of ∼350 μm until lower-order arterioles branch laterally off the penetrating arteriole. Scale bars represent 50 μm.
Diminished Vascular Supply Regions Under Hypoxemic Conditions
The Krogh model predicts that under conditions of decreased vascular oxygen supply, the tissue cylinders will be diminished in size and may eventually become isolated. This allowed us to directly test our interpretation of NADH tissue boundaries as oxygen diffusion boundaries by subjecting the mice to controlled hypoxemia. We therefore lowered the inspired oxygen concentration from 21% to 10% for a period of 2 minutes. The resulting drop of the pO2 in the femoral artery from the physiological value of 108±9 to 49±11 mm Hg (avg.±s.d., n=6 mice) is sufficient to induce moderate hypoxia (Xu and LaManna, 2006) in the cerebral cortex. As predicted, moderate hypoxia led to an increase in NADH fluorescence, which was spatially highly heterogeneous. The first changes noted were the appearance of NADH tissue patches in tissue regions distant to blood vessels. These anoxic microwatershed zones gradually expanded towards perivascular tissue regions, unmasking numerous isolated pericapillary tissue cylinders (Figure 7A). Accordingly, moderate tissue hypoxia exposed the much larger Krogh cylinder surrounding a penetrating arteriole which branches of a horizontally oriented surface arteriole (Figures 7B–7D).
Figure 7.

Heterogeneous cortical oxygenation under normoxic and hypoxemic conditions. (A) The nicotinamide adenine dinucleotide (NADH) tissue pattern under hypoxemic conditions reveals multiple isolated pericapillary tissue cylinders. (B–D) Unmasking of a large tissue cylinder surrounding a penetrating arteriole by hypoxemia. (B) Baseline NADH fluorescence under normoxic conditions. (C) NADH pattern in the same region during hypoxemia. (D) Pseudocolor visualization of hypoxemia induced NADH percent changes between panels B and C. Sketches of the regional arterioles (red), venules (blue), and capillaries (magenta) are superimposed. (E) Scatter plot of r and R for all 441 observed Krogh cylinders. (F) Broad range of tissue oxygen spans in vascular supply regions under normoxic conditions (21% inspired oxygen). (G) Reduced tissue oxygen spans in vascular supply regions during experimentally induced hypoxemia (10% inspired oxygen). (H) Average vascular oxygen tensions under normoxic and hypoxemic conditions. (I) Average tissue cylinder radius R under normoxic and hypoxemic conditions. (J) Inferred tissue oxygen gradients within the observed vascular supply regions under normoxic (colored plots) and hypoxemic (black plots) conditions. Scale bars in panels A–D represent 50 μm.
Heterogeneous Cortical Oxygenation Under Normoxic and Hypoxemic Conditions
The observed tissue and vascular geometries can now be applied to our adaptation of the Krogh model. From our total of 441 observations of the Krogh tissue cylinder radius R and the center vessel radius r (Figure 7E), the tissue oxygen span T0–TR ranging from the vessel wall to the edge of the Krogh cylinder within a given vascular supply region can be derived according to equation (6). The broad oxygen spans inferred from our observations (Figure 7F) under normoxic conditions are in general agreement with the regional distribution of our direct polarographic oxygen measurements in layer I (Supplementary Figure S3) and with previous oxygen measurements (Ndubuizu and LaManna, 2007). However, we cannot directly relate polarographic measurements to inferred oxygen gradients because the exact three-dimensional location of the electrode tip with respect to nearby microvessels is unknown. Thus, direct electrode measurements cannot be assigned to a specific vascular supply region with certainty. A further assignment to a defined position within a given vascular supply region seem even more problematic, especially when considering the uncertainties regarding the sensitive volume of oxygen electrodes.
With TR ∼3.4 mm Hg, equation (7) yields average vascular oxygen tensions of 94±18 mm Hg (s.d.) for arterioles, 28±11 mm Hg for capillaries, and 38±13 mm Hg for venules in cortical layer I under normoxic conditions (Figure 7H, top). We can further determine the average diffusion distances for each vessel type (Figure 7I). Our numbers are in good agreement with direct measurements of surface (Vovenko, 1999) and perivascular (Duling et al, 1979) oxygen tensions of arterioles, venules, and capillaries in the mammalian brain. We observed capillary oxygen levels slightly below venous oxygen tension as has been reported previously (Vovenko, 1999). Possible explanations could be the existence of arterio-venous shunting in the cortical circulation or more likely a selection bias caused by the masking of pericapillary NADH gradients because of highly overlapping capillary oxygen supply regions in well-oxygenated tissue volumes (Wang and Bassingthwaigthe, 2001).
Using our model, we can provide a quantitative description of the complex changes in cortical oxygenation between normoxia (Pa2 108±9 mm Hg) and moderate cortical hypoxia (Pa2 49±11 mm Hg). We observed a considerable reduction of tissue oxygen spans (compare Figures 7F and 7G) and a drop of vascular pO2 to 45±16 mm Hg (avg.±s.d.) in arterioles, 10±5 mm Hg in capillaries, and 10±6 mm Hg in venules (Figure 7H). The drop of the inferred vascular pO2 reached unambiguous significance levels (P≪0.001) with high statistical power (>0.99) for all three vessel types. We can further quantify the radial shrinkage of vascular supply regions (Figure 7I) and diminished tissue oxygen gradients (Figure 7J). Notably, complete tissue cylinders with diameters of ∼60 to 100 μm surrounding penetrating arterioles remain adequately oxygenated under hypoxemic conditions. This is illustrated in the example shown in Figure 7D. An implication with possible clinical relevance is that significant periarteriolar cortex volumes are not directly affected by moderate cortical hypoxia.
Discussion
We describe well-defined cylindrical patterns of NADH tissue fluorescence in the mouse cortex and their close spatial association with the regional microcirculation. We propose that the observed NADH tissue boundaries provide the physical representation of tissue boundaries of oxygen diffusion from the cortical microcirculation. Our interpretation further implies that we can expose cortical vascular supply regions, localize functionally relevant microregional cortical hypoxia and infer microregional cortical oxygenation with cubic micron spatial resolution. Such three-dimensional spatially resolved observations are not feasible with existing methodologies.
Interpretation of Cylindrical Nicotinamide Adenine Dinucleotide Tissue Patterns as Oxygen Diffusion Boundaries
Our experimental observations that NADH tissue boundaries exhibit a well-defined cylindrical geometry and enclose a coaxial central blood vessel are independent of any theory, model, or assumption. The probability that such distinct vascular and tissue geometries emerge by chance is infinitely small and their strong resemblance to the ideal Krogh tissue cylinder implies an underlying relationship to tissue oxygen diffusion. This relationship is further validated by the congruity of NADH-bounded tissue cylinders and capillary-depleted tissue cylinders surrounding penetrating arterioles and by the exposure of diminished vascular supply regions under hypoxemic conditions.
An important consideration is that elevated NADH tissue fluorescence could also be explained by metabolic state 4, a condition that is characterized by low ADP levels as a result of decreased energy demand (Chance and Williams, 1955). The reason is that both metabolic states 4 and 5 (rate limiting hypoxia) are characterized by high levels of NADH. However, state 4 is aerobic, whereas state 5 is anaerobic. Thus, tissue in state 4 would not exhibit the cylindrical geometry of an oxygen diffusion boundary observed in our experiments.
Advantages and Limitations of Our Approach
The Krogh model is a steady-state model and does not afford a measure of cerebral blood flow. The NADH-bounded tissue cylinders will be observed under any condition where the local pO2 is close to p50, regardless of the underlying factors contributing to this oxygenation status. Thus, although our imaging approach allows us to resolve microregional hypoxia with cubic micron resolution, it does not afford direct information on the nature of the underlying physiological or pathophysiological condition.
An inherent advantage of our approach is the fact that the localization of oxygen diffusion boundaries is solely based on the direct recognition of cylindrical NADH tissue boundaries in our images and is therefore independent of any assumptions regarding the metabolic rate p and the diffusion constant K. Accordingly, our estimate of the oxygen level p50 at the diffusion boundary R depends only on the experimentally derived calibration curve shown in Figure 1D and its analysis using equation (1), regardless of p and K. In contrast, our estimates of the pO2 in the central blood vessel and the surrounding tissue oxygen gradients are derived from the Krogh–Erlang equation (3) and are therefore linearly dependent on the assumed values for the metabolic rate p and the diffusion constant K.
The simple, ideal Krogh model is directly applicable to the special case of the penetrating arterioles, with unilateral blood flow in parallel, linear vessels that are depleted of surrounding capillaries. Obviously, the Krogh model has limitations for primarily capillary networks with convoluted and asymmetric perfusion (Krogh, 1919; Fletcher, 1978). The concern is that capillary domains, which are a descriptive measure of capillary spacing, and associated capillary supply regions are not congruent (Wang and Bassingthwaigthe, 2001). Thus, a more uniform oxygen distribution would be expected, challenging the wide span of tissue oxygen levels as predicted by the Krogh model. However, refined mathematical descriptions with objectively measured vascular geometries and flow relationships are frequently beyond analytical solutions and have not yet afforded a significantly improved correlation with experimental measurements (Thews, 1960a; Fletcher, 1978; Mintun et al, 2001). Indeed, numerous studies confirm highly nonuniform oxygen distribution in the cortex, and it has been suggested that microregional oxygen gradients provide a more appropriate representation of the actual cortical oxygenation in contrast to regionally averaged oxygen tensions (Ndubuizu and LaManna, 2007).
High-resolution optical imaging of all forms is constrained by the optical properties (absorption and scattering) of tissue. Although the near infrared two-photon excitation can penetrate to depths corresponding to layer IV, the blue/green NADH fluorescence originating at this depth is rapidly attenuated by scattering and the intense absorption of hemoglobin at these wavelengths. This difficulty is amplified by the low two-photon absorption cross-section of NADH (0.07 GM at 710 nm), which is 1/100 to 1/1000 the magnitude of conventional fluorophores (Kasischke et al, 2004). For these reasons, it appears fundamentally impossible to image NADH fluorescence in the deeper cortical layers.
Direct Arteriolar Contribution to Cortical Oxygen Supply
We have established that the arteriolar system is largely responsible for the heterogeneous oxygen distribution and even shapes the capillary distribution in the cortex. Most prominently, penetrating arterioles, which are perfectly positioned to regulate the delivery of blood to cortical columns (Nishimura et al, 2007), are the exclusive oxygen source for capillary-depleted coaxial tissue cylinders with diameters well above 100 μm and which extend from cortical layers I to IV.
The persistence of physiologically adequate periarteriolar oxygen gradients during experimentally induced moderate cortical hypoxia in our experiments may further explain the distinct distribution of microstrokes in autoradiographic and histological studies of ischemic (Welsh et al, 1977) or hypoxemic (Pulsinelli and Duffy, 1979) mammalian cortex. In these studies, investigators noted sparing of the region surrounding penetrating arterioles, and hypothesized that persistence of periarteriolar tissue oxygen gradients in the hypoxic brain might account for this, which is confirmed by our data. The pathophysiological relevance of perivascular tissue oxygen gradients was further substantiated in clinically more relevant stroke models, where focal cerebral ischemia in primates preferentially affected neurons distant from their neighboring microvessels (Mabuchi et al, 2005).
Possible Physiological Relevance of Microregional Tissue Hypoxia in the Cortex
Our results support the notion that a significant fraction of cortical neurons exist normally in a low oxygen environment (Gjedde, 2002; Ndubuizu and LaManna, 2007). Under such conditions, cortical oxygenation must be closely regulated within the limits of normal brain function and any focal increase in the cerebral metabolic rate or a reduction in vascular oxygen supply would inevitably increase the likelihood of hypoxia in cortical watershed regions. Microregional tissue hypoxia would also contribute to elevated lactate levels in the focally stimulated brain (Prichard et al, 1991; Sappey-Marinier et al, 1992). In this context, our results raise the question whether the watershed areas observed under our cranial window preparations are physiological phenomena and may further be related to the natural function of the cerebrovascular control system.
For example, the possibility that mitochondria sense a declining oxygen tension and directly or indirectly trigger a blood flow increase (Gjedde, 2002) is in agreement with recent studies that have posited a regulatory role for the redox state of neural cells on cerebral blood flow (Ido et al, 2004; Vlassenko et al, 2006). The cellular redox state is determined by the cytosolic NADH/NAD+ ratio, which exists in near-equilibrium with the intracellular lactate/pyruvate ratio. Thus, the proposed mechanism is that increased cytosolic NADH will increase the electron transfer from NADH to oxidized enzymes in signaling pathways that activate constitutive nitric oxide synthase to increase cerebral blood flow. Under hypoxic conditions, cytosolic NADH will be maximally elevated because of increased anaerobic glycolysis and cessation of its reoxidation to NAD+ by mitochondrial electron shuttling. In this scenario, microregional tissue patches with elevated NADH levels would activate signaling cascades, which increase cerebral blood flow with a subsequent increase in microregional tissue oxygen levels, ultimately linking tissue metabolic states to the hemodynamic response.
Future applications of concurrent two-photon fluorescence imaging of endogenous NADH and the cortical microcirculation may allow for the inclusive investigation of neurometabolic and neurovascular coupling and expose the role of inadequate or restricted tissue oxygen supply in neurovascular diseases and the aging brain.
The authors declare no conflict of interest.
Footnotes
Supplementary Information accompanies the paper on the Journal of Cerebral Blood Flow & Metabolism website (http://www.nature.com/jcbfm)
This study was supported by the DANA foundation (Brain and Immunoimaging Program), the American Heart Association (0635595T), the ALS Association (#1112), NIH-NINDS (NS38073, NS50315), and NIH-NCI (CA68409).
Supplementary Material
References
- Buchweitz E, Shina AK, Weiss HR. Cerebral oxygen consumption and supply in anesthetized cat. Science. 1980;209:499–501. doi: 10.1126/science.7394515. [DOI] [PubMed] [Google Scholar]
- Buxton RB, Frank LR. A model for the coupling between cerebral blood flow and oxygen metabolism during neural stimulation. J Cereb Blood Flow Metab. 1997;17:64–72. doi: 10.1097/00004647-199701000-00009. [DOI] [PubMed] [Google Scholar]
- Chance B. Cellular oxygen requirements. Fed Proc. 1957;16:671–680. [PubMed] [Google Scholar]
- Chance B, Cohen P, Jobsis F, Schoener B. Intracellular oxidation-reduction states in vivo. Science. 1962;137:499–507. doi: 10.1126/science.137.3529.499. [DOI] [PubMed] [Google Scholar]
- Chance B, Williams GR. Respiratory enzymes in oxidative phosphorylation. III. The steady state. J Biol Chem. 1955;217:409–427. [PubMed] [Google Scholar]
- Clay GO, Schaffer CB, Kleinfeld D. Large two-photon absorptivity of hemoglobin in the infrared range of 780–880 nm. J Chem Phys. 2007;126:025102. doi: 10.1063/1.2404678. [DOI] [PubMed] [Google Scholar]
- Connelly CM. Methods for measuring tissue oxygen tension: theory and evaluation: the oxygen electrode. Fed Proc. 1957;16:681–684. [PubMed] [Google Scholar]
- Duling BR, Kuschinsky W, Wahl M. Measurements of the perivascular pO2 in the vicinity of the pial vessels of the cat. Pflügers Arch. 1979;383:29–34. doi: 10.1007/BF00584471. [DOI] [PubMed] [Google Scholar]
- Eklöf B, Lassen NA, Nilsson L, Norberg K, Siesjö BK. Blood flow and metabolic rate for oxygen in the cerebral cortex of the rat. Acta Physiol Scand. 1973;88:587–589. doi: 10.1111/j.1748-1716.1973.tb05489.x. [DOI] [PubMed] [Google Scholar]
- Fletcher JE. Mathematical modeling of the microcirculation. Math Biosci. 1978;38:159–202. [Google Scholar]
- Foster TH, Murant RS, Bryant RG, Knox RS, Gibson SL, Hilf R. Oxygen consumption and diffusion effects in photodynamic therapy. Radiat Res. 1991;126:296–303. doi: 10.2307/3577919. [DOI] [PubMed] [Google Scholar]
- Gjedde A. Cerebral blood flow change in arterial hypoxemia is consistent with negligible oxygen tension in brain mitochondria. Neuroimage. 2002;17:1876–1881. doi: 10.1006/nimg.2002.1272. [DOI] [PubMed] [Google Scholar]
- Hull EL, Foster TH. Cytochrome spectroscopy in scattering suspensions containing mitochondria and red blood cells. Appl Spectr. 2001;55:149–154. [Google Scholar]
- Ido Y, Chang K, Williamson JR. NADH augments blood flow in physiologically activated retina and visual cortex. Proc Natl Acad Sci USA. 2004;101:653–658. doi: 10.1073/pnas.0307458100. [DOI] [PMC free article] [PubMed] [Google Scholar]
- Kasischke KA, Vishwasrao HD, Fisher PJ, Zipfel WR, Webb WW. Neural activity triggers neuronal oxidative metabolism followed by astrocytic glycolysis. Science. 2004;305:99–103. doi: 10.1126/science.1096485. [DOI] [PubMed] [Google Scholar]
- Klaidman LK, Leung AC, Adams JD. High-performance liquid chromatography analysis of oxidized and reduced pyridine dinuleotides in specific brain regions. Anal Biochem. 1995;228:312–317. doi: 10.1006/abio.1995.1356. [DOI] [PubMed] [Google Scholar]
- Krogh A. The number and distribution of capillaries in muscles with calculations of the oxygen pressure head necessary for supplying the tissue. J Physiol. 1919;52:409–415. doi: 10.1113/jphysiol.1919.sp001839. [DOI] [PMC free article] [PubMed] [Google Scholar]
- Mabuchi T, Lucerno J, Feng A, Koziol JA, Zoppo GJ. Focal cerebral ischemia preferentially affects neurons from their neighboring microvessles. J Cereb Blood Flow Metab. 2005;25:257–266. doi: 10.1038/sj.jcbfm.9600027. [DOI] [PubMed] [Google Scholar]
- MacMillan V, Siesjö BK. Critical oxygen tensions in the brain. Acta Physiol Scand. 1971;82:412–414. doi: 10.1111/j.1748-1716.1971.tb04983.x. [DOI] [PubMed] [Google Scholar]
- Masamoto K, Kershaw J, Ureshi M, Takizawa N, Kobayashi H, Tanashita K, Kanno I. Apparent diffusion time of oxygen from blood to tissue in rat cerebral cortex: implication for tissue oxygen dynamics during brain functions. J Appl Physiol. 2007;103:1352–1358. doi: 10.1152/japplphysiol.01433.2006. [DOI] [PubMed] [Google Scholar]
- Masamoto K, Omura T, Takizawa N, Kobayashi H, Katura T, Maki A, Kawaguchi H, Tanashita K. Biphasic changes in tissue partial pressure of oxygen closely related to localized neural activity in guinea pig auditory cortex. J Cereb Blood Flow Metab. 2003;23:1075–1084. doi: 10.1097/01.WCB.0000084248.20114.B3. [DOI] [PubMed] [Google Scholar]
- Mintun MA, Lundstrom BN, Snyder AZ, Vlassenko AG, Shulman GL, Raichle ME. Blood flow and oxygen delivery to human brain during functional activity: theoretical modeling and experimental data. Proc Natl Acad Sci USA. 2001;98:6859–6864. doi: 10.1073/pnas.111164398. [DOI] [PMC free article] [PubMed] [Google Scholar]
- Misgeld T, Kerschensteiner M, Bareyre FM, Burgess RW, Lichtman JW. Imaging axonal transport of mitochondria in vivo. Nat Methods. 2007;4:559–561. doi: 10.1038/nmeth1055. [DOI] [PubMed] [Google Scholar]
- Ndubuizu O, LaManna JC. Brain tissue oxygen concentration measurements. Antiox Redox Signal. 2007;9:1–13. doi: 10.1089/ars.2007.1634. [DOI] [PubMed] [Google Scholar]
- Nishimura N, Schaffer CB, Friedman B, Lyden PD, Kleinfeld D. Penetrating arterioles are a bottleneck in the perfusion of neocortex. Proc Natl Acad Sci USA. 2007;104:365–370. doi: 10.1073/pnas.0609551104. [DOI] [PMC free article] [PubMed] [Google Scholar]
- Popel AS. Theory of oxygen transport to tissue. Crit Rev Biomed Eng. 1989;17:257–321. [PMC free article] [PubMed] [Google Scholar]
- Prichard J, Rothman D, Novotny E, Petroff O, Kuwabara T, Avison M, Howseman A, Hanstock C, Shulman R. Lactate rise detected by 1H NMR in human visual cortex during physiologic stimulation. Proc Natl Acad Sci USA. 1991;88:5829–5831. doi: 10.1073/pnas.88.13.5829. [DOI] [PMC free article] [PubMed] [Google Scholar]
- Pulsinelli WA, Duffy TE. Local cerebral glucose metabolism during controlled hypoxemia in rats. Science. 1979;204:626–628. doi: 10.1126/science.432667. [DOI] [PubMed] [Google Scholar]
- Raichle ME, Mintun MA. Brain work and brain imaging. Annu Rev Neurosci. 2006;29:449–476. doi: 10.1146/annurev.neuro.29.051605.112819. [DOI] [PubMed] [Google Scholar]
- Roy CW, Sherrington CS. On the regulation of the blood supply of the brain. J Physiol. 1890;1:85–108. doi: 10.1113/jphysiol.1890.sp000321. [DOI] [PMC free article] [PubMed] [Google Scholar]
- Sappey-Marinier D, Calabrese G, Fein G, Hugg JW, Biggins C, Weiner MW. Effect of photic stimulation on human visual cortex lactate and phosphates using 1H and 31P magnetic resonance spectroscopy. J Cereb Blood Flow Metab. 1992;12:584–592. doi: 10.1038/jcbfm.1992.82. [DOI] [PubMed] [Google Scholar]
- Takano T, Tian G-F, Peng W, Lou N, Lovatt D, Hansen AJ, Kasischke KA, Nedergaard M. Cortical spreading depression causes and coincides with tissue hypoxia. Nat Neurosci. 2007;9:260–267. doi: 10.1038/nn1902. [DOI] [PubMed] [Google Scholar]
- Thews G. Die Sauerstoffdiffusion im Gehirn (Oxygen diffusion in brain) Pflügers Arch. 1960a;271:197–226. [Google Scholar]
- Thews G. Ein Verfahren zur Bestimmung des O2-Diffusionskoeffizienten, der O2-Leitfähigkeit und des O2-Löslichkeitskoeffizienten im Hirngewebe (A method for the determination of the O2-diffusion coefficient, the O2-conductivity, and the O2-solubility coefficient in brain tissue) Pflügers Arch. 1960b;271:227–244. [PubMed] [Google Scholar]
- Thompson JK, Peterson MR, Freeman RD. Single-neuron activity and tissue oxygenation in the cerebral cortex. Science. 2003;299:1070–1072. doi: 10.1126/science.1079220. [DOI] [PubMed] [Google Scholar]
- Vafaee MS, Gjedde A. Model of blood-brain transfer of oxygen explains nonlinear flow-metabolism coupling during stimulation of visual cortex. J Cereb Blood Flow Metab. 2000;20:747–754. doi: 10.1097/00004647-200004000-00012. [DOI] [PubMed] [Google Scholar]
- Verduin J.1955Diffusion constant and diffusion coefficient Science 12121513237974 [Google Scholar]
- Vishwasrao HD, Heikal AA, Kasischke KA, Webb WW. Conformational dependence of intracellular NADH on metabolic state revealed by associated fluorescence anisotropy. J Biol Chem. 2005;280:25119–25126. doi: 10.1074/jbc.M502475200. [DOI] [PubMed] [Google Scholar]
- Vlassenko AG, Rundle MM, Raichle ME, Mintun MA. Regulation of blood flow in activated human brain by cytosolic NADH/NAD+ ratio. Proc Natl Acad Sci USA. 2006;103:1964–1969. doi: 10.1073/pnas.0510632103. [DOI] [PMC free article] [PubMed] [Google Scholar]
- Vovenko E. Distribution of oxygen tension on the surface of arterioles, capillaries and venules of brain cortex and in tissue in normoxia: an experimental study on rats. Pflügers Arch. 1999;437:617–623. doi: 10.1007/s004240050825. [DOI] [PubMed] [Google Scholar]
- Wang CY, Bassingthwaigthe J. Capillary supply regions. Math Biosci. 2001;173:103–114. doi: 10.1016/s0025-5564(01)00074-8. [DOI] [PMC free article] [PubMed] [Google Scholar]
- Welsh FA, O'Connor MJ, Langfitt TW. Regions of cerebral ischemia located by pyridine nucleotide fluorescence. Science. 1977;198:951–953. doi: 10.1126/science.201026. [DOI] [PubMed] [Google Scholar]
- Wilson DF, Erecińska M, Drown C, Silver IA. The oxygen dependence of cellular energy metabolism. Arch Biochem Biophys. 1979a;195:485–493. doi: 10.1016/0003-9861(79)90375-8. [DOI] [PubMed] [Google Scholar]
- Wilson DF, Owen CS, Erecińska M. Quantitative dependence of mitochondrial oxidative phosphorylation on oxygen concentration: a mathematical model. Arch Biochem Biophys. 1979b;195:494–504. doi: 10.1016/0003-9861(79)90376-x. [DOI] [PubMed] [Google Scholar]
- Xu K, LaManna JC. Chronic hypoxia and the cerebral circulation. J Appl Physiol. 2006;100:725–735. doi: 10.1152/japplphysiol.00940.2005. [DOI] [PubMed] [Google Scholar]
Associated Data
This section collects any data citations, data availability statements, or supplementary materials included in this article.