Abstract
mCherry is a red fluorescent protein which is bright, photostable, and has a low molecular weight. It is an attractive choice for multiphoton fluorescence imaging; however, the multiphoton excitation spectrum of mCherry is not known. In this paper we report the two photon excitation spectrum of mCherry measured up to 1190 nm in the near infrared (NIR) region. Skin tissues of transgenic mice that express mCherry were used in the experiments. mCherry in the tissues was excited with a Titanium: Sapphire laser and an optical parametric oscillator pumped by the Titanium:Sapphire laser. We found that the peak excitation of mCherry occurs at 1160 nm.
Keywords: mCherry, Multiphoton, Optical parametric oscillator, Excitation peak
Introduction
Fluorescent proteins are naturally occurring or engineered proteins that are widely used as markers in biology and biotechnology. Since the discovery of Green Fluorescent Protein (GFP) in the early 1960’s [1] considerable effort has been made to generate a complete palette of fluorescent proteins in the visible spectrum [2–7]. Apart from the requirement for red fluorescent markers in multicolor imaging, the red region of the visible spectrum deserves special attention because longer wavelength photons are scattered less by tissue. The quest for a red fluorescent marker has led to the extraction of natural proteins like DsRed, red proteins modified from DsRed like mCherry [6], and modified far-red proteins like Katushka [7]. mCherry is a red fluorescent protein from the so-called fruit series which is bright, photostable, has a smaller molecular weight compared to other red proteins such as mStrawberry and tdTomato and has little spectral emission overlap with GFP and YFP [8]. Recently, we developed an endothelial reporter mouse line Tg(Flk1::myr-mCherry) which contains a construct which produces the red fluorescent protein mCherry [9]. mCherry is expressed in the embryonic endothelium, endocardium, and in small blood vessels in adult animals. mCherry has a single photon excitation peak at 587 nm and an emission peak at 610 nm [7].
Fluorescent proteins have become very important in intravital imaging in which a time-lapse approach is used to record changes in cellular behavior and morphology in vivo in animal models. Stable lines of transgenic animals are generated with cell or tissue-specific expression of fluorescent proteins, obviating the need to deliver dyes into the animal. For these experiments, Two photon or Multiphoton microscopy is often used. Two photon microscopy is superior to single photon microscopy because the excitation events are localized to the focal plane. Consequently, optical sectioning is enhanced while photobleaching and phototoxicity are considerably reduced [11]. Since multiphoton excitation occurs in a restricted focal volume, a detector pinhole is not required. Hence, fluorescence photons that follow both ballistic and scattered trajectories can be captured to create an image using non-descanned detectors. Multiphoton laser scanning microscopy was made possible after the advent of mode-locked lasers which produce short intense pulses that boost the probability of multiphoton absorption events [11]. These lasers are broadly tunable from 680 – 1080 nm and can be used to excite a wide range of fluorophores. Thus, Titanium: Sapphire lasers have emerged as the most widely used lasers for multiphoton excitation [11, 12] and have been used to measure the two photon excitation spectra of several fluorescent markers [10, 12].
The tuning range of the Titanium:Sapphire laser can be extended using an OPO. Optical parametric generation is fundamentally different from light amplification by stimulated emission that occurs in a laser. In an OPO, the nonlinear response of a nonlinear crystal generates two parametric waves of lower frequencies than the pump laser frequency such that energy is conserved. The phase matching condition ensures that the resulting signal beam has a unique wavelength. In OPOs that use a periodically poled nonlinear crystal, the output wavelength can be tuned by changing the length of the OPO cavity electronically.
mCherry is an attractive marker for multiphoton imaging; nevertheless, the multiphoton excitation spectrum of mCherry is not known. First using a Ti:Sapphire laser and then an Optical Parametric Oscillator (OPO) pumped by a Titanium:Sapphire laser we have determined the optimum excitation peak for mCherry via multiphoton excitation. We found that the major excitation peak is beyond the range of the Ti:Sapphire laser, with an increasing trend even at 1080 nm. By extending the range of the Ti:Sapphire with the OPO we were able to detect a peak excitation for mCherry at 1160 nm.
Experimental
Tg(Flk1::myr-mCherry) homozygous male mice were crossed to CD1 females. The neonates from a litter were euthanized and pieces of their skin were carefully removed. The extracted pieces were spread out on glass slides with the outer surface of the skin samples facing the slides. Glass cover slips were placed on the exposed surfaces of the samples. All animal protocols were approved by the Institutional Animal Care and Use Committee (IACUC) at Baylor College of Medicine.
mCherry was excited using a tunable Chameleon Titanium:Sapphire laser (Coherent Laser Group, Santa Clara, California) and imaged using a Zeiss Axioskop 2FS upright microscope, mounted with a modified LSM DuoScan system with IR optics and a direct coupling port. Using an IR-improved prototype 32×/0.85 Numerical Aperture (NA) W objective lens from Carl Zeiss (Carl Zeiss Microimaging, Inc., Thornwood, New York), attenuated power at the stage was measured using a PM100 power meter with an S130A sensor (Thorlabs, Newton, New Jersey). Power was then adjusted for each desired wavelength, using a polarized half wave plate (HWP), such that the power at the sample would be constant at 16±1 mW. Finally, the sample was prepared as described earlier, images were obtained at each wavelength, and pixel intensities were averaged for each full-field image; this process was repeated for multiple fields of view. To pool data from different fields of view, fluorescence intensities at each wavelength were normalized to the intensity measured at 1000 nm.
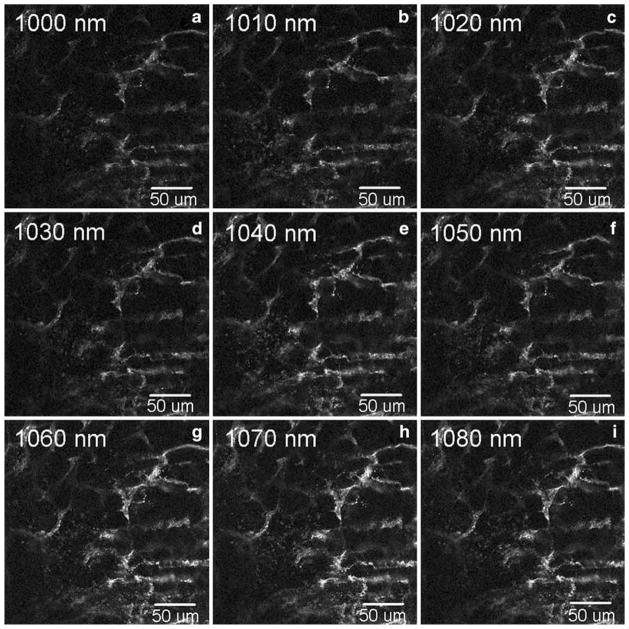
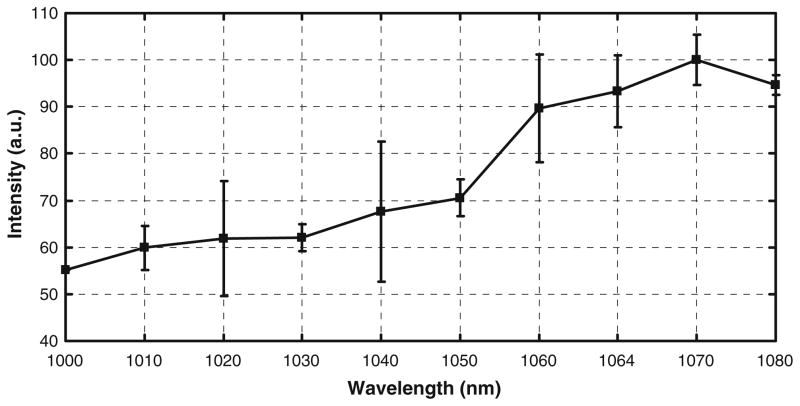
Representative fluorescent images of tissue expressing mCherry are shown at different excitation wavelengths in Fig. 1, and the measured fluorescence intensity of mCherry is plotted against excitation wavelength in Fig. 2. The data show that within this range, the fluorescence intensity of mCherry continually increases as the excitation wavelength increases. The difference in the intensity values at 1070 nm and 1080 nm was not statistically significant (Wilcoxon rank sum test), suggesting that the excitation peak may lie beyond this range. So we next measured the spectrum beyond 1080 nm. Since the Titanium:Sapphire laser cannot be used beyond 1080 nm, we used an OPO pumped by the Titanium:Sapphire laser to measure the spectrum beyond 1080 nm in the NIR. First, we measured the power and pulse width of the laser beam produced by the OPO. Then, we used the OPO to measure the spectrum of mCherry in the range from 1120 nm to 1190 nm. The 40 nm gap in the spectrum between 1080 nm and 1120 nm is beyond the operable range of the OPO, so it was not possible to collect data continuously through the spectrum.
Fig. 1.
Shown are representative images of skin tissue collected from Tg(Flk1::myr-mCherry) mice and excited with a Ti:Sapphire laser at various two-photon excitation wavelengths. An IR-improved prototype objective lens from Carl Zeiss (32×/0.85 NA W) was used as the objective
Fig. 2.
Normalized fluorescence intensity of mCherry is plotted against two-photon excitation wavelengths in the range from 1000 nm to 1080 nm
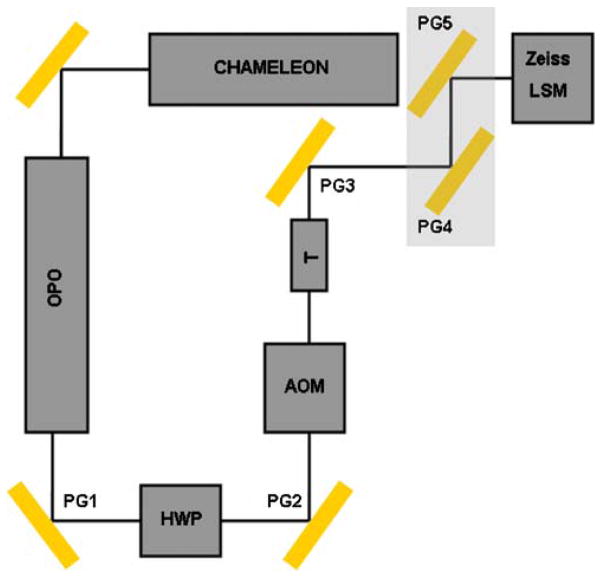
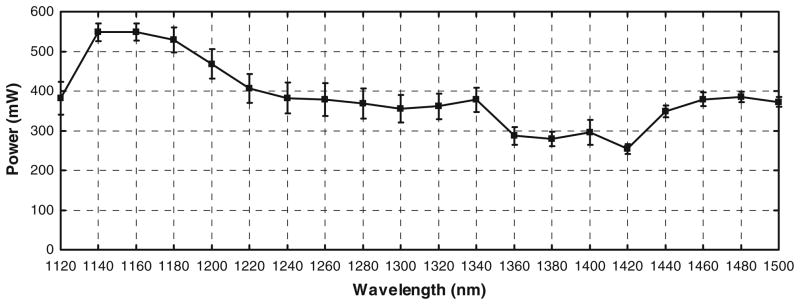
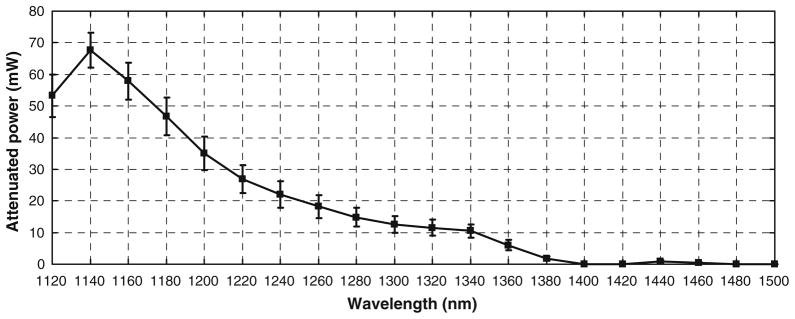
A schematic of the OPO setup used in the experiments is shown in Fig. 3. The output power of the OPO was measured using a power meter (S212A, Thermopile Sensor, Thorlabs). The power was measured on fifteen different days over a 3 week period and the average power was calculated. The average power at the output of the OPO is shown in Fig. 4. Similarly, the average power at the specimen was measured using the power meter with an IR-improved prototype objective lens from Carl Zeiss (32×/0.85 NA W). The measurements were taken on eight different days over a fifteen day period. The average attenuated power at the specimen is shown in Fig. 5.
Fig. 3.
The output from a Titanium:Sapphire laser (Chameleon, Coherent Laser Group, Santa Clara, California) was reflected using a silver mirror to enter an OPO (Mira OPO, Coherent Laser Group, Santa Clara, California). The output of the OPO was reflected using a Protected Gold (PG1) mirror (Thorlabs). A polarized half wave plate (HWP) was used to adjust the power of the laser beam. The beam that exited the HWP was reflected by PG2 to enter a modified acousto-optic modulator (AOM). The AOM was modified to block the beam when the laser scanning microscope (LSM) is not scanning. The crystal in the AOM was removed so that the beam is just blocked by the shutter when the LSM is not scanning. The telescope, T was used to reduce the beam waist before it entered the LSM scan head after being reflected by PG3, PG4, and PG5. The mirrors PG3, PG4, and PG5 were adjusted such that the laser beam filled the back aperture of the objective lens and the power at the specimen was maximum. The beam was aligned using a 633 nm laser line as the reference
Fig. 4.
The power at the output of the OPO between PG1 and HWP was measured using a power meter (S212A, Thermopile Sensor, Thorlabs). The power was measured on fifteen different days and averaged over the number of days
Fig. 5.
The attenuated power at the specimen was measured using a power meter (S212A, Thermopile Sensor, Thorlabs). The power was measured on eight different days and averaged over the number of days. An IR-improved prototype objective lens from Carl Zeiss (32×/0.85 NA W) was used as the objective
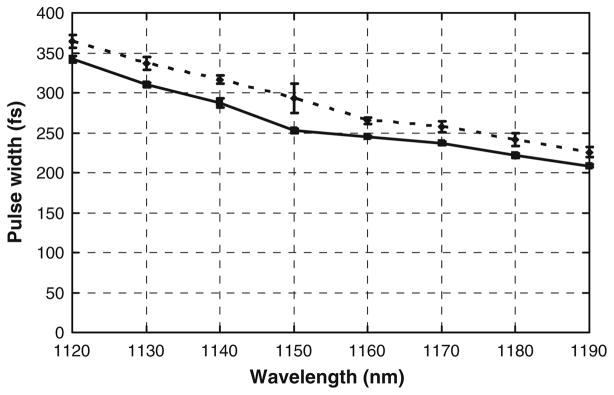
The pulse width of the laser beam immediately after the telescope was measured using a Carpe autocorrelator (APE GmbH, Berlin). The output wavelength of the laser beam was changed by electronically tuning the OPO and the power at the specimen was kept constant by adjusting the transmission through the HWP. The actual pulsewidth was measured by fitting a sech2 distribution to the intensity autocorrelation function of the beam using the PulseCheck software (APE GmbH, Berlin). The mean pulse width for different wavelengths is shown in Fig. 6.
Fig. 6.
The mean pulse width of the laser beam immediately after the telescope was measured using a Carpe autocorrelator. The average power at the specimen was 20 mW for the solid line and 27 mW for the dotted line. The change in the pulse width in the range from 1120 nm to 1150 nm and from 1150 nm to 1190 nm was less than 100 fs
The excitation spectrum of mCherry in the range from 1120 nm to 1190 nm was determined as described below. The mounted tissue prepared as described earlier was carefully positioned on the microscope stage. A few drops of distilled water were placed on the cover slip and the objective position was electronically adjusted to focus on the blood vessels marked by mCherry. It was not possible to keep the power at the sample constant for the entire range from 1120 nm to 1190 nm. So we had to split the range from 1120 nm to 1190 nm into two sets of wavelengths. The excitation lambda stack was collected as described below. The spectral range was divided into two sets- from 1120 nm to 1150 nm and from 1150 nm to 1190 nm. For a given set of wavelengths, a cycle of measurements included the following three steps: first, the attenuated power at the specimen was measured for each wavelength, then, the images were taken at each wavelength, and finally, the power at the specimen was measured again for each wavelength. The output power at the specimen was measured before and after each cycle of measurements to make sure that the power was constant at the specimen. The amplitudes of power fluctuations were less than 10% of the average power at the specimen. The cycle of measurements was repeated several times. In each cycle, the images were taken in a different sequence of wavelengths so as not to bias any wavelength. The power at the specimen was kept constant by adjusting the transmission of the HWP for each wavelength.
The Zeiss confocal images were analyzed using a MATLAB program to measure the average intensity of the mCherry signal in each image. The image analysis was performed as described below. A polynomial algorithm was used to subtract the background in each image [13]. All the pixels in an image whose intensity was greater than an arbitrarily chosen threshold, was defined as a signal pixel. The average intensity of mCherry in an image was defined as the sum of the intensities of the signal pixels divided by the number of signal pixels. The same threshold was applied to all the images used in the calculation of the spectrum. The data for the spectral range 1120 nm to 1150 nm was based on seven measurements. The average power at the specimen was 30±2 mW. The data for the range 1150 nm to 1190 nm was based on ten measurements. The average power at the specimen was 29±2 mW for the measurements. For each cycle of measurements, the intensity value was normalized. The normalized intensity values were averaged over different cycles of measurements to get the average intensities of a set of wavelengths. The average intensities of two sets of wavelengths were scaled using 1150 nm as the reference wavelength to generate the two photon excitation spectrum of mCherry.
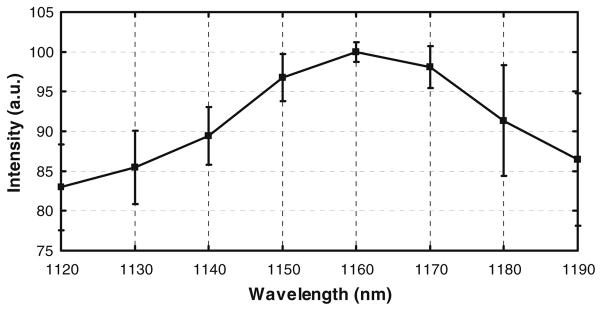
Figure 7 shows mCherry excited from blood vessels in the skin of neonates when excited with the OPO. The excitation spectrum of mCherry is shown in Fig. 8. The peak intensity of the mCherry excitation in the range from 1120 nm to 1190 nm occurs at 1160 nm. The peak at 1160 nm is not an artifact due to enhanced average power at the specimen or due to a reduced pulse width.
Fig. 7.
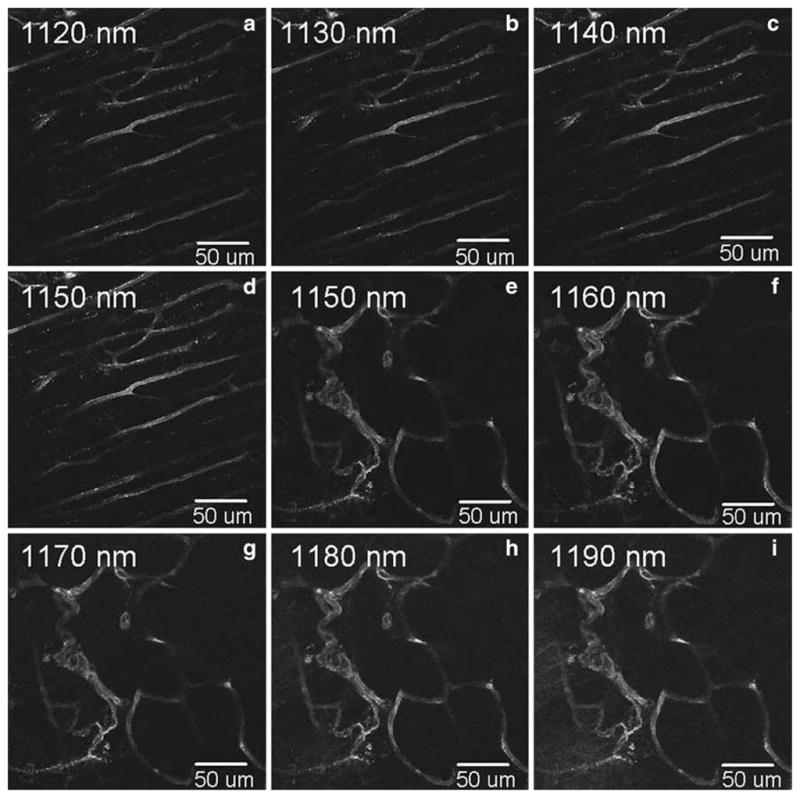
Excitation fingerprinting of mCherry using an OPO pumped by a Titanium:Sapphire laser. The images were taken in two sets from 1120 nm to 1150 nm in steps of 10 nm, and from 1150 nm to 1190 nm in steps of 10 nm. An IR-improved prototype objective lens from Carl Zeiss (32×/0.85 NA W) was used as the objective. The mCherry signal was collected using an HQ620/60 m-2p filter (Chroma Technology Corp.)
Fig. 8.
Normalized excitation spectrum of mCherry in the range from 1120 nm to 1190 nm. mCherry in the tissue was excited with an OPO pumped by a Titanium:Sapphire laser
While it is reasonable to argue that longer wavelength near IR lights penetrate deeper into the tissue, we did not observe a significant difference in the imaging depth using 1000 nm compared with 1160 nm. This is most likely because the useful imaging depth that can be achieved with a two-photon microscope is limited by poor axial resolution due to aberrations induced by the tissue [14]. Thus, as has been discussed previously, adaptive optics approaches may be more effective at improving imaging depth than shifting to longer wavelengths [14].
In general, the two photon excitation spectrum of a fluorophore is not a scaled version of its single photon excitation spectrum [15]. The two photon absorption results in electronic transitions between energy levels that are not accessible by single photon absorption. Hence, the quantum mechanical selection rules for the transitions between the energy states are different from those of the single photon excitation events. Typically, the two photon excitation spectrum of a fluorophore has broad peaks, and the excitation peak does not coincide with twice the value of the single photon excitation peak [10, 12]. The two photon excitation spectrum of mCherry in the range from 1000 nm to 1080 nm tends to increase beyond 1080 nm and the spectrum in the range from 1120 nm to 1190 nm has a peak at 1160 nm. The peak in the spectrum is blue shifted by 14 nm with respect to the scaled single photon excitation peak at 1174 nm. The 40 nm gap between 1080 nm and 1120 nm is beyond the operable range of the Titanium: Sapphire laser and the OPO.
Conclusion
In this paper, we determined the two photon excitation spectrum of mCherry using a Titanium:Sapphire laser and an OPO pumped by the Titanium:Sapphire laser. According to our measurements, the two photon excitation spectrum of mCherry has a peak at 1160 nm. The peak is blue shifted by 14 nm with respect to twice the single photon excitation peak which is a striking feature of the two photon spectra of most of the fluorescent dyes [10]. The results reported here will be used to optimize deep tissue imaging of the vital fluorescent protein mCherry with two photon microscopy and demonstrate the usefulness of mulitphoton excitation using an OPO for maximum excitation of red fluorescent proteins.
Acknowledgments
This work was supported by the RO1 grant (R01 HL 077187), Quantum grant (NIH-NIBIB P20 EB007076), NIH training grant (T32 HL007676), and a training fellowship from the Nanobiology Training Program of the Keck Center of the Gulf Coast Consortia (R90DK071504). The authors would like to thank Marco Arrigoni (Coherent Inc., California, USA) for sharing the OPO and Darren Chomiak (Coherent Inc., California, USA) for helpful discussions.
Contributor Information
Tegy J. Vadakkan, Email: vadakkan@bcm.edu, Department of Molecular Physiology and Biophysics, Baylor College of Medicine, Houston, TX 77030, USA
James C. Culver, Department of Molecular Physiology and Biophysics, Baylor College of Medicine, Houston, TX 77030, USA
Liang Gao, Department of Bioengineering, Rice University, Houston, TX 77005, USA.
Tiemo Anhut, Carl Zeiss MicroImaging GmbH, Carl-Zeiss-Promenade 10, 07745 Jena, Germany.
Mary E. Dickinson, Department of Molecular Physiology and Biophysics, Baylor College of Medicine, Houston, TX 77030, USA
References
- 1.Shimomura O, Johnson FH, Saiga Y. Extraction, purification and properties of Aeqorin, a bioluminescent protein from the luminous hydromedusan, Aequorea. J Cell Comp Physiol. 1962;59:223–229. doi: 10.1002/jcp.1030590302. [DOI] [PubMed] [Google Scholar]
- 2.Nagai T, Ibata K, Park ES, Kubota M, Mikoshiba K, Miyawaki A. A variant of yellow fluorescent protein with fast and efficient maturation for cell-biological applications. Nat Biotechnol. 2002;20:87–90. doi: 10.1038/nbt0102-87. [DOI] [PubMed] [Google Scholar]
- 3.Fraser ST, Hadjantonakis AK, Sahr KE, Willey S, Kelly OG, Jones EA, Dickinson ME, Baron MH. Using a histone yellow fluorescent protein fusion for tagging and tracking endothelial cells in ES cells and mice. Genesis. 2005;42:162–171. doi: 10.1002/gene.20139. [DOI] [PMC free article] [PubMed] [Google Scholar]
- 4.Rizzo MA, Springer HG, Granada B, Piston DW. An improved cyan fluorescent protein variant useful for FRET. Nat Biotechnol. 2004;22:445–449. doi: 10.1038/nbt945. [DOI] [PubMed] [Google Scholar]
- 5.Patterson GH, Lippincott-Schwartz J. Selective photolabeling of proteins using photoactivatable GFP. Methods. 2004;32:445–450. doi: 10.1016/j.ymeth.2003.10.006. [DOI] [PubMed] [Google Scholar]
- 6.Shaner NC, Campell RE, Steinbach PA, Giepmans BNG, Palmer AE, Tsien RY. Improved monomeric red, orange and yellow fluorescent proteins derived from Discosoma sp. red fluorescent protein. Nat Biotechnol. 2004;22:1567–1572. doi: 10.1038/nbt1037. [DOI] [PubMed] [Google Scholar]
- 7.Shcherbo D, Merzlyak EM, Chepurnykh TV, Fradkov AF, Ermakova GV, Solovieva EA, Lukyanov KA, Bogdanova EA, Zaraisky AG, Lukyanov S, Chudakov DM. Bright far-red fluorescent protein for whole-body imaging. Nature Methods. 2007;4:741–746. doi: 10.1038/nmeth1083. [DOI] [PubMed] [Google Scholar]
- 8.Shaner NC, Steinbach PA, Tsien RY. Nature Methods. 2005;12:905–909. doi: 10.1038/nmeth819. [DOI] [PubMed] [Google Scholar]
- 9.Larina V, Shen W, Kelly OG, Hadjantonakis AK, Baron MH, Dickinson ME. A membrane associated mCherry fluorescent reporter line for studying vascular remodeling and cardiac function during murine embryonic development. Anat Rec. 2009;292:333–341. doi: 10.1002/ar.20821. [DOI] [PMC free article] [PubMed] [Google Scholar]
- 10.Bestvater F, Spiess E, Stobrawa G, Hacker M, Feurer T, Porwol T, Berchner-Pfannschmidt U, Wotzlaw C, Acker H. Two-photon fluorescence absorption and emission spectra of dyes relevant for cell imaging. J Microsc. 2002;208:108–115. doi: 10.1046/j.1365-2818.2002.01074.x. [DOI] [PubMed] [Google Scholar]
- 11.Denk W, Svoboda K. Photon upmanship: Why multiphoton imaging is more than a gimmick. Neuron. 1997;18:351–357. doi: 10.1016/s0896-6273(00)81237-4. [DOI] [PubMed] [Google Scholar]
- 12.Dickinson ME, Simbuerger E, Zimmermann B, Waters CW, Fraser SE. Multiphoton excitation spectra in biological samples. J Biomed Opt. 2003;8:329–338. doi: 10.1117/1.1583734. [DOI] [PubMed] [Google Scholar]
- 13.Russ JC. The image processing handbook. 4. CRC Press; Boca Raton, FL: 2002. [Google Scholar]
- 14.Girkin JM, Poland S, Wright AJ. Curr Op Biotech. Vol. 20. 2009. Adaptive optics for deeper imaging of biological samples; pp. 106–110. [DOI] [PubMed] [Google Scholar]
- 15.Oheim M, Michael MDJ, Geisbauer M, Madsen D, Chow RH. Principles of two-photon excitation fluorescence microscopy and other nonlinear imaging approaches. Advanced Drug Delivery Reviews. 2006;58:788–808. doi: 10.1016/j.addr.2006.07.005. [DOI] [PubMed] [Google Scholar]


