Abstract
Tyrosine kinase inhibitors (TKIs) targeting angiogenesis via inhibition of the vascular endothelial growth factor (VEGF) pathway have changed the medical management of metastatic renal cell carcinoma. While the treatment with TKIs has demonstrated clinical benefit these drugs will eventually fail patients. The potential mechanisms of resistance to TKIs are poorly understood. To address this question we obtained an excisional biopsy of a skin metastasis from a patient with clear cell renal carcinoma who initially had a response on sunitinib and eventually progressed on therapy. Tumor pieces were grafted subcutaneously in athymic nude mice. Established xenografts were treated with sunitinib. Tumor size, microvascular density and pericyte coverage were determined. Plasma as well as tissue levels for sunitinib were assessed. A tumor derived cell line was established and assessed in vitro for a potential direct antitumor effects of sunitinib. To our surprise, xenografts from the patient who progressed on sunitinib regained sensitivity to the drug. At a dose of 40 mg/kg sunitinib caused regression of the subcutaneous tumors. Histology showed a marked reduction in microvascular density and pericyte dysfunction. More interestingly, histological examination of the original skin metastasis revealed evidence of epithelial-to-mesenchymal-transition while the xenografts showed reversion to the clear cell phenotype. In vitro studies showed no inhibitory effect on tumor cell growth at pharmacologically relevant concentrations. In conclusion, the histological examination in this xenograft study suggests that reversible epithelial-to mesenchymal-transition may be associated with acquired tumor resistance to TKIs in patients with clear cell renal carcinoma.
Keywords: Vascular endothelial growth factor, angiogenesis inhibitors, resistance, renal cell carcinoma
Introduction
Following the approval of the tyrosine kinase inhibitors sorafenib and sunitinib by the Food and Drug Administration, the treatment paradigm for metastatic renal cell carcinoma has significantly changed (1). Until few years ago, immunotherapies such as interferon alpha and interleukin 2 (IL-2) were the only treatment options for metastatic renal cell carcinoma. Cytokine therapies are typically associated with flu-like side effect and high dose IL-2 administration requires inpatient admission with intensive monitoring because of the severe toxicities. The observed objective response rate for high dose IL-2 is 15–20%. However, in a small number of patients durable responses are observed (1).
Receptor tyrosine kinase inhibitors such as sunitinib and sorafenib have a relatively broad spectrum of targets (2). Their clinical efficacy in renal cell carcinoma is thought to be primarily due to inhibition of angiogenesis related receptor kinases such as the vascular endothelial growth factor receptors (VEGFR) and the platelet derived growth factor receptor (PDGFR)(3, 4). Clear cell renal cell carcinoma is known for the commonly high expression of the potent proangiogenic vascular endothelial growth factor (VEGF). This is due to the frequently deleted, mutated or epigenetically silenced von-Hippel-Lindau (VHL) gene which leads to the constitutively high expression of hypoxia inducible factor 1 alpha (HIF1α)(5). HIF1α is a transcription factor involved in cell adaption to hypoxic conditions that induce the expression of VEGF and PDGF and consequently the stimulation of new blood vessel growth (6).
In clinical studies, sorafenib and sunitinb have shown a prolongation of progression-free survival (PFS) in cytokine pretreated and untreated patients, respectively (7, 8). The final results of a large randomized phase III study comparing sunitinib with interferon alpha as first line treatment has shown a significant improvement in PFS, a greater overall survival, and a ~40% objective response rate (8). Despite this success, renal cell carcinomas treated with sunitinib will eventually develop resistance and progress. The mechanism of resistance remains unclear. Hypotheses include the presence of compensatory changes in blood vessel composition, the increased production of additional proangiogenic growth factors, increased pericyte coverage, accumulation of bone marrow derived cells and tumor cell resistance to direct cytotoxic effects (9). In the attempt of addressing this important clinical question we have established a primary xenograft model from a patient who had initial response to sunitinib but eventually progressed and developed new metastatic lesions to the skin. We characterized this model with regards to its histology, HIF1α expression, and baseline angiogenesis and most importantly to its sensitivity to TKIs.
Materials and Methods
Reagents and cell culture
The human renal cell carcinoma cell lines RCC1.11 and RCC1.18 were kindly provided by Dr. Elisabeth Jaffe (Johns Hopkins University, Baltimore, MD). These cell lines were established from primary renal cell tumors. HS27a, an immortalized bone marrow stromal cell line, was obtained from ATCC. These cells were grown in RPMI 1640 media supplemented with 10% FCS, penicillin and streptomycin. The cell line IH23.1 was derived from the patient’s skin tumors and maintained in DMEM with 20% FCS, penicillin and streptomycin. All cell lines were maintained at 37°C in a 5% CO2 and 95% air incubator.
Western blot analysis
Western blots were carried out on 4% to 15% gradient polyacrylamide gels according to methods previously described (10). The anti-HIF1α antibody was obtained from R&D Systems (Minneapolis, MN).
Generation and characterization of a xenograft cell line
A tumor cell line (IH23.1) from the primary xenograft was derived by allowing tumor fragments to attach to plastic and by supporting growth in high serum conditions. Outgrowing cells were serially passaged and stained positive with a pan-cytokeratin Ab (Sigma) for human epithelial origin (data not shown). For Western blot analysis, cell lysates of IH23.1 cells growing under normoxic conditions or exposed to 100 μM CoCl2 for 6 hours to mimic hypoxia, were used. HS27a cells, an HPV immortalized fibroblast cell line, served as positive control for inducible HIF-1α.
Establishment of primary xenografts and sunitinib treatment
The patient was consented to an IRB approved protocol for an excisional biopsy of his metastatic skin lesions. Part of the tumor tissue was fixed in formalin for H&E and immunohistochemistry. The rest was snap frozen for protein and RNA studies and in part cut into 3×3×3 mm pieces for subcutaneous implantation in athymic nude mice (F1). The animal research protocol was approved by the Johns Hopkins University Animal Use and Care Committee and animals were maintained in accordance to guidelines of the American Association of Laboratory Animal Care. 6-week-old male athymic nude mice were purchased from the NCI (Frederick) and housed under pathogen-free conditions. When the carcinoma reached a size of 1,500 mm3, they were excised, cut into into 3 × 3 × 3 mm fragments, and transplanted into new cohort of mice for expansion and eventual drug studies. Drug studies were performed on F4 and F5 generation of primary xenografts. Tumor growth was assessed twice weekly by using caliper, and the size was expressed in mm3 using the standard formula: length × (width)2 × 0.52. Before starting the treatment, mice were divided in homogenous groups (8–9 per group) according to tumor burden determined by size. Treatment-related toxicity was determined by mouse weights weekly. Tumor weights were determined when mice were sacrificed at the end of the study.
Sunitinib malate (generously provided by Pfizer) was dissolved in a vehicle containing carboxymethylcellulose (0.5%), NaCl (1.8%), Tween80 (0.4%), Benzylalcohol (0.9%) and distilled water (pH adjusted to 6.0). Sunitinib malate was dispersed at a concentration of 10.4 mg/ml (8 mg/ml free base). The mixture was sonicated to achieve a stable dispersion. Animals were dosed as indicated, typically at 40 mg/kg once daily, five days a week, by oral gavage. In the prevention model, treatment was initiated when tumors were still small at around 30 days of implantation. In the intervention model, larger more established tumors were allowed to form before treatment started around day 60.
Histology and Immunohistochemistry
For the CD31 staining, zinc-fixed, paraffin-embedded tissue was generated from each tumor to quantify differences in microvessel density (MVD) between control and experimental groups. Sections were incubated (18 h at 4°C) with anti-CD31 antibody (Pharmingen), a specific marker for endothelial cells after deparaffinization. Sections were incubated with a secondary biotin-conjugated rabbit anti-goat IgG antibody (1:100) for 30 min at room temperature. Sections were incubated with avidin-biotin peroxidase complex (Vector Laboratories) as per manufacturer’s instructions. Sections were then incubated with 3,3′-diaminobenzidine solution, washed, and counterstained with methyl green. H&E stained slides were obtained from all formalin fixed tissues. Immunostaining for Cytokeratin AE1/3, and Vimentin was done on XT-Benchmark autostainers (Ventana Medical Systems, Tucson, AZ). Briefly, deparaffinization and hydration of 5um thick sections was followed by heat induced antigen retrieval performed with EDTA buffer (pH 9.0). Primary antibody incubation was followed by I-View detection (Ventana Medical Systems, Tucson, AZ). The reaction was developed using substrate 3,3′-Diamino-benzidine hydrochloride (DAB). All Slides were counterstained with hematoxylin. All antibodies were supplied as predilute by Ventana Medical Systems, Tucson, AZ. Slides were scanned with the Aperio Imaging system and Tiff files were generated with manufacturer’s software (Imagescope). Immunostaining for E-Cadherin and CAIX) paraffin sections are cut at 5μm, placed on charged slides and dried in a 60°C oven for 1 hour. Room temperature slides are then deparaffinized in three changes of Xylene and rehydrated using graded alcohols. Endogenous peroxidase is quenched with aqueous 3% H2O2 for 10 minutes and washed with PBS/T. Antigen retrieval is performed in the microwave in pH 6.0 citrate buffer for 2 × 10 min (E-Cad.) and for 1 × 10 min ( CAIX), with a 15 min. cool down followed by a PBS/T wash. Slides are then loaded on the DAKO autostainer and the following program is run: Casein 0.03% [in PBS/T] is used to block for 30 minutes, blown off, and the primary antibody [E-Cadherin – Novacastra @ 1/50; CAIX - Santa Cruz 1/50] is applied to slides for one-hour. A PBS/T wash is followed by Envision+ reagent (Dako) for 30 min. PBS/T was used as a wash and the chromagen DAB+ is applied for 10 minutes (color reaction product - brown). The slides are then counterstained with Hematoxylin, and dehydrated, cleared and coverslipped. HIF-1α (Novus Biologicals) staining procedure uses a multi level detection system with amplification.
Qualitative assessment of pericyte coverage
Cardiac perfusion of the xenograft bearing animals was performed as published by Dr. Donald McDonald’s group (11). Briefly, mice were anesthetized with a lethal amount of ketamine/xylazine. The chest was opened rapidly and a small incision was made into the apex of the left ventricle. A blunt needle was introduced into the left ventricle, carefully advanced into the root of the aorta and clamped into place. The right and left atrium was removed by blunt force. Then the mouse was initially perfused at around 120 mmHg with PBS until clearance of blood and then perfused with a freshly made 1% PFA/PBS solution for 5 min. The tumors were then excised, fixed for another hour at room temperature in 1% PFA and infiltrated with 30% sucrose for 3–5 days. Tissues were the embedded in OCT and cut into 30 and 100 um sections on a Leica Cryostat. Sections were initially blocked with PBS containing 5% goat serum and 0.3% Triton X-100. Primary antibodies against CD31 (BD Pharmingen) and Desmin (Millipore) were used at a 1: 500 and 1:1000 dilution and incubated overnight in the above mentioned buffer at 4 degrees Celsius. Secondary antibodies (goat, Invitrogen) labeled with Alexa 488 and 546 were used. The thick sections served for detailed confocal analysis and 3D reconstruction purposes (Zeiss LSM 510). Pictures were analyzed using the ImageJ software (NIH).
Generation and characterization of a xenograft cell line
A cell line of the primary xenograft was derived by allowing tumor fragments to attach to plastic and by supporting growth in high serum conditions. Outgrowing cells were serially passaged and stained positive with a pan-cytokeratin Ab (Sigma) for human epithelial origin (data not shown). For Western blots, cell lysates of IH23.1 cells growing under normoxic conditions or exposed to 100 μM CoCl2 for 6 hours to mimic hypoxia, were used. HS27a cells, an HPV immortalized fibroblast cell line, served as positive control for inducible HIF1α.
Long-term exposure in vitro assay
To assess for time dependent, direct growth inhibitory effect of sunitinib on renal cell carcinoma cell lines, we employed a variant of colony formation assay in which cells were continuously exposed to the drug for up to two weeks. All cell cultures were performed in RPMI with 10% FBS. Exponentially growing tumor cells were seeded at 500 cells per 60 mm tissue culture dishes in triplicates. The cells were allowed to attach for 24 h and subsequently exposed to sunitinb at the mentioned concentration with DMSO never exceeding 0.05%. The cells were treated for 14 days with change of media and the addition of fresh drug after 7 days. At the end of treatment, the media was removed, the culture dishes washed once with PBS and subsequently fix-stained with Crystalviolet/10% ethanol. The culture dishes were destained and pictures were acquired on a Kodak 440 imaging system. The amount of crystal violet positive pixels for each well was determined by using the ImageJ software.
Sunitinib blood and tumor concentrations
Sunitinib malate was administered at a dose of 40 mg/kg orally to 9 nude mice (3 groups, n = 3). Sunitinib was extracted from plasma or tissue by acetonitrile with temazepam as the internal standard. Tissue homogenates were prepared at a concentration of 200 mg/mL in PBS and further diluted 1:10 in human plasma prior to extraction. Separation of the compounds was achieved on a Waters X-TerraTM MS C18 (50 × 2.1 mm, 3.5 mm) analytical column with a mobile phase consisting of acetonitrile containing 0.1% formic acid (65%) and ammonium acetate (10 mM; 35%) using isocratic flow at 0.2 mL/min for 3 minutes. The analytes of interest were monitored by tandem mass spectrometry with electrospray positive ionization at transitions 399.0 -> 283.0 and 301.2 -> 355.0 for sunitinib and temazepam, respectively.
Gene expression
Gene expression profiles from 13 non-diseased kidney samples and 11 clear cell RCC tumor samples, and one from the skin metastasis used in this study were produced using the Affymetrix HG-U133 Plus2.0 GeneChip platform as previously described (12). Gene expression values were preprocessed using the RMA method as implemented in the BioConductor affy package for the R environment(13,14). Prior to data preprocessing, probe set mappings were updated (15). To predict chromosomal changes in the tumor samples, gene expression values were organized by gene-mapping information, compared to the non-tumor tissue and then scanned for expression biases as implemented in the reb package (16). Pathway analysis was preformed using the parametric gene set enrichment approach as implemented in the PGSEA package (17). The VHL and Hypoxia signatures were obtained from previous gene expression profiling studies (18,19). For pathway analysis, the “up” signature component indicates the list of genes that show increased expression relative to control cells for each pathway. Likewise, the “dn” signature component indicates the set of genes that show decreased expression relative to control cells for each pathway. The VHL gene signature was obtained from cells that contained inactivating VHL mutations. The color in the plot indicates this pathway is inactivated.
Statistical analysis
Statistical analysis was done using Student’s t test and ANOVA to compare multiple groups. P values < 0.05 were considered statistically significant.
Results
Progressive disease with new skin metastases after initial response on sunitinib
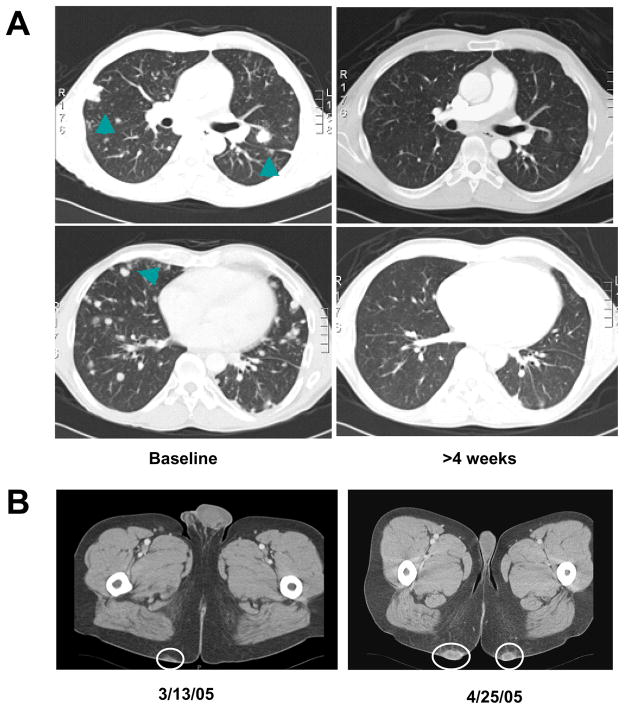
A 44 year old gentleman underwent radical right side nephrectomy for a 3.3 cm, Fuhrman Grade 4, clear cell carcinoma. Three years later the patient was found to have a left upper lobe lesion with mediastinal lymphadenopathy on routine imaging studies. A biopsy of the lung lesion was obtained and confirmed recurrent conventional type clear cell carcinoma. The patient was enrolled in a phase III trial comparing the effect of sunitinib on metastatic renal cell carcinoma versus interferon alpha. The patient was randomized to the sunitinib arm and was started on the study drug at 50 mg by mouth daily on a 4 weeks on and 2 weeks off schedule. Imaging studies after 4 weeks confirmed a partial response of his pulmonary and mediastinal lesions (Fig. 1A). The patient was continued on sunitinib and experienced stable disease after the initial partial response. Except for grade 2 diarrhea controllable with loperamide and hair discoloration the patient tolerated the treatment with sunitinib relatively well and required no dose reductions. However, the patient developed progressive subcutaneous, highly vascularized skin lesions on his buttocks (Fig. 1B). These lesions were excised and the histology was consistent with RCC metastases. Subsequently, sunitinib was discontinued after approximately 10 months of treatment. The patient was considered for additional clinical trials and treatment with high dose IL-2, but unfortunately he developed rapidly progressive disease and biphosphonate resistant hypercalcemia with accelerated clinical decline.
Figure 1. Development of skin metastases during treatment with sunitinib.
A) The patient enrolled in the Phase III randomized study received sunitinib with initial regression of lung nodules (arrows) following the first cycle and stable disease for ~10 months; B) During the treatment the patient developed progressive skin metastases that were excised and transplanted in athymic nude mice (circles).
Sunitinib-resistant tumor regained sensitivity to TKIs when transplanted in nude mice
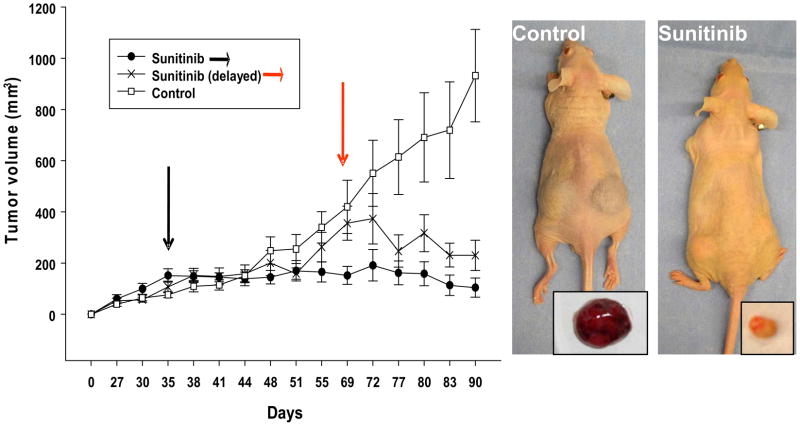
To test the hypothesis whether the sunitinib resistant skin metastases maintained a resistant phenotype we transplanted small pieces into athymic nude mice. After serial passages we treated the tumor bearing animals with sunitinib. Early treatment with sunitinib prevented tumor growth while delayed administration induced tumor regression (Fig. 2, Table 1). Treatment groups showed significant changes in tumor size and vascularization as well as tumor weight when compared to control (p < 0.05 vs control). Similar results of tumor growth control were observed with sorafenib (data not shown).
Figure 2. The sunitinib-resistant tumor regained sensitivity to TKIs when transplanted in nude mice.
A) Tumor pieces from the original skin metastases were grafted subcutaneously and tumor growth measured by caliper twice a week. Tumor-bearing mice (150–200 mm3) were randomized in three groups: control vehicle and sunitinib early or delayed intervention groups. Treatment started 35 days post implantation for vehicle, sunitinib early intervention group (black arrows) and 66 days post implantation for the sunitinib delayed intervention group (red arrows). The study lasted 90 days with a dosing schedule of 5 days on and 2 days off. Representative pictures show that control tumors were macroscopically much vascularized while sunitinib treated tumors appeared smaller and pale. Results are expressed as mean tumor volume ± SE.
TABLE I.
Anti-tumor effect of tyrosine kinase inhibitors in RCC. IH tumor xenografts
| TUMOR WEIGHT | TUMOR VOLUME | |||||
|---|---|---|---|---|---|---|
| TREATMENT GROUP | Mean (g) | Ratio | T-test | Mean (mm3) | Ratio | T-test |
| Control Group (n=9) CMF Vehicle | 0.837 | 1.0x | 1.000 | 873.3 | 1.0x | 1.000 |
| Prevention Group (n=9) Sunitinib - 40mg/kg | 0.115 | −7.3x | 0.006 | 134.0 | −6.5x | 0.003 |
| Intervention Group (n=8) Sunitinib - 40mg/kg | 0.188 | −4.5x | 0.011 | 230.2 | −3.8x | 0.007 |
n= number of tumors measured per treatment group
Ratio: Fold decrease from control in tumor weight or volume at termination of experiment
T-test parameters: array1=control; array2=experimental; tail=2; type=3 two-sample unequal variance
Treatment with sunitinib reduced microvascular density and impaired pericyte coverage
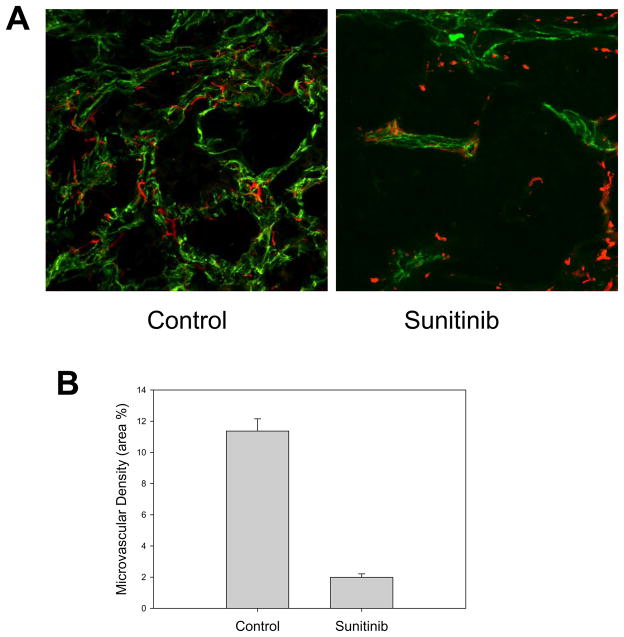
Treatment with the tyrosine kinase inhibitor sunitinib led to a significant decrease in microvascular density (MVD) (Fig. 3). Analysis with confocal microscopy revealed a significant difference in the pericyte coverage. In the control group, the pericytes were closely associated with the endothelial cells and discrete dendrite-like extensions were observed covering the endothelial cells. In the tumors treated with sunitinib the fine extensions disappeared and the pericytes were dissociated from the remaining vasculature.
Figure 3. Effect of sunitinib on RCC IH vasculature and microvascular density.
A) Treatment with sunitinib resulted in a decreased microvessel density (CD31- green fluorescence staining) associated with signs of pericyte (Desmin – red fluorescence staining) dysfunction. In untreated tumors fine pericyte extension are seen in close proximity to the endothelial cells. In sunitinib treated tumors the fine extensions have disappeared and the pericytes are dissociated from the remaining vasculature. B) Quantitative analysis of microvessel density in control and sunitinib treated tumors. Results are expressed as mean percentage of area occupied by stained cells ± SE.
IH23 tumor cell line derived from the xenograft tumor showed no sensitivity to sunitinib treatment
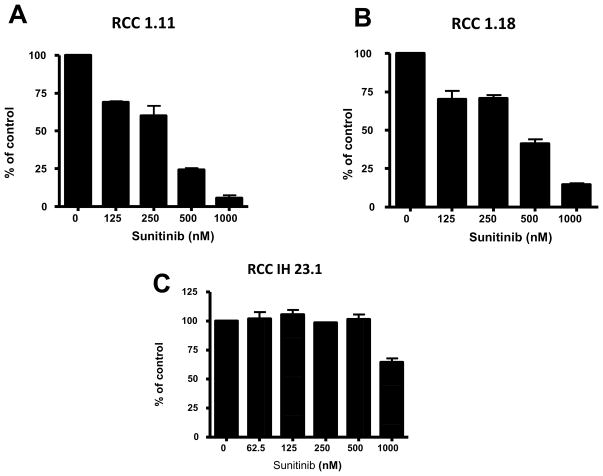
To test whether the regained sensitivity of the xenograft to sunitinib was due to a direct inhibitory effect of the TKI on the tumor cells, we isolated the IH23.1 cell line from the primary xenograft. These cells expressed inducible HIF 1α and stained positive for the pan-cytokeratin marker (data not shown). We exposed the xenograft derived cell line IH23.1 to pharmacologically relevant doses of sunitinib (≤500 nM in 10% serum). Even under prolonged exposure no direct cytotoxic effect was observed in a long-term exposure assay (Fig. 4). In comparison, in other two human renal cell carcinoma cell lines, RCC 1.18 and RCC 1.11, sunitinib treatment induced a dose dependent inhibitory effect.
Figure 4. IH23 tumor cell line derived from the xenograft tumor showed no sensitivity to sunitinib treatment.
At pharmacologically relevant doses (up to 500 nM in 10% serum), no direct growth inhibitory effect was seen in a long term exposure assay in the IH23 cell line. Additional RCC 1.11 and RCC 1.18 cell lines showed mild to moderate growth inhibition. Results are expressed as median percentage of control crystal violet positive cells ± SE.
Evidence of epithelial mesenchymal transition (EMT) in sunitinib resistant skin metastases and reverted phenotype to clear cell histology in the tumor xenografts
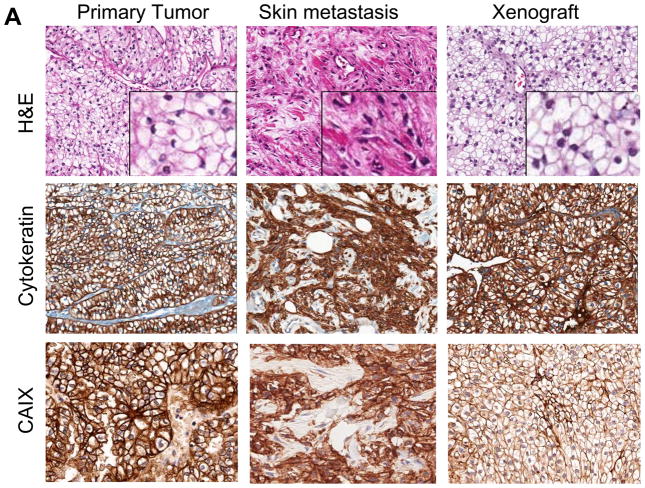
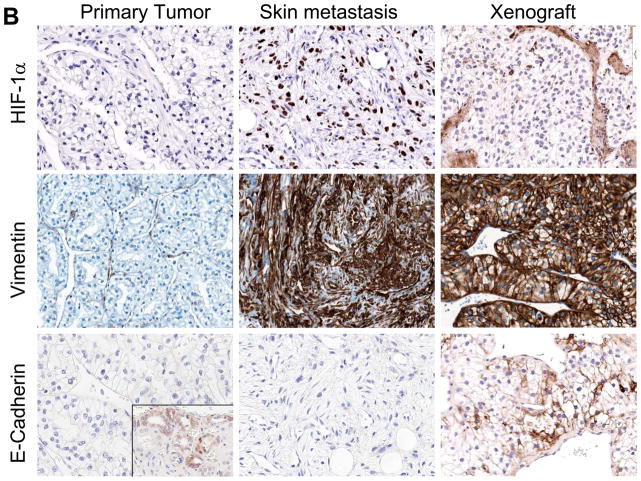
The patient’s primary renal cell carcinoma at the time of diagnosis was consistent with conventional clear cell histology with no sarcomatoid features. The skin lesions that progressed on sunitinib treatment showed pure sarcomatoid renal cell carcinoma without evidence of clear cell morphology (Fig. 5A). The sarcomatoid carcinoma was composed of highly vascularized nodular structures composed of cytologically atypical spindle shape cells. Remarkably, this histological feature was completely lost after transplantation in the mice and the original, conventional clear cell histology was restored in the tumor. Immunohistochemical analysis confirmed the nature of the spindle shape cells of the sarcomatoid carcinoma in the skin lesion as evidenced by positive staining for pan-cytokeratin (AE1/AE3) and CAIX (5A). At the same time, the mesenchymal marker vimentin and HIF-1α were expressed suggesting epithelial-mesenchymal transformation which is in line with the fibroblast like spindle cell appearance by H&E (Fig. 5B). Interestingly, the vimentin but not the HIF-1α staining positivity was retained even as the cell morphology reverted back to a clear cell phenotype in the primary xenografts. E-cadherin staining was not present neither in the original nephrectomy staining, except for the normal kidney tissue, nor the skin metastasis. Weak expression was observed in the xenograft (Fig 5B).
Figure 5. Evidence of epithelial mesenchymal transition (EMT) in sunitinib resistant skin metastases and reverted phenotype to clear cell histology in the tumor xenografts.
A) The primary renal cell carcinoma showed conventional clear cell histology (H&E,), while the skin metastasis showed extensive fibroblast-like features and lack of clear cell features suggesting EMT. Following transplantation of the skin metastases in athymic nude mice, the EMT phenotype reverted back to classical clear cell histology. Staining for cytokeratin and CAIX confirmed that the cells with fibroblast like appearance are of epithelial origin. B) HIF-1 α was expressed in the skin lesions but not in the original nephrectomy specimen nor in the murine xenograft. Vimentin, a classical marker of EMT, was absent in the patients primary tumor, but was strongly expressed in the skin metastases and maintained in the xenografts. E-cadherin was expressed in the normal kidney (see insert) but not in the primary tumor nor in the skin metastases. Weak expression was observed in the xenografts.
VHL signature in the patient derived tumor sample
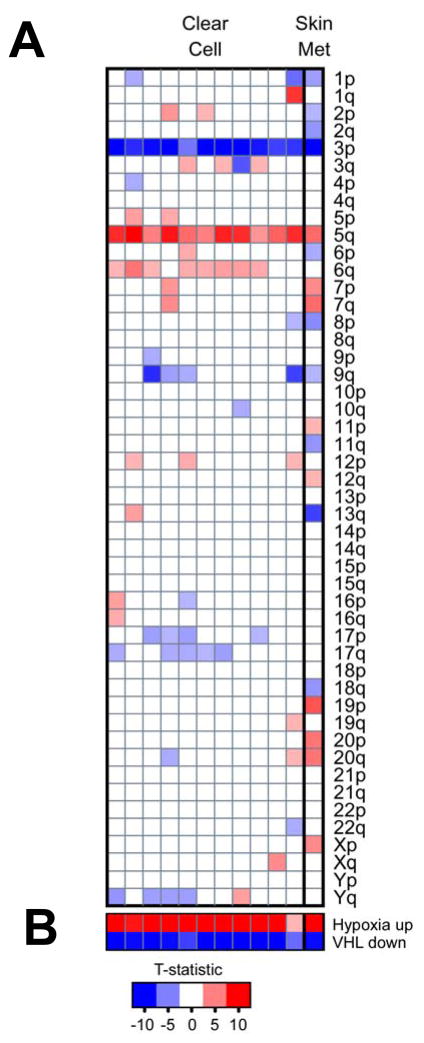
The majority of sporadic clear cell carcinoma of the kidney harbors either a genetic or an epigenetic alteration of the VHL gene. To assess the VHL status of the patient derived tumor sample were processed. Chromosomal aberration and gene expression profiles derived from clear cell and the skin metastasis used in this study were compared with gene expression profiles derived from non-diseased kidney tumor tissue (see methods). As shown in Fig 6, gene expression analysis of the skin metastasis strongly indicated it is of clear cell RCC origin. It molecular profiles showed close resemblance to that of clear cell RCC which have the typical chromosomal signature of the loss of 3p and gain of 5q (Fig. 6A). In addition, pathway analysis also showed strong VHL inactivation and hypoxia signature (Fig. 6B).
Figure 6. Deregulation of VHL/Hypoxia genes and chromosomal aberrations in clear cell RCC and the skin metastasis from the patient.
Gene expression profiles derived from clear cell (CC, n = 11) and the skin metastasis used in this study were compared with gene expression profiles derived from non-diseased kidney tumor tissue (n = 13). A) Inferred chromosomal changes based on expression of the genes mapped to each chromosomal arm (blue boxes indicate chromosomal loss while red chromosomal gain). Like the clear cell RCC cases, the skin metastasis showed loss of 3p and gain of 5q. B) Gene lists that contain genes responsive to perturbations in VHL and Hypoxia signaling were analyzed using PGSEA (see Methods). Like the clear cell RCC cases, the skin metastasis contains the strong hypoxia and VHL inactivation signatures. The resulting summary statistic (t-statistic) for each gene list was plotted; red, a significant number of genes in the list had increased expression in the tumor samples relative to the normal kidney; blue, a significant number of genes in each list had decreased expression. Only the most significant data are displayed (P < 0.005).
Sunitinib plasma and tissue levels
To tests whether the regained tumor sensitivity to sunitinib in mice was due to abnormal drug levels, we determined peak plasma and tissue concentrations of sunitinib. Peak-range sunitinib plasma levels were determined after 2 hours of oral dosing on the fifth day of the treatment cycle at the end of the treatment study. Mean peak plasma sunitinib level was 402 ng/ml with the 40 mg/kg daily dosing and this result was comparable to published data (20). Synchronous tissue concentrations of the tumor and skin were determined. Mean concentration of sunitinib in the tumor and skin was 4333 ng/gram and 2963 ng/gram, respectively.
Discussion
Angiogenesis inhibition as a cancer treatment modality has been validated across a spectrum of solid tumors. In clear cell renal cell carcinoma, clinically effective single agent activity with the TKI sunitinib has been demonstrated and this drug is currently recommended for first-line treatment (1). Despite the excitement for the recent successes, eventually patients will progress, stressing the importance to study the potential mechanism of resistance. In this study we report on the unique opportunity of establishing human tumor xenografts from a patient with metastatic clear cell renal cell carcinoma who initially responded to treatment with sunitinib but subsequently developed progressive disease with new metastatic lesions on treatment. To our surprise, the resistance to sunitinib in the patient did not predict its subsequent response as a xenograft. The regressed tumors showed the characteristic pharmacodynamic effects of sunitinib, i.e. decrease in microvascular density and pericyte dysfunction while no direct antitumor effects of sunitinib on a xenograft derived cell line at pharmacologically relevant doses was observed.
The histological data and tumor growth experiments suggest that the tumor microenvironment contributed to the acquired resistance to sunitinib in this patient. While the exact mechanism of resistance remains unclear, the association of the sunitinib resistant skin tumors with an epithelial-mesenchymal-transition (EMT) phenotype is intriguing. EMT has been associated with metastasis, drug resistance, and angiogenesis (21–25). A growing number of interdependent pathways have been linked to the induction of EMT which by definition is a potentially transient/reversible phenotype of epithelial cancers (23, 25–27). While the patient’s skin metastasis showed homogenous fibroblast-like spindle cell histology with cytokeratin and vimentin immunoreactivity, the primary xenograft reverted back to conventional clear cell carcinoma histology. Interestingly, the staining for vimentin, a marker for EMT, remained positive in the xenograft. Our observation is supported by other clinical data. Sarcomatoid differentiation is a growth pattern characterized by spindle-shaped histology, i.e. fibroblast-like appearance (28). While not a histological subtype per se, a sarcomatoid phenotype is observed across all subtypes of renal cell carcinoma, typically portends a poor prognosis and recently has been associated with an increased resistance to VEGF pathway inhibitors (29). Interestingly, similar to our findings the fibroblast-like cancer cells with sarcomatoid features express epithelial and mesenchymal markers (cytokeratin and vimentin) – a phenotype consistent with the definition of EMT.
Our observation does not rule the possibility that by passaging the human tumor into nude mice we may have selected a clear cell carcinoma population that may be responsible for the reverted phenotype. However, several points suggest that this is not the case. The strong vimentin positive staining in the skin metastasis and the xenografted tumors but not in the original nephrectomy speaks against the argument of selection. The two original skin metastases were propagated simultaneously in several immunocompromised mice and the reverted phenotype and regained sensitivity to sunitinib was observed in multiple isolates. The histological examination by our pathologist also did mot reveal any clear cell in the original skin metastasis. The chromosomal signature, VHL inactivation and hypoxia signature in the skin metastasis indicated the clear cell origin. The comparison of chromosomal aberrations between the skin metastasis and the xenograft revealed significant homology suggesting similar tumor cell populations (data not shown). All these considerations suggest that our observation was not merely due to a positive selection mechanism but rather to a true phenotypic change.
In our experimental model we measured the sunitinib levels to rule out the possibility that the regained tumor sensitivity in mice was not due to higher drug exposure as compared to humans. While the effective, target modulatory plasma concentration is comparable between mouse and humans (i.e. 50–100 ng/ml)(30, 20), there is a significant difference in sunitinib half-life in the two species. In humans, the half-life typically exceeds 40 hours (41–80) allowing convenient once daily dosing. Median peak level at 50 mg daily is 72 ng/ml with high median trough levels of 44 ng/ml, suggesting a continuous 24 hour target modulatory effect (30). In mice, however, a higher daily dose was required to observe a meaningful antitumor effect. At 40 mg/kg, peak levels of ~1000 ng/ml have been reported with a trough level of ~2 ng/ml, suggesting a much shorter half life as compared to humans (20). Preclinical data suggest that meaningful anti-tumor effects occur only when a durable target inhibition of VEGFR2 (at least 12 hours) is achieved with plasma concentrations ~50–100 ng/ml (20). Higher Cmax levels did not correlate with greater tumor activity in preclinical models (20). Therefore, even if in our experiments we achieved higher peak levels in mice with 40 mg/kg dosage as compared to humans, the exposure to sunitinib within 12–24 hours was very similar to that one achieved with 50 mg in humans. However, our observation does not completely rule out the possibility that a dose escalation strategy of sunitinib therapy may still overcome resistance.
To confirm that the effects observed in our study were not simply due to higher peak levels, we exposed a cell line derived from the primary xenograft in vitro to increasing drug concentrations. When compared with other renal cell carcinoma cell lines, we observed no inhibitory effect with sunitinib concentrations up to 500 ng/ml and continuous exposure for two weeks. It is important to notice that sunitinib is highly protein-bound (90–95%) (20), and since only 10 % of serum was used, the effective free drug concentration is probably much higher, potentially 10 fold or more, as compared to human serum concentration. The same observation holds true for the increased tumor and skin drug levels as compared to plasma. Sunitinib accumulates in tissues (and probably in tumors) by binding to proteins and extracellular matrix. Yellow discoloration of the skin is clinically observed and it explains the high distribution volume (in the excess of 2000 liters)(20). Our observation does not rule out the possibility that sunitinib may still exert a direct antitumor effect and additional mechanisms of resistance may be involved in patients with clear cell carcinoma treated with TKIs.
In this report we describe the de novo onset of an EMT-like phenotype in a patient with conventional clear cell RCC on sunitinib treatment, the associated acquired resistance to the treatment with sunitinib, and the reversion to an epithelial histology in a primary xenograft model which again is responsive to the treatment with sunitinib. Different mechanisms of resistance such as the expression of additional proangiogenic growth factors, the recruitment of bone marrow derived cells, increased pericyte coverage as well as angiogenesis independent growth patterns have been described (9). We believe that EMT can be added to the list of potential resistance mechanisms. Treatment-associated tumor hypoxia has been reported to induce an epithelial-mesenchymal transition (EMT) in several tumor models (31). Interestingly, we observed an induction of HIF-1α staining in the skin metastasis as compared to the nephrectomy sample that resolved in the xenografts. How frequently EMT as a mechanism of acquired resistance occurs is unknown and deserves further investigation. We recognize that our results represent hypothesis-generating data that need to be confirmed by future studies involving larger series of patients. Furthermore, our findings should caution about the interpretation of data obtained with angiogenesis inhibitors in primary xenograft models. Resistance mechanisms in the tumor microenvironment may be transient in nature and could be lost as the human tumors are populated with mouse stromal elements.
The reverted histological phenotype observed in the xenografts also suggests that the escape mechanisms to anti VEGF therapies may also be transient. According to this hypothesis patients who have initially received clinical benefit from treatment with TKIs and then developed resistant disease may respond again to TKIs following a break from anti VEGF therapies. The “holiday” period from anti VEGF therapies may lead to “reset” the tumor microenvironment and reestablish a primarily VEGF-driven tumor growth. This hypothesis is supported by anecdotic reports of patients who were treated with sunitinib with initial response and subsequent progression who responded again to sunitinib following different targeted therapies such as mTOR inhibitors. The apparent transient/reversible mechanism of resistance to anti VEGF therapies may also explain why clinical benefit has been reported by sequencing different anti VEGF therapies despite the fact that these agents target the same VEGF pathway. Sufficient time elapsed between treatments could “reset” the tumor microenvironment.
The ongoing molecular profiling of tumor/stromal cells to anti VEGF therapies both in preclinical and clinical setting will continue to shed a light on the mechanisms of resistance and will guide clinicians to offer the optimal sequence/combination of targeted agents to patients with advanced clear cell renal carcinoma.
Acknowledgments
We would like to thank Mary Vaughan and the pathology core facility at Roswell Park Cancer Institute for their technical assistance with the immunohistochemistry studies.
This study was supported in part by a research grant from the National Comprehensive Cancer Network, Pfizer and a generous gift from Dr. Richard Turner and Mrs. Deidre Turner. Correspondence: Roberto Pili, MD Roswell Park Cancer Institute Elm&Carlton Streets, Buffalo, NY 14263-0001, Roberto. Pili@RoswellPark.org. Roberto Pili is a paid consultant for Pfizer.
References
- 1.Rini BI, Campbell SC, Escudier B. Renal cell carcinoma. Lancet. 2009;373(9669):1119–32. doi: 10.1016/S0140-6736(09)60229-4. [DOI] [PubMed] [Google Scholar]
- 2.Fabian MA, Biggs WH, 3rd, Treiber DK, Atteridge CE, Azimioara MD, Benedetti MG, et al. A small molecule-kinase interaction map for clinical kinase inhibitors. Nat Biotechnol. 2005;23(3):329–36. doi: 10.1038/nbt1068. [DOI] [PubMed] [Google Scholar]
- 3.Stein MN, Flaherty KT. CCR drug updates: Sorafenib and sunitinib in renal cell carcinoma. Clin Cancer Res. 2007;13(13):3765–70. doi: 10.1158/1078-0432.CCR-06-2844. [DOI] [PubMed] [Google Scholar]
- 4.Motzer RJ, Michaelson MD, Redman BG, et al. Activity of SU11248, a multitargeted inhibitor of vascular endothelial growth factor receptor and platelet-derived growth factor receptor, in patients with metastatic renal cell carcinoma. J Clin Oncol. 2006;24(1):16–24. doi: 10.1200/JCO.2005.02.2574. [DOI] [PubMed] [Google Scholar]
- 5.Maxwell PH, Wiesener MS, Chang GW, et al. The tumour suppressor protein VHL targets hypoxia-inducible factors for oxygen-dependent proteolysis. Nature. 1999;399(6733):271–5. doi: 10.1038/20459. [DOI] [PubMed] [Google Scholar]
- 6.Forsythe JA, Jiang BH, Iyer NV, et al. Activation of vascular endothelial growth factor gene transcription by hypoxia-inducible factor 1. Mol Cell Biol. 1996;16(9):4604–13. doi: 10.1128/mcb.16.9.4604. [DOI] [PMC free article] [PubMed] [Google Scholar]
- 7.Ratain MJ, Eisen T, Stadler WM, et al. Phase II placebo-controlled randomized discontinuation trial of sorafenib in patients with metastatic renal cell carcinoma. J Clin Oncol. 2006;24(16):2505–12. doi: 10.1200/JCO.2005.03.6723. [DOI] [PubMed] [Google Scholar]
- 8.Motzer RJ, Hutson TE, Tomczak P, et al. Overall survival and updated results for sunitinib compared with interferon alfa in patients with metastatic renal cell carcinoma. J Clin Oncol. 2009 Aug 1;27(22):3584–90. doi: 10.1200/JCO.2008.20.1293. [DOI] [PMC free article] [PubMed] [Google Scholar]
- 9.Bergers G, Hanahan D. Modes of resistance to anti-angiogenic therapy. Nat Rev Cancer. 2008;8(8):592–603. doi: 10.1038/nrc2442. [DOI] [PMC free article] [PubMed] [Google Scholar]
- 10.Qian DZ, Kachhap SK, Collis SJ, et al. Class II histone deacetylases are associated with VHL-independent regulation of hypoxia-inducible factor 1 alpha. Cancer Res. 2006;66(17):8814–21. doi: 10.1158/0008-5472.CAN-05-4598. [DOI] [PubMed] [Google Scholar]
- 11.Mancuso MR, Davis R, Norberg SM, et al. Rapid vascular regrowth in tumors after reversal of VEGF inhibition. J Clin Invest. 2006;116(10):2610–21. doi: 10.1172/JCI24612. [DOI] [PMC free article] [PubMed] [Google Scholar]
- 12.Yang XJ, Tan MH, Kim HL, et al. A molecular classification of papillary renal cell carcinoma. Cancer Res. 2005;65:5628–37. doi: 10.1158/0008-5472.CAN-05-0533. [DOI] [PubMed] [Google Scholar]
- 13.Ihaka R, Gentleman R. R: A language for data analysis and graphics. J Comput Graph Stat. 1996;5:299–314. [Google Scholar]
- 14.Gentleman RC, Carey VJ, Bates DM, et al. Bioconductor: open software development for computational biology and bioinformatics. Genome Biol. 2004;5:R80. doi: 10.1186/gb-2004-5-10-r80. [DOI] [PMC free article] [PubMed] [Google Scholar]
- 15.Dai M, Wang P, Boyd AD, et al. Evolving gene/transcript definitions significantly alter the interpretation of GeneChip data. Nucleic Acids Res. 2005;33:e175. doi: 10.1093/nar/gni179. [DOI] [PMC free article] [PubMed] [Google Scholar]
- 16.Dykema Karl J, Furge Kyle A. Diminished transcription of chromosome arm 4q is inversely related to local spreading of hepatocellular carcinoma. Genes, Chromosomes and Cancer. 2004;41(4):390–394. doi: 10.1002/gcc.20090. [DOI] [PubMed] [Google Scholar]
- 17.Furge KA, Chen J, Koeman J, et al. Detection of DNA copy number changes and oncogenic signaling abnormalities from gene expression data reveals MYC activation in high-grade papillary renal cell carcinoma. Cancer Res. 2007;67:3171–6. doi: 10.1158/0008-5472.CAN-06-4571. [DOI] [PubMed] [Google Scholar]
- 18.Bild AH, Yao G, Chang JT, et al. Oncogenic pathway signatures in human cancers as a guide to targeted therapies. Nature. 2006;439:353–357. doi: 10.1038/nature04296. [DOI] [PubMed] [Google Scholar]
- 19.Chi JT, Wang Z, Nuyten DS, et al. Gene Expression Programs in Response to Hypoxia: Cell Type Specificity and Prognostic Significance in Human Cancers. PLoS Medicine. 2006 doi: 10.1371/journal.pmed.0030047. [DOI] [PMC free article] [PubMed] [Google Scholar]
- 20.Mendel DB, Laird AD, Xin X, Louie SG, et al. In vivo antitumor activity of SU11248, a novel tyrosine kinase inhibitor targeting vascular endothelial growth factor and platelet-derived growth factor receptors: Determination of a pharmacokinetic/pharmacodynamic relationship. Clin Cancer Res. 2003;9(1):327–37. [PubMed] [Google Scholar]
- 21.Frederick BA, Helfrich BA, Coldren CD, et al. Epithelial to mesenchymal transition predicts gefitinib resistance in cell lines of head and neck squamous cell carcinoma and non-small cell lung carcinoma. Mol Cancer Ther. 2007;6(6):1683–91. doi: 10.1158/1535-7163.MCT-07-0138. [DOI] [PubMed] [Google Scholar]
- 22.Kajiyama H, Shibata K, Terauchi M, et al. Chemoresistance to paclitaxel induces epithelial-mesenchymal transition and enhances metastatic potential for epithelial ovarian carcinoma cells. Int J Oncol. 2007;31(2):277–83. [PubMed] [Google Scholar]
- 23.Ghersi G. Roles of molecules involved in epithelial/mesenchymal transition during angiogenesis. Front Biosci. 2008;13:2335–55. doi: 10.2741/2848. [DOI] [PubMed] [Google Scholar]
- 24.Shah AN, Summy JM, Zhang J, Park SI, Parikh NU, Gallick GE. Development and characterization of gemcitabine-resistant pancreatic tumor cells. Ann Surg Oncol. 2007;14(12):3629–37. doi: 10.1245/s10434-007-9583-5. [DOI] [PubMed] [Google Scholar]
- 25.Mironchik Y, Winnard PT, Vesuna F, et al. Twist overexpression induces in vivo angiogenesis and correlates with chromosomal instability in breast cancer. Cancer Res. 2005;65(23):10801–9. doi: 10.1158/0008-5472.CAN-05-0712. [DOI] [PMC free article] [PubMed] [Google Scholar]
- 26.Peinado H, Marin F, Cubillo E, et al. Snail and E47 repressors of E-cadherin induce distinct invasive and angiogenic properties in vivo. J Cell Sci. 2004;117(Pt 13):2827–39. doi: 10.1242/jcs.01145. [DOI] [PubMed] [Google Scholar]
- 27.Klymkowsky MW, Savagner P. Epithelial-mesenchymal transition: A cancer researcher’s conceptual friend and foe. Am J Pathol. 2009;174(5):1588–93. doi: 10.2353/ajpath.2009.080545. [DOI] [PMC free article] [PubMed] [Google Scholar]
- 28.Kuroda N, Toi M, Hiroi M, Enzan H. Review of sarcomatoid renal cell carcinoma with focus on clinical and pathobiological aspects. Histol Histopathol. 2003;18(2):551–5. doi: 10.14670/HH-18.551. [DOI] [PubMed] [Google Scholar]
- 29.Golshayan AR, George S, Heng DY, et al. Metastatic sarcomatoid renal cell carcinoma treated with vascular endothelial growth factor-targeted therapy. J Clin Oncol. 2009;27(2):235–41. doi: 10.1200/JCO.2008.18.0000. [DOI] [PubMed] [Google Scholar]
- 30.Faivre S, Delbaldo C, Vera K, et al. Safety, pharmacokinetic, and antitumor activity of SU11248, a novel oral multitarget tyrosine kinase inhibitor, in patients with cancer. J Clin Oncol. 2006;24(1):25–35. doi: 10.1200/JCO.2005.02.2194. [DOI] [PubMed] [Google Scholar]
- 31.Hugo H, Ackland ML, Blick T, et al. Epithelial--mesenchymal and mesenchymal--epithelial transitions in carcinoma progression. J Cell Physiol. 2007 Nov;213(2):374–83. doi: 10.1002/jcp.21223. [DOI] [PubMed] [Google Scholar]


