

Abstract
Long-term risk prediction is a priority for the prevention of atrial fibrillation (AF). P wave indices are electrocardiographic measurements describing atrial conduction. The role of P wave indices in the prospective determination of AF and mortality risk has had limited assessment. We quantified by digital caliper the P wave indices of maximum duration and dispersion in 1,550 Framingham Heart Study participants ≥60 years old (58% women) from single-channel electrocardiograms recorded from 1968 through 1971. We examined the association of selected P wave indices and long-term outcomes using Cox proportional hazards regression incorporating age, gender, body mass index, systolic blood pressure, treatment for hypertension, significant murmur, heart failure, and PR interval. Over a median follow-up of 15.8 years (range 0 to 38.7), 359 participants developed AF and 1,525 died. Multivariable-adjusted hazard ratios (HRs) per SD increase in maximum P wave duration were 1.15 (95% confidence interval [CI] 0.90 to 1.47, p = 0.27) for AF and 1.02 (95% CI 0.96 to 1.08, p = 0.18) for mortality. The upper 5% of P wave maximum duration had a multivariable-adjusted HR of 2.51 (95% CI 1.13 to 5.57, p = 0.024) for AF and an HR of 1.11 (95% CI 0.87 to 1.40, p = 0.20) for mortality. We found no significant associations between P wave dispersion with incidence of AF or mortality. In conclusion, maximum P wave duration at the upper fifth percentile was associated with long-term AF risk in an elderly community-based cohort. P wave duration is an electrocardiographic endophenotype for AF.
We sought to assess prospectively the association between P wave indices and clinical outcomes in the Framingham Heart Study (FHS). Specifically, we hypothesized that prolonged P wave duration and dispersion were associated with atrial fibrillation (AF) risk. We used a digital caliper to determine P wave duration and dispersion from single-channel electrocardiograms (ECGs) and then examined their relation to the outcomes of AF, heart failure (HF), and mortality in a prospective analysis.
Methods
The FHS is a longitudinal community-based study designed to investigate risk factors for cardiovascular disease.1,2 The study was initiated in 1948 with the enrollment of an original cohort. The present study used baseline data from the original cohort’s 11th biennial examination, which occurred from 1968 through 1971 and included 2,955 participants. Participants at this examination underwent comprehensive phenotypic assessment that included physical examination, clinical history, laboratory assessment including cholesterol levels, and single-channel ECG. Subjects <60 years of age (n = 1,323), with a history of AF (n = 29), or with illegible ECGs for measurement acquisition as described later (n = 53) were excluded from the present analysis. No subjects had pacemaker implantation or missing covariate data. After exclusions, 1,550 participants (905 women) were eligible for inclusion. All participants provided written informed consent and the study was approved by Boston University Medical Center’s institutional review board.
Participants at index examinations underwent comprehensive clinical assessments including physical examination, laboratory assessment, and review of medications, clinical history, and interim clinical events. Participants had a single-channel ECG recorded sequentially on lined paper at 25 mm/s and 0.1 mV/mm (Hewlett-Packard, Palo Alto, California) sequentially for each of the 12 electrocardiographic leads as described previously.3 ECGs were converted to tagged image format using commercially available software for electrocardiographic measurement modified for the present study (Rigel 1.7.4, AMPS, New York, New York; available at: http://www.amps-llc.com).4,5 The software uses a computer mouse for digital caliper manipulation, fourfold magnification, and automated measurement recording to avoid transcription error. P wave indices such as area and terminal force were not determined in the present study owing to the design of the software.
Measurements consisted of identification of the initiation of P wave onset and its termination at P wave offset. P wave onset was determined as a positive deflection after the T wave preceding the QRS waveform and deviating from the isoelectric line comprised of the TP interval. P wave offset was determined as the return to isoelectric baseline immediately before the QRS waveform. An analogous protocol was employed for negative deflections consistent with P waves in lead V1. Up to 3 consecutive P waves were measured in each of the 12 leads to account for physiologic variability. Leads with ambiguous P wave onset or offset were not included for measurement. All measurements were determined by a single investigator (J.W.M.). Previous assessment of quality control had demonstrated an intrarater intraclass correlation coefficients of r = 0.80 for maximum P wave duration and r = 0.82 for P wave dispersion (defined later).6 Of note, intraclass correlation coefficients of 0.50, 0.75, and 1.00 suggest moderate, excellent, and perfect correlations, respectively. The PR interval was quantified independent of the present investigation as described previously.7
P wave indices employed included maximum P wave duration, minimum P wave duration, and P wave dispersion. Maximum P wave duration was defined as the longest and minimum as the shortest duration P wave from all leads. P wave dispersion was defined as the difference between the maximum and minimum P wave durations. P wave indices were derived from mean measurements and measurements were recorded in milliseconds.
FHS participants receive ongoing surveillance for cardiovascular events and mortality; records are retrieved from outside medical facilities and hospitalizations. Adjudication for cardiovascular events, including HF, is performed by 3 FHS investigators who review pertinent data from all available hospitalizations, ambulatory medical records, and FHS examinations.8–11 ECGs are reviewed by a study cardiologist and classified as AF or atrial flutter, as previously documented.12,13 As in previous analyses from the FHS, participants with tracings showing atrial flutter were combined with those showing AF.
Descriptive statistics were generated for the 1,550 subjects included in the analysis. Continuous variables were described using means ± SDs and categorical variables using percentages. Mean P wave duration was computed for each lead by summing the P wave durations for each lead and dividing by the number of leads measured, followed by determination of maximum and minimum P waves defined by magnitude of P wave duration across the 12 leads. Correlations between the P wave indices were calculated.
We constructed multivariable Cox proportional hazards regression models to examine the association between P wave indices (PR interval, maximum P wave duration, and P wave dispersion) and the separate outcomes of AF, HF, and all-cause mortality. We determined the hazard ratio (HR) and 95% confidence interval (CI) relative to a 1-SD increase in each of the P wave indices. In secondary analyses we stratified P wave indices by >95th percentile (i.e., 5% longest measurements) compared to those in ≤95th percentile. All analyses were initially adjusted for age and gender. Multivariable adjustment was performed using age, gender, body mass index, systolic blood pressure, treatment for hypertension, significant murmur (≥3/6 systolic murmur or presence of any diastolic murmur), and HF. These variables were derived from a previous Framingham AF risk score analysis.14 HF was diagnosed by established validated criteria.9 Cases of prevalent HF were excluded from analyses examining the outcome of HF. For maximum P wave duration, multivariable adjustment also included PR interval. We confirmed the proportionality of hazards assumption separately for each of the 3 outcomes.
All analyses were performed using SAS 9.1.3 (SAS Institute, Cary, North Carolina). Statistical significance was determined by a 2-sided p value <0.05.
Results
Of 1,550 subjects included in the present investigation, 58% were women and mean age was 68.2 ± 5.5 years. Median follow-up was 15.8 years (range 0.0 to 38.1). Six percent had a previous myocardial infarction and 2% prevalent HF. Further baseline characteristics of participants and distribution of the P wave indices are presented in Table 1.
Table 1.
Baseline characteristics of Framingham Heart Study original cohort
| Entire Cohort (n = 1,550) | Men (n = 645) | Women (n = 905) | |
|---|---|---|---|
| Clinical characteristics | |||
| Age (years) | 68.2 ± 5.5 | 68.0 ± 5.4 | 68.3 ± 5.6 |
| Women | 58% | — | — |
| Body mass index (kg/m2) | 25.6 ± 3.9 | 25.7 ± 3.2 | 25.5 ± 4.3 |
| Systolic blood pressure (mm Hg) | 146 ± 22 | 143 ± 22 | 148 ± 23 |
| Treatment for hypertension | 20% | 14% | 24% |
| Significant precordial murmur* | 5% | 4% | 5% |
| Prevalent heart failure | 2% | 2% | 2% |
| Myocardial infarction | 6% | 10% | 3% |
| Heart rate (beats/min) | 77 ± 13 | 74 ± 13 | 79 ± 13 |
| Electrocardiographic left ventricular hypertrophy | 4% | 4% | 3% |
| QRS interval (ms) | 77 ± 15 | 80 ± 16 | 75 ± 14 |
| P wave indices | |||
| P wave duration (ms) | 86 ± 9 | 87 ± 9 | 86 ± 9 |
| Maximum P wave duration (ms) | 105 ± 12 | 108 ± 12 | 104 ± 12 |
| P wave dispersion (ms) | 41 ± 11 | 43 ± 12 | 39 ± 11 |
| PR interval (ms) | 163 ± 23 | 166 ± 25 | 160 ± 22 |
Values presented as mean ± SD or percentage.
Defined as systolic murmur grade >3 of 6 or any diastolic murmur auscultated by a physician.
Correlations between P wave indices assessed are presented in Table 2. Maximum P wave duration and P wave dispersion were strongly correlated (r = 0.74). PR interval was moderately correlated with maximum P wave duration (r = 0.34) and less so with P wave dispersion (r = 0.17).
Table 2.
Correlation matrix, Framingham Heart Study, original cohort, P wave indices
| Maximum P Wave Duration | P Wave Dispersion | PR Interval | |
|---|---|---|---|
| Maximum P wave duration | 1.00 | ||
| P wave dispersion | 0.74 | 1.00 | |
| PR interval | 0.34 | 0.17 | 1.00 |
By the conclusion of follow-up, 359 participants developed AF, 337 developed HF, and 1,525 died; these categories were nonexclusive. Age- and gender-adjusted incidence rates per 10,000 person-years were stratified at the 95th percentile of measurements and are presented in Table 3. The AF incidences per 10,000 person-years were 143 (95% CI 117 to 166) at ≤95th percentile and 228 (95% CI 126 to 297) at >95th percentile for maximum P wave duration. Incidence rates per 10,000 years for mortality were similar across the strata of maximum P wave duration (324 for ≤95th percentile, 95% CI 307 to 338, and 351 for >95th percentile, 95% CI 300 to 387). P wave dispersion for ≤95th percentile had a higher incidence of AF, HF, and mortality compared to those values in >95th percentile.
Table 3.
Incidence of atrial fibrillation, heart failure, and all-cause mortality in long-term outcomes
| P Wave Indices | Atrial Fibrillation | Heart Failure | All-Cause Mortality |
|---|---|---|---|
| Maximum P wave duration | |||
| ≤95th percentile | 143 (117–166) | 119 (95–141) | 324 (307–338) |
| >95th percentile | 228 (126–297) | 108 (41–163) | 351 (300–387) |
| P wave dispersion | |||
| ≤95th percentile | 149 (122–173) | 122 (97–144) | 325 (309–340) |
| >95th percentile | 105 (37–161) | 69 (19–114) | 319 (265–358) |
| PR interval | |||
| ≤95th percentile | 139 (113–162) | 118 (94–140) | 323 (306–337) |
| >95th percentile | 224 (147–281) | 127 (64–178) | 346 (308–375) |
Values are incidences per 10,000 person-years (95% confidence intervals). Incidence rates are adjusted for age and gender.
Hazards for associations between P wave indices and outcomes are presented in Table 4. Gender- and age-adjusted HR per SD increase in maximum P wave duration was 1.12 (95% CI 1.00 to 1.25, p = 0.047) for AF and multivariable-adjusted HR was 1.15 (95% CI 0.90 to 1.47, p = 0.08). When stratified at the 95th percentile in a secondary analysis, the upper 5% of maximum P wave duration had an HR of 2.19 (95% CI 1.46 to 3.30, p < 0.001) for AF in gender- and age-adjusted analysis and an HR of 2.51 (95% CI 1.13 to 5.57, p = 0.024) in multivariable-adjusted analysis. In comparison, PR interval stratified at the 95th percentile conveyed an HR of 1.65 (95% CI 1.20 to 2.29, p = 0.002) for AF in age- and gender-adjusted analysis and an HR of 1.59 (95% CI 0.83 to 3.03, p = 0.16) in multivariable-adjusted analysis. P wave maximum duration was not significantly associated with mortality when examined by SD increase. After stratification at the 95th percentile, the upper 5% of maximum P wave duration had an HR of 1.28 (95% CI 1.01 to 1.61, p = 0.04) for all-cause mortality in age- and gender-adjusted analysis and an HR of 1.11 (95% CI 0.87 to 1.40, p = 0.20) in multivariable-adjusted analysis. In contrast, PR interval remained significantly associated with mortality in all analyses.
Table 4.
P wave indices and long-term outcomes in Framingham Heart Study original cohort, 11th examination (1968 to 1971) (n = 1,550)
| P wave Indices | Atrial Fibrillation |
All-Cause Mortality |
||
|---|---|---|---|---|
| HR (95% CI) | p Value | HR (95% CI) | p Value | |
| Maximum P wave duration | ||||
| Age and gender adjusted, 1-SD increase* | 1.12 (1.00–1.25) | 0.047 | 1.04 (0.99–1.10) | 0.13 |
| Multivariable adjusted, 1-SD increase† | 1.15 (0.90–1.47) | 0.27 | 1.02 (0.96–1.08) | 0.18 |
| Age and gender adjusted, >95th percentile* | 2.19 (1.46–3.30) | <0.001 | 1.28 (1.01–1.61) | 0.04 |
| Multivariable-adjusted, >95th percentile† | 2.51 (1.13–5.57) | 0.024 | 1.11 (0.87–1.40) | 0.20 |
| P wave dispersion | ||||
| Age and gender adjusted, 1-SD increase* | 1.00 (0.90–1.11) | 1.00 | 1.03 (0.98–1.08) | 0.32 |
| Multivariable adjusted, >95th percentile† | 0.84 (0.20–3.54) | 0.81 | 0.93 (0.74–1.17) | 0.55 |
| PR interval | ||||
| Age and gender adjusted* | 1.21 (1.08–1.34) | <0.001 | 1.07 (1.02–1.13) | 0.001 |
| Multivariable adjusted† | 1.15 (0.90–1.47) | 0.27 | 1.07 (1.01–1.12) | 0.012 |
| Age and gender adjusted, >95th percentile* | 1.65 (1.20–2.29) | 0.002 | 1.27 (1.07–1.50) | 0.006 |
| Multivariable adjusted, >95th percentile† | 1.59 (0.83–3.03) | 0.16 | 1.24 (1.05–1.47) | 0.011 |
All estimates are adjusted for age and gender.
Multivariable adjusted includes age, gender, body mass index, systolic blood pressure, treatment for hypertension, and significant murmur and includes heart failure for outcome of atrial fibrillation. For maximum P wave duration, multivariable adjustment also includes PR interval.
Figure 1 shows the cumulative incidences of AF and mortality for P wave maximum duration stratified by 95th percentile (p <0.001 for the 2 comparisons, log-rank test). Neither maximum P wave duration nor PR interval was associated with HF, as shown in the Supplementary Table (available online). P wave dispersion had no significant association to AF or all-cause mortality.
Figure 1.
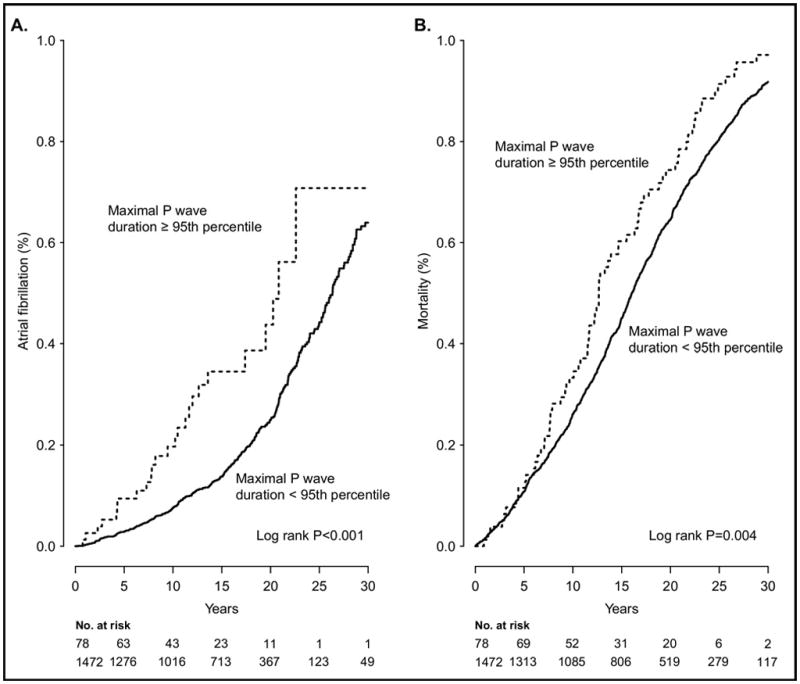
Cumulative incidences of (A) atrial fibrillation and (B) mortality for P wave maximum duration stratified by 95th percentile.
Discussion
We examined P wave indices of mean and maximum P wave duration and P wave dispersion in the FHS to determine their association with clinical outcomes up to 30 years of follow-up in participants ≥60 years of age. In multivariable analyses maximum P wave duration and dispersion were not associated with AF, HF, or all-cause mortality per SD. However, in a secondary analysis, the upper 5% of maximum P wave duration was associated with an HR of 2.51 (95% CI 1.13 to 5.57, p = 0.024) in multivariable analysis. Our results suggest that maximum P wave duration is significantly associated with AF even after adjustment for identified risk factors including PR interval. Extreme values of P wave duration can serve as an electrocardiographic endophenotype for AF.
These findings were obtained in a community-based study with comprehensive phenotypic characterization and well-established adjudication of cardiovascular outcomes and mortality status. The longitudinal study design maximized follow-up by extending for a median of 15.8 years. Our results are similar to a previous analysis of P wave indices in the Atherosclerosis Risk in Communities (ARIC) Study.15 The ARIC study found a 1-SD HR of 1.14 (95% CI 1.05 to 1.23) in age- and gender-adjusted analysis and an HR of 1.06 (95% CI 0.97 to 1.15) with multivariable adjustment. Although median follow-up was shorter than in the present investigation, the larger study (n = 15,429) resulted in greater power.
We did not identify HF as an end point for previous studies incorporating P wave indices. In systolic HF, atrial conduction is altered and highly abnormal even in the absence of AF, manifested by fractionated electrograms and scarring on intracardiac electrophysiologic studies.16 Prolonged P wave dispersion also has been associated with diastolic dysfunction in a cross-sectional study that reported a gradient of progressive prolongation accompanying the severity of diastolic impairment.17 Thus, we hypothesized that we would identify an association between increased P wave indices and HF. However, in this study neither maximum P wave duration nor PR interval was associated with HF as a longitudinal outcome. Whether larger studies using automated electrocardiographic software and more HF events will demonstrate a relation between P wave indices and HF remains to be determined.
The strengths of the present study include long-term follow-up, reliable end-point adjudication, and a sample larger than most publications concerning P wave indices that we have identified.18 The study’s foremost limitation is the measurement technique. Single-channel ECGs were used because of their accessibility for incorporation into the present study; no digital or 12-lead ECGs were available for replication and measurement using the instrument described in this report. Such older single-quality ECGs have baseline wander and artifact stemming from filtering limits. Challenges to electrocardiographic quality would have exacerbated identifying P wave onset, characterized by a low amplitude signal. Although our study had a robust intrarater intraclass correlation coefficient, it did not permit the reproducibility reported by computerized measurements from digitized ECGs.15 Our study would have been enhanced by employing such software in contrast to manipulating a digital mouse on ECGs displayed in tagged image format. Our opinion is that automated measurement has become a “gold standard” for large-volume highly reproducible serial measurements.
Second, measurements were made at a single point. The value of P waves indices as intermediate phenotypes for AF risk may have been more apparent in subsequent ECGs as this cohort aged. Repeated measurements of P wave indices are also essential for understanding how these electrocardiographic measurements are altered with accumulation of cardiovascular risk factors. Third, this study was conducted in a selected cohort of European descent with minimum age of 60 years. Consequently, the generalizability to other ethnicities and to other age groups, even within the FHS, is limited. Fourth, subjects may have been mischaracterized, i.e., having transient or paroxysmal AF, which was not recognized by the FHS. Fifth, our results treated the 3 examined outcomes as independent events. The contribution of AF toward HF and mortality are well recognized and were not adjusted for in our analysis.19
Supplementary Material
Acknowledgments
This research was funded by Award 09FTF2190028 from the American Heart Association, Dallas, Texas to Dr. Magnani and Grants N01-HC 25195, RC1HL101056, and 1R01HL102214 (Dr. Benjamin), 1HL104156 (Dr. Ellinor), and HL092577 (Dr. Ellinor and Dr. Benjamin) from the National Institutes of Health, Bethesda, Maryland.
Footnotes
Publisher's Disclaimer: This is a PDF file of an unedited manuscript that has been accepted for publication. As a service to our customers we are providing this early version of the manuscript. The manuscript will undergo copyediting, typesetting, and review of the resulting proof before it is published in its final citable form. Please note that during the production process errors may be discovered which could affect the content, and all legal disclaimers that apply to the journal pertain.
References
- 1.Dawber TR, Meadors GF, Moore FE., Jr Epidemiological approaches to heart disease: the Framingham Study. Am J Public Health Nations Health. 1951;41:279–281. doi: 10.2105/ajph.41.3.279. [DOI] [PMC free article] [PubMed] [Google Scholar]
- 2.Kannel WB, Feinleib M, McNamara PM, Garrison RJ, Castelli WP. An investigation of coronary heart disease in families. The Framingham Offspring Study. Am J Epidemiol. 1979;110:281–290. doi: 10.1093/oxfordjournals.aje.a112813. [DOI] [PubMed] [Google Scholar]
- 3.Sagie A, Larson MG, Goldberg RJ, Bengtson JR, Levy D. An improved method for adjusting the QT interval for heart rate (the Framingham Heart Study) Am J Cardiol. 1992;70:797–801. doi: 10.1016/0002-9149(92)90562-d. [DOI] [PubMed] [Google Scholar]
- 4.Badilini F, Sarapa N. Implications of methodological differences in digital electrocardiogram interval measurement. J Electrocardiol. 2006;39(suppl):S152–S156. doi: 10.1016/j.jelectrocard.2006.05.030. [DOI] [PubMed] [Google Scholar]
- 5.Kligfield P, Badilini F, Brown B, Helfenbein E, Kohls M. The ISCE ECG genome pilot challenge: a 2004 progress report. J Electrocardiol. 2004;37(suppl):144–148. doi: 10.1016/j.jelectrocard.2004.08.039. [DOI] [PubMed] [Google Scholar]
- 6.Magnani JW, Mazzini MJ, Sullivan LM, Williamson M, Ellinor PT, Benjamin EJ. P wave indices, distribution and quality control assessment (from the Framingham Heart Study) Ann Noninvasive Electrocardiol. 2010;15:77–84. doi: 10.1111/j.1542-474X.2009.00343.x. [DOI] [PMC free article] [PubMed] [Google Scholar]
- 7.Cheng S, Keyes MJ, Larson MG, McCabe EL, Newton-Cheh C, Levy D, Benjamin EJ, Vasan RS, Wang TJ. Long-term outcomes in individuals with prolonged PR Interval or first-degree atrioventricular block. JAMA. 2009;301:2571–2577. doi: 10.1001/jama.2009.888. [DOI] [PMC free article] [PubMed] [Google Scholar]
- 8.D’Agostino RB, Sr, Vasan RS, Pencina MJ, Wolf PA, Cobain M, Massaro JM, Kannel WB. General cardiovascular risk profile for use in primary care: the Framingham Heart Study. Circulation. 2008;117:743–753. doi: 10.1161/CIRCULATIONAHA.107.699579. [DOI] [PubMed] [Google Scholar]
- 9.Kannel WB, D’Agostino RB, Silbershatz H, Belanger AJ, Wilson PW, Levy D. Profile for estimating risk of heart failure. Arch Intern Med. 1999;159:1197–1204. doi: 10.1001/archinte.159.11.1197. [DOI] [PubMed] [Google Scholar]
- 10.Levy D, Larson MG, Vasan RS, Kannel WB, Ho KK. The progression from hypertension to congestive heart failure. JAMA. 1996;275:1557–1562. [PubMed] [Google Scholar]
- 11.Wolf PA, D’Agostino RB, Belanger AJ, Kannel WB. Probability of stroke: a risk profile from the Framingham Study. Stroke. 1991;22:312–318. doi: 10.1161/01.str.22.3.312. [DOI] [PubMed] [Google Scholar]
- 12.Fox CS, Parise H, D’Agostino RB, Sr, Lloyd-Jones DM, Vasan RS, Wang TJ, Levy D, Wolf PA, Benjamin EJ. Parental atrial fibrillation as a risk factor for atrial fibrillation in offspring. JAMA. 2004;291:2851–2855. doi: 10.1001/jama.291.23.2851. [DOI] [PubMed] [Google Scholar]
- 13.Lloyd-Jones DM, Wang TJ, Leip EP, Larson MG, Levy D, Vasan RS, D’Agostino RB, Massaro JM, Beiser A, Wolf PA, Benjamin EJ. Lifetime risk for development of atrial fibrillation: the Framingham Heart Study. Circulation. 2004;110:1042–1046. doi: 10.1161/01.CIR.0000140263.20897.42. [DOI] [PubMed] [Google Scholar]
- 14.Schnabel RB, Sullivan LM, Levy D, Pencina MJ, Massaro JM, D’Agostino RB, Sr, Newton-Cheh C, Yamamoto JF, Magnani JW, Tadros TM, Kannel WB, Wang TJ, Ellinor PT, Wolf PA, Vasan RS, Benjamin EJ. Development of a risk score for atrial fibrillation (Framingham Heart Study): a community-based cohort study. Lancet. 2009;373:739–745. doi: 10.1016/S0140-6736(09)60443-8. [DOI] [PMC free article] [PubMed] [Google Scholar]
- 15.Soliman EZ, Prineas RJ, Case LD, Zhang ZM, Goff DC., Jr Ethnic distribution of ECG predictors of atrial fibrillation and its impact on understanding the ethnic distribution of ischemic stroke in the Atherosclerosis Risk in Communities (ARIC) study. Stroke. 2009;40:1204–1211. doi: 10.1161/STROKEAHA.108.534735. [DOI] [PMC free article] [PubMed] [Google Scholar]
- 16.Sanders P, Morton JB, Davidson NC, Spence SJ, Vohra JK, Sparks PB, Kalman JM. Electrical remodeling of the atria in congestive heart failure: electrophysiological and electroanatomic mapping in humans. Circulation. 2003;108:1461–1468. doi: 10.1161/01.CIR.0000090688.49283.67. [DOI] [PubMed] [Google Scholar]
- 17.Gunduz H, Binak E, Arinc H, Akdemir R, Ozhan H, Tamer A, Uyan C. The relationship between P wave dispersion and diastolic dysfunction. Tex Heart Inst J. 2005;32:163–167. [PMC free article] [PubMed] [Google Scholar]
- 18.Magnani JW, Williamson MA, Monahan KM, Ellinor PT, Benjamin EJP. Wave indices: current status and future directions in epidemiology, clinical and research applications. Circ Arrhythmia Electrophysiol. 2009;2:72–79. doi: 10.1161/CIRCEP.108.806828. [DOI] [PMC free article] [PubMed] [Google Scholar]
- 19.Wang TJ, Larson MG, Levy D, Vasan RS, Leip EP, Wolf PA, D’Agostino RB, Murabito JM, Kannel WB, Benjamin EJ. Temporal relations of atrial fibrillation and congestive heart failure and their joint influence on mortality: the Framingham Heart Study. Circulation. 2003;107:2920–2925. doi: 10.1161/01.CIR.0000072767.89944.6E. [DOI] [PubMed] [Google Scholar]
Associated Data
This section collects any data citations, data availability statements, or supplementary materials included in this article.