

Abstract
While many individual transcription factors are known to regulate hematopoietic differentiation, major aspects of the global architecture of hematopoiesis remain unknown. Here, we profiled gene expression in 38 distinct purified populations of human hematopoietic cells and used probabilistic models of gene expression and analysis of cis-elements in gene promoters to decipher the general organization of their regulatory circuitry. We identified modules of highly co-expressed genes, some of which are restricted to a single lineage, but most are expressed at variable levels across multiple lineages. We found densely interconnected cis-regulatory circuits and a large number of transcription factors that are differentially expressed across hematopoietic states. These findings suggest a more complex regulatory system for hematopoiesis than previously assumed.
Introduction
Hematopoiesis is an ideal model for the study of multi-lineage differentiation in humans. More than 2 × 10¹¹ hematopoietic cells from at least 11 lineages are produced daily in humans from a small pool of self-renewing adult stem cells (Quesenberry and Colvin, 2005). Production of each cell type is highly regulated and responsive to environmental stimuli. Mutations or aberrant expression of regulatory proteins cause both benign and malignant hematologic disorders.
The hematopoietic system is also well-suited for an analysis of the global architecture of the molecular circuits controlling human cellular differentiation. Hematopoietic stem cells, progenitor cells, and terminally differentiated cells can be isolated using flow cytometry. Moreover, many aspects of hematopoietic differentiation can be recapitulated in vitro. Finally, high-speed multiparameter flow cytometry and cDNA amplification procedures allow us to purify and profile gene expression from rare subpopulations (Ebert and Golub, 2004).
A dominant model of hematopoiesis posits that it is controlled by a hierarchy of a relatively small number of critical transcription factors (TFs) that are sequentially expressed, are largely restricted to a specific lineage, and can interact directly to mediate and reinforce cell-fate decisions (Iwasaki and Akashi, 2007). Genetically engineered mice have been used to map the maturation stage at which key TFs are essential (Orkin and Zon, 2008)
Recent genome-wide studies suggest a more complex architecture in regulatory circuits, involving larger numbers of TFs that control different combinations of modules of co-expressed genes (Amit et al., 2009; Suzuki et al., 2009). Complex circuits with a larger number of TFs than previously assumed, each with a major regulatory effect, are emerging from studies in immune cell types (Amit et al., 2009; Suzuki et al., 2009), stem cell populations (Muller et al., 2008) and cell differentiation in invertebrates (Davidson, 2001).
These two views leave open several key questions in understanding the regulatory architecture of human hematopoiesis. (1) Are distinct hematopoietic cell states characterized mostly by induction of lineage-specific genes, or by a unique combination of modules, where the distinct capacities of each cell type are largely determined through the re-use of modules? (2) Is hematopoiesis determined solely by a few master regulators, or does it involve a more complex network with a larger number of factors? (3) What are the regulatory mechanisms that maintain cell state in the hematopoietic system and how do they change as cells differentiate?
Here, we measured mRNA profiles in 38 prospectively purified cell populations, from hematopoietic stem cells, through multiple progenitor and intermediate maturation states, to 12 terminally differentiated cell types (Figure 1). We found distinct, tightly integrated, regulatory circuits in hematopoietic stem cells and differentiated cells, implicated dozens of new regulators in hematopoiesis, and demonstrated a substantial re-use of gene modules and their regulatory programs in distinct lineages. We validated our findings by experimentally determining the binding sites of four TFs in hematopoietic stem cells, by examining the expression of a set of 33 TFs in erythroid and myelomonocytic differentiation in vitro, and by investigating the function of 17 of these TFs using RNA interference. Our data provides strong evidence for the role of complex interconnected circuits in hematopoiesis and for ‘anticipatory binding’ to the promoters of their target genes in hematopoietic stem cells. Our dataset and analyses will serve as a comprehensive resource for the study of gene regulation in hematopoiesis and differentiation.
Figure 1. Hematopoietic differentiation.

The 38 hematopoietic cell populations purified by flow sorting and analyzed by gene expression profiling are illustrated in their respective positions in hematopoiesis. Grey - hematopoietic stem cell (HSC1,2), common myeloid progenitor (CMP), megakaryocyte/erythroid progenitor (MEP); Orange - erythroid cells (ERY1-5); Red – CFU-MK (MEGA1) and megakaryocyte (MEGA2); Purple - granulocyte/monocyte progenitor (GMP), CFU-G (GRAN1), neutrophilic metamyelocyte (GRAN2), neutrophil (GRAN3), CFU-M (MONO1), monocytes (MONO2), eosinophil (EOS), and basophil (BASO); Blue - myeloid dendritic cell (DENDa2) and plasmacytoid dendritic cell (DENDa1); Light green - early B-cell (Pre-BCELL2), pro-B-cell (Pre-BCELL3), naïve B-cell (BCELLa1), mature B-cell, class able to switch (BCELLa2), mature B-cell (BCELLa3), and mature B-cell, class switched (BCELLa4); Dark green - mature NK cell (NK1-4); Turquoise - naïve CD8+ T-cell (TCELL2), CD8+ effector memory RA (TCELL1), CD8+ effector memory (TCELL3), CD8+ central memory (TCELL4), naïve CD4+ T-cell (TCELL6), CD4+ effector memory (TCELL7), and CD4+ central memory (TCELL8). See Table S1 for markers information.
Results
An expression map of hematopoiesis reveals cell state-specific profiles
We defined 38 distinct cell states based on cell surface marker expression, representing hematopoietic stem and progenitor cells, terminally differentiated cells, and intermediate states (Figure 1, Table S1). For each state, we purified samples separately from 4 to 7 independent donors by multiparameter flow cytometry (Experimental Procedures), yielding 211 samples. Cells from all stem and progenitor populations were purified from umbilical cord blood. Terminally differentiated lymphocyte populations were purified from peripheral blood, as terminal differentiation is completed in these cells upon exposure to antigens after birth (Table S1). In all cases, cells were harvested fresh, and were processed and sorted immediately. We isolated mRNA from each cell type and measured expression profiles using Affymetrix microarrays (Experimental Procedures).
The global transcriptional profiles are consistent with the established topology of hematopoietic differentiation. Replicate samples from a single state but different donors and samples from multiple states within a lineage are highly correlated with each other, and profiles from related lineages are also similar (Figure 2A). Notably, hematopoietic stem cell (HSC) samples do not form a separate cluster, but are highly similar to early progenitors in the megakaryocyte/erythrocytes lineage (MEGA/ERY), suggesting that their transcriptional state is largely maintained in some of the early progenitors. These findings are also apparent in a systematic unsupervised analysis, using non-negative matrix factorization (NMF) (Brunet et al., 2004) (Figure S1A), and hierarchical clustering (Figure S1B). We further validated our dataset by confirming that previously published lineage-specific gene signatures are significantly enriched in the expected lineage compared to other lineages (FDR < 0.25, Figure S1C, Supplementary Experimental Procedures).
Figure 2. A transcriptional map of hematopoietic differentiation identifies lineage specific transcription.
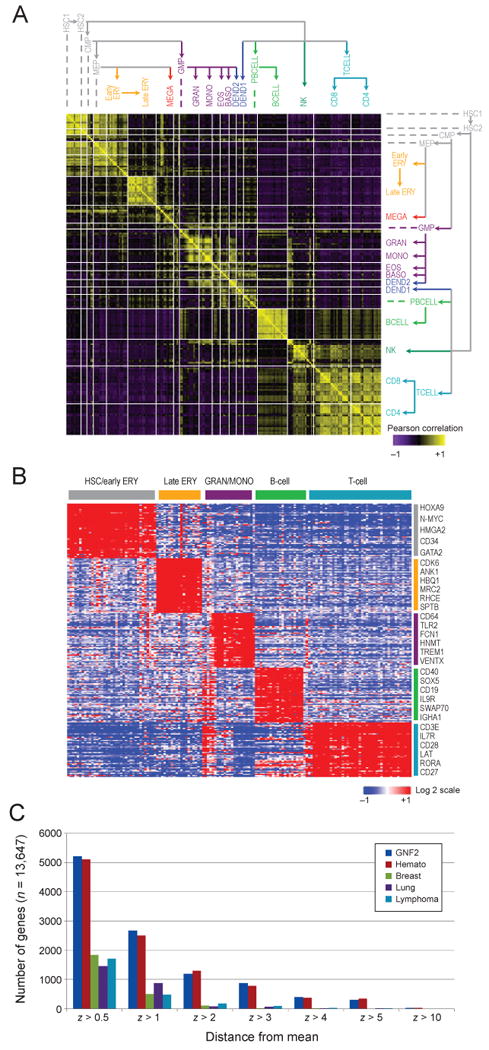
(A) Similarity in global expression profiles between proximate differentiation states. The heat map shows the pair-wise Pearson correlation coefficients between all 211 samples, ordered according to the differentiation tree (right and top). A positive correlation is portrayed in yellow and a negative correlation in purple. (B) Signature genes characterizing the five main lineages. Expression levels are shown for the top 50 marker genes (rows) for each of four major lineages plus hematopoietic stem and progenitor cells. High relative expression is shown in red, and low relative expression in blue; the expression of each gene is normalized to a mean expression of zero across all the samples; labels as in Figure 1. Genes were selected by high expression in one lineage compared to the others (t-test). (C) The number of genes that are differentially expressed, according to an outlier statistic, was calculated for all hematopoietic cell states profiled (red), a compendium of 79 tissues in the GNF atlas (Su et al., 2004) (blue) and datasets of lymphomas (Monti et al., 2005) (turquoise), lung cancers (Bhattacharjee et al., 2001) (purple), and breast cancers (Chin et al., 2006) (green). See also Figure S1.
Unique and complex gene signatures characterize distinct hematopoietic lineages
In a supervised analysis we found that each of the five dominant states in our dataset – HSPCs, differentiated erythroid cells, granulocytes/monocytes B cells, and T cells – is distinguished by a set of significantly differentially expressed genes specific to each lineage as compared to the others (Figure 2B, Table S2). Some of these genes are expressed more than 100-fold higher in one cell type (e.g. granzyme genes in certain T-cell and NK-cell populations, PROM1 (CD133 antigen) and HOXA9 in stem and progenitor cells).
The signature genes are enriched for molecular functions and biological processes consistent with the functional differences between lineages (Figure S1D, Table S2). Notably, a set of 16 genes comprised of the 5′ partners of known translocations in leukemias (Mitelman et al., 2010) is enriched in the HSPC population (P<0.013). This suggests that the 5′ partners of leukemia-causing translocations, containing the promoters of the fusion genes, tend to be selectively expressed in stem and progenitor cell populations.
The diversity of gene expression across hematopoietic lineages is comparable to the diversity in gene expression observed across a host of human tissue types. The number of genes that are differentially expressed throughout our hematopoiesis dataset (Outlier Analysis (Tibshirani and Hastie, 2007), Supplemental Experimental Procedures), is comparable to that determined for an atlas of 79 different human tissues (Su et al., 2004), and far higher than in lymphomas (Monti et al., 2005), lung cancers (Bhattacharjee et al., 2001), or breast cancers (Chin et al., 2006) (Figure 2C).
Coherent functional modules of co-expressed genes are re-used across lineages
To dissect the architecture of the gene expression program, we used the Module Networks (Segal et al., 2003) algorithm (Experimental Procedures) to find modules of strongly co-expressed genes, and associate them with candidate regulatory programs that (computationally) predict their expression pattern. We identified 80 gene modules (Figure 3A; modules are numbered arbitrarily by the algorithm), covering the 8968 genes that are expressed in the majority of the samples of at least one cell population. The genes in each of the modules are tightly co-expressed (Figure S2), the 80 modules have largely distinct expression patterns (Figures 3A and S2), and are enriched for genes with distinct biological functions (Figure 3B, Table S3).
Figure 3. Expression pattern and functional enrichment of 80 transcriptional modules.

(A) Average expression levels of 80 gene modules. Shown is the average expression pattern of the gene members in each of the 80 modules (rows) across all 211 samples (columns). Colors and normalization as in Figure 2B. The samples are organized according to the differentiation tree topology (top) with abbreviations as in Figure 1. The number of genes in each module is shown in the bar graph (left). The expression profiles of a few example modules discussed in the text are highlighted by vertical yellow lines. The expression of individual genes in each module is shown in Figure S2. (B) Functional enrichment in gene modules. Functional categories with enriched representation (FDR < 5%) in at least one module are portrayed. Categories were selected for broad representation. The complete list appears in Table S3. See also Figures S2 and S7.
A small number of modules are expressed in very specific cell states and reflect the unique functional capacities of a single lineage. For example, Module 889 is expressed in terminal erythroid differentiation and is enriched for genes encoding blood group antigens and organic cation transporters; Module 691 is expressed in B lymphocytes and is enriched for genes encoding immunoglobulins and BCR signaling pathway components; and Module 721 is expressed in granulocytes and monocytes and includes genes encoding enzymes and cytokine receptors essential for inflammatory responses.
Conversely, most modules are expressed at varying levels across multiple lineages, suggesting re-use of their genes in multiple hematopoietic contexts. These include modules expressed in both HSC and progenitor populations (e.g. #865, 679, 805), in both B and T cells (e.g. #673, 703), in both granulocyte/monocyte populations and lymphocytes (e.g. #817, 799, 649), and across all myeloid (e.g. #583) or all lymphoid cells (e.g. #931).
Re-use of modules reflects the differential functional requirements for specific biochemical programs in the various cell states. For example, mitochondrial and oxidative phosphorylation modules (e.g. #847, 583, 883) are induced in erythroid progenitors that produce high levels of heme and are affected most by mitochondrial mutations (Chen et al., 2009; Fontenay et al., 2006), as well as in granulocytes and monocytes, which are capable of a respiratory burst following phagocytosis.
Module states persist through multiple differentiation steps
To delineate the relation between gene expression and differentiation, we projected each module's expression pattern onto the known topology of the differentiation tree (Figures 4 and S4). For example, consider Module 865 (Figures 4A and S3), which is strongly induced in hematopoietic stem and progenitor cells and contains genes encoding key HSPC cell surface markers (CD34 and CD117) and transcriptional regulators (GATA2, HOXA9, HOXA10, MEIS1, and N-MYC). By projecting the module on the differentiation tree, we observe that its induced state in HSCs persists through several consecutive differentiation steps and is repressed at three main points (arrowheads, Figure 4A): (1) after the granulocyte/monocyte progenitor, (2) after erythroid progenitors, and (3) in the differentiation of HSCs towards the lymphocyte lineage.
Figure 4. Propagation and transitions in modules' expression along hematopoiesis.

Shown are the mean expression levels of the module's genes in each cell state (colored squares), and selected changes in the predicted regulators, as highlighted in the text (upward arrowhead – regulator induced; downward arrowhead – regulator repressed). Member genes (rather than regulators) in each module encoding TFs are noted below each module, as these may reflect alternative regulators at the same differentiation points. TFs that were validated as regulators of erythroid or granulocyte/monocyte differentiation in a functional assay (Figure 7) are highlighted in bold. The color bar at the bottom of each tree denotes the key lineages, as in Figure 1. (A) HSC and progenitor expression in Module 865; (B) Lineage specific induction in late erythrocytes in Module 727; (C) Lineage specific induction in granulocytes and monocytes in Module 721; (D) Lineage specific induction in B cells in Module 589; (E) One-sided propagation of induced state from HSC to the erythroid lineage in Module 655. (F) Re-use of Module 817, which is inactive in HSCs and independently induced in both lymphoid cells and granulocytes. See also Figures S3 and S4.
We identified a host of such differentiation-associated patterns in gene regulation. One major pattern (31 modules) is HSC persistent states: such modules are active in the HSC state and persist in an active state in several progenitor populations, on either the erythroid/myeloid branch (Figure 4A,E), the lymphoid branch (Figure S4A), or both (Figure S4B,H). The HSC state changes gradually at different points in different modules. Indeed, only Module 631 (Figure S4C) is primarily HSC specific and includes the known stem cell-specific TFs NANOG and SMAD1 (Xu et al., 2008). In other patterns, modules have low or inactive expression in HSCs, but are activated in a single lineage (10 modules), on either the erythroid/myeloid branch (Figure 4B,C, S4D), or the lymphoid branch (Figure 4D). In most cases (39 modules), modules are inactive in HSPCs but are activated in multiple independent lineages (Figure 4F, S4F).
A sequence-based model of the regulatory code
The high degree of co-expression of genes within modules suggests that they may be co-regulated by common transcriptional circuits. We therefore examined each module for enrichment of known and novel cis-regulatory elements in their promoters (Supplemental Experimental Procedures). We used six motif-finding methods and a motif clustering pipeline to identify a non-redundant library of enriched elements. We scored each module for the enrichment of each of the novel sites or of known elements or binding events (Sandelin et al., 2004; Subramanian et al., 2005) (Supplemental Experimental Procedures). We identified 156 sequence motifs and 28 binding profiles of 12 TFs (measured by ChIP), that were enriched in the promoters of at least one module (Data available on http://www.broadinstitute.org/dmap/). Of these, 66 are previously unannotated motifs and 118 are associated with 72 TFs (Table S4).
Of these 72 TFs, 11 are known hematopoietic factors (Table S4), and their sites are often enriched in modules consistent with their known functions. For example, the site for the erythroid TF GATA1 (Pevny et al., 1991) is enriched in the late erythroid Module 889, and sites for the lymphocyte regulators Helios and NFATC (Aramburu et al., 1995; Hahm et al., 1998) are enriched in the T and NK Module 559. We also found significant enrichments for TFs with roles in other differentiation processes, which were not previously implicated in hematopoiesis, such as HNF4 alpha (in the HSPC Module 865) and HNF6 (in the lymphoid Modules 859 and 961).
Tightly integrated cis-regulatory circuits govern differentiation states
To explore how these cis-regulatory associations can give rise to stable cell states, we assembled the regulatory circuits connecting the 276 TFs that were enriched in any gene-set with each other (Figure 5). We connected an edge from each factor with a known motif to all the factors that harbor this motif in their gene promoters (Supplemental Experimental Procedures), and focused only on those factors that were expressed in a given cell state. For example, the circuit of HSC-expressed TFs with known binding sites (Figure 5A) includes many major known regulators of the HSC state (Orkin and Zon, 2008), which are densely interconnected through auto-regulatory (12 of 23 active factors), feedback (15 and 39 loops of size 2 and 3) and feed-forward (206 loops of size 3) loops. Abnormal expression of many of the circuit's TFs is known to cause hematologic malignancies (Look, 1997). This integrated circuitry can give rise to a robust transcriptional network in terminally differentiated cells and HSCs. Notably, since the sequence of the binding site for most TFs is unknown, including 66 of the putative enriched binding sites, the density of regulation is likely even greater than we observed.
Figure 5. Dynamic organization of tightly integrated cis-regulatory circuits in HSCs and erythroid cells.
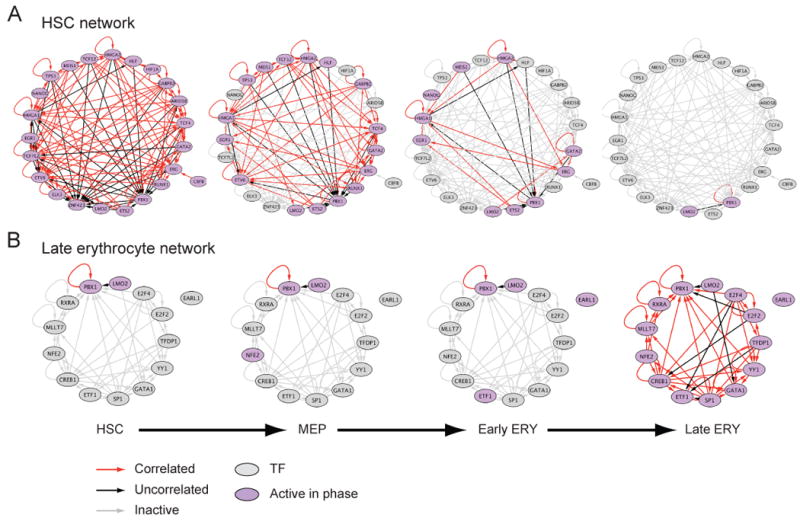
(A,B) Shown are cis-regulatory networks between TFs (nodes) that are enriched in at least one gene-set, and are expressed (fold-change > 1.5) in (A) HSCs or (B) late erythroid cells. Nodes represent TFs that are active (purple) or non-active (grey) in each of the 4 phases of the erythroid lineage (HSC, MEP, Early ERY, Late ERY). An edge from node a to node b indicates that the promoter of the gene in node b has a binding site for the TF encoded by the gene in node a. Edge colors indicate the Pearson correlation between the expression profiles of the TFs in the connected nodes: red – positive correlation (coefficient > 0.4), black – no correlation (absolute Pearson ≤ 0.4), grey – non-active edge (at least one of the two connected nodes was not expressed in that phase). See Table S4 for enriched motif information.
During the course of differentiation, the HSC circuit gradually disappears along multiple lineages due to loss of expression of the relevant TFs (Figure 5A and data available on http://www.broadinstitute.org/dmap/). Conversely, in terminally differentiated cells, other dense circuits emerge, through the induction of other TFs. For example, the 14 factors in the erythroid circuit include many of the known major regulators of erythroid differentiation (Cantor and Orkin, 2002), including GATA1, LMO2, FOXO4, NFE2 and RXRA (Figure 5B). We find similarly distinct networks in the granulocyte lineage, T cells, and B cells.
Hundreds of transcription factors are differentially expressed across lineages in coherent modules
The dense regulatory circuits between TFs in our sequence-based model suggest that the expression of TF genes is likely to be highly regulated in hematopoiesis. Indeed, supervised analysis finds that many TF genes are strongly differentially expressed in each primary lineage (Figures 6A and S5A), and that the diversity of TF gene expression is comparable between hematopoiesis and the tissue compendium (Su et al., 2004) (Figure S5B).
Figure 6. Lineage specific regulation of TF expression.

Signature TF genes with lineage-specific expression in the five main lineages. Shown are the expression levels of the top 50 marker TF genes (rows) selected for each of four major lineages plus hematopoietic stem and progenitor cells (labels as in Figure 1). Genes were selected by high expression in one lineage compared to the others (t-test). High expression is shown in red, and low expression in blue; the expression of each gene is normalized to a mean expression of zero across all the samples. See also Figures S5 and S6.
Some TFs are expressed predominantly in a single lineage, including well-studied TFs that are known to be essential for differentiation in HSCs or a particular lineages (Figure S6). However, the expression of those factors often increases gradually along differentiation (Figure S6D,H,I), similar to the gradations observed in gene modules (Figure 4 and S4).
Many other TFs are ‘re-used’ across lineages, either through persistent expression from a single progenitor population or by independent activation in multiple lineages (Figures 4 and S4). For example, Module 793 (Figure S4F), which is induced in both B cells and late erythroid cells, includes several TFs and chromatin regulators. Among these, KLF3 has a reported role in erythroid cells (Funnell et al., 2007), while NFAT5 has a demonstrated function in B cells (Kino et al., 2009).
Many TFs – not previously associated with these lineages – are expressed similarly to known factors, and belong to the same modules, suggesting that the transcriptional circuit consists of a greater number of TFs than previously assumed. For example, the late erythroid Module 727 (Figure 4B) contains four TFs: two are known erythroid TFs (GATA1 and FOXO3A) (Bakker et al., 2007), whereas the others (NFIX1, MYT1) were not previously linked to erythropoiesis. Similarly, the granulocytes/monocytes Module 721 (Figure 4C) contains eight TFs, only two with known roles in the lineage (CEBPA, PU.1/SPI1).
An expression-based model of the regulatory code of hematopoiesis identifies putative regulators controlling changes in differentiation
To identify the potential regulatory role of differentially expressed TFs, we examined the combinations of TFs (regulatory program) which the Module Networks algorithm (Segal et al., 2003) used in order to ‘explain’ the expression of each of the 80 modules (Experimental Procedures). For example, the algorithm associated Module 865 (Figure S3, bottom) with five regulators, most prominently PBX1 (‘top regulator’), SOX4 (‘2nd level regulator’) (Figure S3, top). It predicts that when both PBX1 and SOX4 are induced (in HSCs, CMPs, MEPs, GMPs, early ERY and early MEGA cells) the module's genes are induced too. PBX1 is an established regulator of HSPCs, and SOX4 has recently been shown to be a direct target of HOXB4, a known HSC regulator (Lee et al., 2010), supporting the algorithm's result. The regulators were chosen by their expression alone, and while the model chooses one combination of ‘representative’ regulators, there may be several highly similar TFs that could fulfill the role.
We next interpreted these regulatory connections within the context of the lineage tree., We associated each regulator with the tree positions (Figure 4 and S4, arrowheads), in which a change in the regulator's expression is associated with a change in the module's expression. For example, there are four such positions for PBX1 and SOX4 in Module 865 (Figure 4A, arrowheads), including the association between the repression of PBX1 and the repression of the module in differentiation towards lymphoid lineages (downward arrows, labeled PBX1, Figure 4A). In this way, we predict the roles of distinct TFs at distinct differentiation points, such as MNDA at the granulocyte/monocytes progenitor (Figure 4C, S4G) or NCOA4 and KLF1 at late erythrocytes (Figure S4D).
Overall, the algorithm associated 220 TFs (Table S3) with at least one regulatory program, and 63 TFs as ‘top’ regulators (e.g. Figure S3, top) of at least one module. These include 15 TFs previously associated with hematopoiesis (e.g. TAL1, KLF1, BCL11b, LMO2 and MYB), and 7 associated with differentiation in other systems (e.g. CREG1, MEF2A and NHLH2). For example, we correctly found HOXA9 associated with HSPCs and early erythroid induction (Module 679); NFE2, RXRA, KLF1, and FOXO3 associated with late erythroid induction (Modules 727, 895, 889, and 739, Figure 4B and S5D), HIVEP2 and BCL11b associated with T cell induction (Modules 859, 949, and 667); and HOXC4 and POU2AF1 associated with B cell induction (Module 589, Figure 4D). In addition, the algorithm predicted a regulatory role for proteins that were not previously associated with regulating hematopoietic differentiation (e.g. MNDA, NCOA4). The selected regulators are enriched for TFs that are known to participate as 3′ partners in fusions in hematologic cancers (Mitelman et al., 2010) (25 of the regulators, P<0.028), consistent with a regulatory role in hematopoiesis.
Finally, we compared the predictions of the expression- and sequence-based models. The two models were different, due to two reasons. First, 85% of the TFs chosen as regulators in the expression model (187 of 220) do not have a characterized binding motif in current databases and cannot be identified in the sequence model. Second, 29 of 41 TFs (70%) whose known sites are incorporated in the sequence model, and appear in the expression model, show little or no correlation in expression (absolute Pearson < 0.4) to the module with which they are associated in the sequence model (Data available on http://www.broadinstitute.org/dmap/). Thus, the two models are likely complementary, each capturing a substantial but distinct number of known regulators in the relevant states. To gain confidence in their predictions, we next pursued experimental approaches.
Direct targets of MEIS1, TAL1, IKAROS, and PU.1 in HSPCs reveal dense circuits and anticipatory binding
To validate and further investigate the gene modules and cis-circuits, we examined the direct binding of TFs across the genome using chromatin immunoprecipitation followed by sequencing (ChIP-Seq) in HSPCs. We analyzed the binding of MEIS1, TAL1, PU.1/SPI1 and IKAROS/IKZF1, four key regulators of the specification, maintenance or differentiation of HSCs (Argiropoulos et al., 2007; Lecuyer and Hoang, 2004; Ng et al., 2007; Singh et al., 1999), in two replicates, often in independently expanded populations of primary human HSPCs (Supplemental Experimental Procedures). We scored each experiment for statistically significant binding (Supplemental Experimental Procedures, Table S5), and tested each of our expression modules for enrichment in binding events (Table S5).
In modules whose genes are highly induced in terminal differentiation, we found enrichment of binding by corresponding lineage specific factors in HSPCs, suggesting ‘anticipatory’ regulation. For example, Module 727 (Figure 4B), expressed in terminally differentiated erythroid cells, was enriched with target genes bound by in HSPCs by TAL1, an erythroid transcription factor (Table S5). Similarly, genes in the granulocyte/monocyte Module 763 were enriched for targets bound by PU.1 in HSPCs (Table S5); and genes in the lymphoid Module 949 were enriched for target genes bound by IKAROS in HSPCs (Table S5). In many (but not all) cases, expression of the target module is already moderate in HSCs, and increases with differentiation. This strongly supports an ‘anticipatory’ regulation, where relevant differentiation TFs are bound at target promoters in HSPCs, resulting in mild expression of targets which persists and further increases upon differentiation.
Some of our expression-based model's predictions for HSPCs are supported by the ChIP-Seq data. For example, the two modules that are induced in HSPCs and are associated in our model with either MEIS1 (Module 961) or its known binding partner PBX1 (Module 865, Figure 4A) are enriched in target genes bound by MEIS1. MEIS1 and HOXA9 are members of Module 865 consistent with MEIS1's auto-regulatory binding (Table S5). The ChIP-Seq data also support module re-use. For example, several of the modules enriched with PU.1 are ‘re-used’ in granulocytes and B lymphoid cells (e.g., Modules 853. 649, 979, 769 and 817), consistent with an established role for PU.1 in both lineages. In other cases module re-use may be mediated by combinatorial binding of two factors (e.g. by both PU.1 and IKAROS in Module 607 which is expressed in granulocytes, monocytes and some lymphoid cells).
The individual binding events in our profiles also support the overall organization observed in the cis-circuits in the sequence model. First, three of the factors bind their own promoter (IKAROS and MEIS1) or enhancer (PU.1), forming auto-regulatory loops, as observed for many known master regulators (Boyer et al., 2005) and in our sequence model. Second, PU.1, IKAROS and MEIS1 are integrated in a feed-forward loop. Third, there is a significant overlap between the targets of any pair of factors (Table S5). Finally, in aggregate, the factors bind 13 of the 23 other TFs in our HSC circuit, further increasing its density.
Differential expression of candidate transcription factors during in vitro differentiation
We confirmed the lineage-specific expression of 33 TFs in primary human hematopoietic progenitor cells induced to differentiate in vitro. We focused on the erythroid and myelomonocytic lineages, as differentiation of primary human hematopoietic progenitor cells can be faithfully recapitulated and genetically manipulated along these lineages in vitro. We selected a set of 33 TFs identified in either the sequence or gene expression-based models as candidate regulators of these two lineages.
We developed a quantitative, multiplexed assay to detect the expression of the signature genes in a single well using ligation mediated amplification (LMA) followed by amplicon detection on fluorescent beads (Peck et al., 2006). We cultured primary human CD34+ cells from adult bone marrow in vitro in cytokine conditions promoting either erythroid or myelomonocytic differentiation. We harvested cells at 12 time points between days 3 and 10 of erythroid and myelomonocytic differentiation and determined TF gene expression using the multiplexed bead-based assay. We confirmed that the 33 TFs are differentially expressed between the two lineages, providing a robust expression signature that can distinguish between the two states independent of profiling platform, in cells derived from adult bone marrow or umbilical cord blood, and in cells that differentiated in vivo or in vitro (Figure 7A).
Figure 7. Experimental validation of 33 TFs.
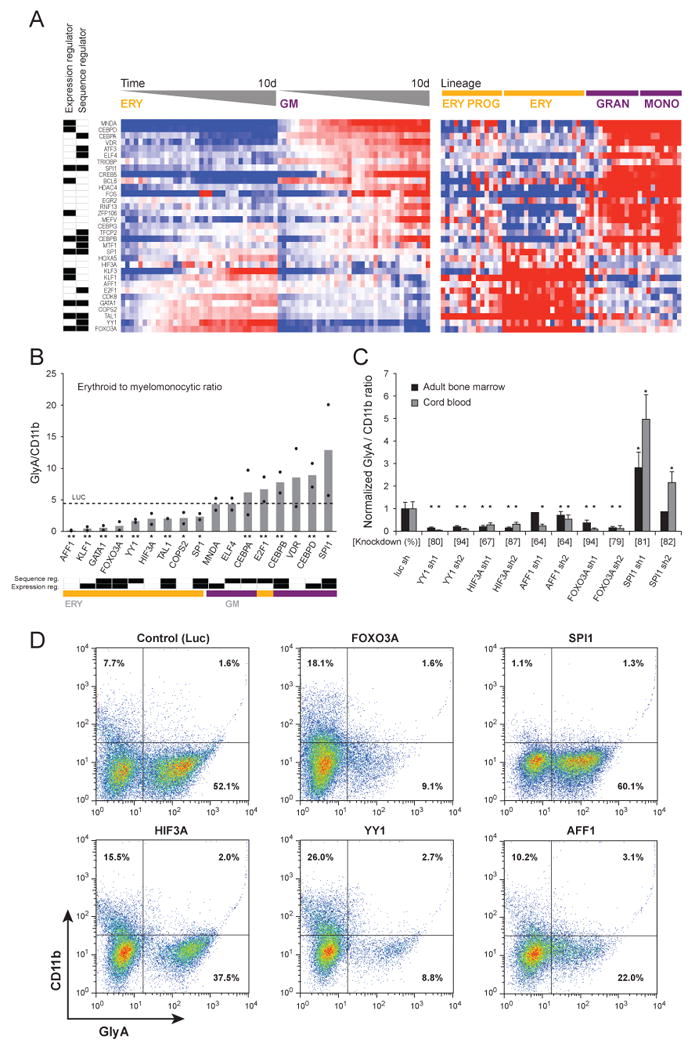
(A) The expression of 33 TFs was detected in primary human bone marrow CD34+ progenitor cells undergoing differentiation in vitro, harvested at 12 time points between days 3 to 10 of differentiation, and detected by a multiplexed assay using LMA followed by fluorescent bead-based detection (left heat map). In the heat map in the right panel, the expression of the same TFs in the original Affymetrix dataset is illustrated. The labels at the far left indicate whether the TF was chosen as a regulator in the expression-based model or in the sequence-based model. (B) Differentiation following TF silencing with shRNA. Human bone marrow CD34+ cells expressing shRNAs targeting TFs were induced to differentiate in-vitro for 10 days, and the ratio of erythroid (glycophorin A positive) and myelomonocytic (CD11b positive) cells was measured by flow cytometry. Each black dot represents an individual shRNA (mean of three replicates), and bars indicate their average. The effect of a control shRNA targeting the luciferase gene, which is not expressed in human cells, is indicated with a dashed line. Below the shRNA labels, * or ** indicates p < .05 for one or both shRNAs, respectively. Bottom – classification of the TFs according to their roles in the expression-based and sequence-based models, and to their induction pattern in the LMA profiling. (C) The effects of additional shRNAs targeting candidate TFs expressed in CD34+ cells derived from both umbilical cord blood and adult bone marrow and assayed as in panel B (* indicates p < .01). (D) Representative flow cytometry scatter plots from shRNAs expressed in umbilical cord blood. See additional information in Tables S5, S6 and S7.
Changes in expression levels in transcription factor circuits functionally modulate differentiation in vitro
We next tested whether acute loss of expression of each TF using RNA interference can functionally affect erythroid and myelomonocytic differentiation. We used our multiplexed bead-based assay to identify short hairpin RNAs (shRNAs) that effectively knockdown each TF, and found 17 genes, with at least two different effective shRNAs. Next, we infected primary human adult bone marrow CD34+ cells with the validated lentiviral shRNAs, cultured the cells in cytokine conditions supporting both erythroid and myelomonocytic differentiation, and assessed the number of erythroid (glycophorin A positive) cells relative to myelomonocytic (CD11b positive) cells by flow cytometry (Figure 7B). In most cases, the shRNA perturbation dramatically altered differentiation, with the ratio of erythroid to myeloid cells ranging from less than 1:10 to more than 10:1 with different shRNAs.
The perturbations associated with the lowest fraction of erythroid cells in culture corresponded to the samples expressing shRNAs targeting 9 TFs expressed at higher levels in the erythroid lineage (Table S6). Consistent with our models, six were regulators in either the expression or the sequence model, and the other three members of erythrocyte induced modules (Figure 7B, bottom). These include GATA-1 and KLF1, TFs with well-established roles in erythroid differentiation, (Funnell et al., 2007; Pevny et al., 1991), and TAL1 and FOXO3A, which have been implicated in erythroid differentiation (Aplan et al., 1992; Bakker et al., 2007). The TF YY1 was identified in our sequence-based models, has higher expression in erythroid cells, and was functionally validated by our shRNA screen. A physical association between YY1 and GATA-1 was reported in the chicken α-globin enhancer (Rincon-Arano et al., 2005). Finally, we validated a new role for HIF3A and AFF1 (AF4) in erythroid differentiation based on module membership and perturbation. Notably, AFF1 is a common translocation partner with the MLL gene in leukemia (Li et al., 1998).
Conversely, 8 perturbations resulted in the lowest fraction of myelomonocytic cells and corresponded to samples expressing shRNAs targeting 7 TFs induced in granulocyte/monocyte cells and one (E2F1) with higher expression in erythroid cells. Four TFs were predicted by the expression model to regulate modules induced in granulocytes/monocytes and five were predicted in the sequence network (Figure 7B, bottom). These include the well-established granulocyte/monocyte TFs, PU.1/SPI1 and C/EBP family members (Hirai et al., 2006; Scott et al., 1994), and VDR, a gene that has been implicated in myeloid differentiation (Liu et al., 1996).
We further validated three TFs that had not previously been associated with erythroid differentiation (AFF1, HIF3A, and YY1) alongside a known erythroid regulator (FOXO3A) and a known granulocyte regulator (PU.1/SPI1) (Figure 7C,D). We tested additional shRNAs for each gene by quantitative PCR and identified two shRNAs per gene that decrease expression of their target genes by 63 to 95% in human CD34+ cells derived from both adult bone marrow and umbilical cord blood. Using flow cytometry for lineage-specific markers following 10 days of differentiation, we validated our initial findings that AFF1, HIF3A, and YY1 decrease the relative production of erythroid lineage cells. These results are further supported by profiling mRNA levels following knockdown of these five TFs at 4 days following lentiviral infection. Compared to a control shRNA, gene expression in cells expressing AFF1, HIF3A, and FOXO3A were anti-correlated with erythroid profiles and positively correlated with granulocytes (Figure S5C) and knockdown of PU.1/SPI1 had the inverse pattern, as expected. Knockdown of YY1 caused a transcriptional profile more similar to HSCs, indicating a more substantial block in terminal differentiation. Taken together, our findings indicate that modulating the expression of TF genes can powerfully alter hematopoietic differentiation.
Web-based portal as a research resource
To facilitate interrogation of our hematopoietic gene expression database by the broader scientific community, we have created a Web-based portal (http://www.broadinstitute.org/dmap), providing access to the primary data, sample information, processed results from both models, and a suite of analytic tools.
Discussion
General principles of transcriptional circuits in differentiation
The changes in gene expression over the course of hematopoietic differentiation are profound. The number of differentially expressed genes is similar within hematopoiesis and across human tissues, suggesting comparable complexity. Our findings reveal several major principles about the organization of this transcriptional program.
Gene expression in hematopoiesis can be decomposed into modules of tightly co-expressed genes, some of which are restricted to specific lineages, whereas most are re-used in multiple lineages. Furthermore, modules' transcriptional state persists through multiple differentiation steps. For example, the transcriptional state of HSCs is not switched off immediately, but instead persists with gradually decreasing expression in progenitor cells.
Many of the TFs with known binding sites can be assembled into densely-interconnected circuits. These can provide a mechanism for robust gene regulation in both terminally differentiated cells and HSCs. Since the binding sites for many factors remain unknown, we therefore expect that the circuit's density and complexity is even higher.
A large number of TFs are differentially expressed across hematopoiesis, often in tightly co-regulated modules, and at comparable complexity to that of the other (non-regulatory) genes. Leveraging this correspondence, we associated TFs to the modules and differentiation states that they may regulate. We automatically re-discovered (without prior knowledge) many of the key known TFs, and predict regulatory functions for numerous additional TFs.
By monitoring the binding of four major TFs in HSPCs, we found that ‘anticipatory’ regulation may be a major feature of these circuits. In such cases, TFs that direct lineage-specific differentiation bind a significant portion of their target genes in HSPCs. These target genes are often moderately expressed in the stem and progenitor cells, with substantial further induction as differentiation progresses in the relevant lineage. This is consistent with the concept of ‘lineage priming’ in HSCs (Akashi, 2005), providing flexibility in cell fate commitments.
Discovering and validating transcriptional regulators in hematopoiesis
Our examination of the global architecture of hematopoietic differentiation offers a complementary strategy to studies of individual genes in murine models. In this approach, gene expression and sequence-based analyses nominate a host of candidate regulators, and point groups of factors that may act together and hence introduce redundancies. The two computational approaches complement each other: the expression model may identify factors whose binding specificity is unknown; the sequence model may help detect those factors whose mRNA levels do not change or do not correspond to changes in targets (Lu et al., 2009).
We used a perturbation-based approach to validate TFs derived from the sequence and expression models in an in vitro differentiation system. Modulating expression of candidate TFs with RNA interference altered differentiation of hematopoietic progenitor cells in vitro in the direction predicted by our models. We re-confirmed the role of several known factors, and identified several new ones (e.g. YY1, AFF1, HIF3A). In vitro manipulation can be more sensitive than genetic ablation experiments in vivo, where perturbations may be corrected by homeostatic mechanisms, such as cytokine or transcriptional feedback loops.
A transcriptional roadmap for hematologic malignancies
Balanced translocations involving TFs play a major role in the pathogenesis of human leukemias. Of 200 known translocations in AML (Mitelman et al., 2010), there are 53 in which at least one translocation partner is a TF, 16 as a 5′ partner and 43 as a 3′ partner (6 in both). 25 of these 43 known 3′ partners are among the 220 regulators in the expression model (P<0.028), and 5 of the known 3′ partners are among the 72 known TFs in the sequence model. Furthermore, 5′ partners are enriched in genes expressed in HSPCs. These results support the role of chosen regulators in differentiation, and are consistent with a broader paradigm in which lineage-specific promoters can dysregulate key TFs to disrupt differentiation (Rosenbauer and Tenen, 2007; Tomlins et al., 2005).
Impaired or blocked hematopoietic differentiation is a defining characteristic of leukemia, and the gene expression profiles of leukemias cluster strongly into subgroups that correspond to specific molecular subgroups (Bullinger et al., 2004; Tamayo et al., 2007; Valk et al., 2004). Gene signatures induced in various leukemias significantly overlap those induced in normal hematopoiesis (Figure S7A,B). In most cases there is a coherent overlap between the leukemia subtype and the cell type from which it is known to arise. However, human leukemias often have more complex combinations of modules that are not observed in normal samples, including HSPC modules, as has been reported in murine models of leukemia (Krivtsov et al., 2006).
Towards a programming ‘code’ of hematopoietic differentiation
A more complete understanding of hematopoietic differentiation will likely require an integration of gene expression data with other genomic data, including epigenetic analyses, genome-wide ChIP-Seq studies, proteomics, and systematic functional studies. Given the ability to produce high quality measurements from small numbers of cells, gene expression data provides a first draft of the transcriptional program controlling hematopoiesis, opening the way to manipulate and reprogram these circuits, through perturbation and manipulation of each regulatory factor. These can highlight avenues for therapeutic intervention, including ‘reprogramming’ of cells to more desired states. While deriving mechanistic insights from mammalian gene expression profiling data has been challenging, hematopoiesis provides a paradigm for the testing of more advanced algorithms (Kim et al., 2009). Our dataset and analyses provide a resource for further inquiries into normal and pathologic hematopoietic differentiation in humans.
Experimental Procedures
Subjects and samples
Human umbilical cord blood was harvested from postpartum placentas at Brigham and Women's Hospital under an Institution Review Board (IRB)-approved protocol. Peripheral blood samples were obtained from healthy volunteers at the Dana-Farber Cancer Institute with informed consent under an IRB-approved protocol.
The majority of cells were purified from umbilical cord blood, an enriched source of undifferentiated populations. However, terminally differentiated lymphocyte populations including T-cells (TCELL1-8), B-cells (BCELL1-4), natural killer cells (NKa1, NKa2, NKa3, NKT) and dendritic cells (DENDa1, DENDa2) were purified from adult peripheral blood because terminal differentiation in these populations requires exposure to antigens after birth. For each cell population, we purified samples from 4-7 distinct donors. All blood samples were harvested fresh and immediately processed for flow sorting.
Cell sorting strategy and flow cytometry
First, mononuclear cells were isolated by Ficoll-Hypaque sedimentation. For relatively rare populations, including hematopoietic stem cell populations (HSC1 and HSC2), progenitor populations such as common myeloid progenitor (CMP), megakaryocyte/erythroid progenitor (MEP), granulocyte-monocyte progenitor (GMP), and for the erythroid lineage populations (ERY1-5), lineage depletion was performed using antibodies against CD2, CD3, CD4, CD5, CD8, CD11b, CD14C, CD19, and CD56 with a magnetic column (Miltenyi Biotec, Auburn, CA). Positive selection was then performed using flow cytometry for labeled antibodies to the markers described in Table S1. For the more common or terminally differentiated populations including neutrophil populations (GRAN1-3), basophils (BASO1), monocytes (MONO1-2), eosinophils (EOS2), megakaryocytes (MEGA1-2), B-Lymphoid Progenitor (PRE_BCELL1), Pro and Early B-lymphocytes (PRE_BCELL2, PRE_BCELL3), dendritic cells (DENDa1, DENDa2), mature T-cells (TCELL1-8), mature B-cells (BCELL1-4) and natural killer cells (NKa1-3, NKT), cells were positively selected using flow scatter properties and antibodies based on the immunophenotypes described in Table S7. The gene expression profiles for a subset of the lymphoid populations, has been analyzed previously (Haining et al., 2008).
Sorting was performed with Vantage SE Diva or FACSAria flow cytometers (BD (Becton-Dickinson, San Jose, CA). Cell populations of interest were collected into tubes containing PBS in a collection unit at 4°C. The >95% purity of populations was confirmed by performing FACS analysis of the sorted cells. Sorted cells were spun down, immediately re-suspended in TriZol (Invitrogen, San Diego, CA) and stored at -70°C.
Microarray data acquisition
Total RNA was isolated from TriZol. The concentration of RNA was quantified using the RiboGreen© RNA Quantitation Kit (Invitrogen, San Diego, CA). Ten nanograms of total RNA were amplified using the Ovation Biotin RNA Amplification and Labeling System (NuGEN, San Carlos, CA). The cDNA was fragmented, labeled and hybridized to Affymetrix HG_U133AAofAv2 microarrays (Affymetrix, Santa Clara, CA), which contains 22,944 probes. Transcript levels were normalized using RMA, genes where filtered and normalized again such that the mean of each gene is zero. Dataset is available on http://www.ncbi.nlm.nih.gov/geo/, GSE24759.
Expression-based Module Networks model
The modules and their regulation programs were automatically learned using the Module Networks algorithm (Segal et al., 2003). This method detects modules of co-expressed genes and their shared regulation programs. The regulation program is a small set of genes, whose expression is predictive of the expression level of the module genes using a decision (regression) tree structure. Given the expression values and a pool of candidate regulator genes, a set of modules and their associated regulation programs are automatically inferred by an iterative procedure. This procedure searches for the best gene partition into modules and for the regulation program of each module, while optimizing a target function. The target function is the Bayesian score, derived from the posterior probability of the model (see (Segal et al., 2005) for a detailed description of the algorithm).
Supplementary Material
Acknowledgments
We thank E. Lander, I. Amit and I. Gat-Viks for critical review of the manuscript; D. Scadden for helpful discussions; L. Gaffney and S. Hart for assistance with figure generation; and D. Peck, J. Lamb, R. Onofrio, and the Broad Genetic Analysis Platform for assistance with expression arrays. The work was funded by the NIH (grants R01 HL082945 and P01 CA108631 to BE, and the PIONEER award to AR), the Burroughs-Wellcome Fund (CAMS to BLE and CASI to AR), funds from Landon and Lavinia Clay (RAY) and HHMI (TRG and AR). AR is an investigator of the Merkin Foundation for Stem Cell Research at the Broad Institute.
Footnotes
Further details for data analysis, chromatin immunoprecipitation, and functional validation experiments are described in the Supplemental Experimental Procedures.
Publisher's Disclaimer: This is a PDF file of an unedited manuscript that has been accepted for publication. As a service to our customers we are providing this early version of the manuscript. The manuscript will undergo copyediting, typesetting, and review of the resulting proof before it is published in its final citable form. Please note that during the production process errors may be discovered which could affect the content, and all legal disclaimers that apply to the journal pertain.
References
- Akashi K. Lineage promiscuity and plasticity in hematopoietic development. Ann N Y Acad Sci. 2005;1044:125–131. doi: 10.1196/annals.1349.016. [DOI] [PubMed] [Google Scholar]
- Amit I, Garber M, Chevrier N, Leite AP, Donner Y, Eisenhaure T, Guttman M, Grenier JK, Li W, Zuk O, et al. Unbiased Reconstruction of a Mammalian Transcriptional Network Mediating Pathogen Responses. Science %R 101126/science1179050. 2009;326:257–263. doi: 10.1126/science.1179050. [DOI] [PMC free article] [PubMed] [Google Scholar]
- Aplan PD, Nakahara K, Orkin SH, Kirsch IR. The SCL gene product: a positive regulator of erythroid differentiation. EMBO J. 1992;11:4073–4081. doi: 10.1002/j.1460-2075.1992.tb05500.x. [DOI] [PMC free article] [PubMed] [Google Scholar]
- Aramburu J, Azzoni L, Rao A, Perussia B. Activation and expression of the nuclear factors of activated T cells, NFATp and NFATc, in human natural killer cells: regulation upon CD16 ligand binding. J Exp Med. 1995;182:801–810. doi: 10.1084/jem.182.3.801. [DOI] [PMC free article] [PubMed] [Google Scholar]
- Argiropoulos B, Yung E, Humphries RK. Unraveling the crucial roles of Meis1 in leukemogenesis and normal hematopoiesis. Genes Dev. 2007;21:2845–2849. doi: 10.1101/gad.1619407. [DOI] [PubMed] [Google Scholar]
- Bakker WJ, van Dijk TB, Parren-van Amelsvoort M, Kolbus A, Yamamoto K, Steinlein P, Verhaak RG, Mak TW, Beug H, Lowenberg B, von Lindern M. Differential regulation of Foxo3a target genes in erythropoiesis. Mol Cell Biol. 2007;27:3839–3854. doi: 10.1128/MCB.01662-06. [DOI] [PMC free article] [PubMed] [Google Scholar]
- Bhattacharjee A, Richards WG, Staunton J, Li C, Monti S, Vasa P, Ladd C, Beheshti J, Bueno R, Gillette M, et al. Classification of human lung carcinomas by mRNA expression profiling reveals distinct adenocarcinoma subclasses. Proc Natl Acad Sci U S A. 2001;98:13790–13795. doi: 10.1073/pnas.191502998. [DOI] [PMC free article] [PubMed] [Google Scholar]
- Boyer LA, Lee TI, Cole MF, Johnstone SE, Levine SS, Zucker JP, Guenther MG, Kumar RM, Murray HL, Jenner RG, et al. Core transcriptional regulatory circuitry in human embryonic stem cells. Cell. 2005;122:947–956. doi: 10.1016/j.cell.2005.08.020. [DOI] [PMC free article] [PubMed] [Google Scholar]
- Brunet JP, Tamayo P, Golub TR, Mesirov J. Metagenes and molecular pattern discovery using matrix factorization. Proc Natl Acad Sci U S A. 2004 doi: 10.1073/pnas.0308531101. in press. [DOI] [PMC free article] [PubMed] [Google Scholar]
- Bullinger L, Dohner K, Bair E, Frohling S, Schlenk RF, Tibshirani R, Dohner H, Pollack JR. Use of gene-expression profiling to identify prognostic subclasses in adult acute myeloid leukemia. N Engl J Med. 2004;350:1605–1616. doi: 10.1056/NEJMoa031046. [DOI] [PubMed] [Google Scholar]
- Cantor A, Orkin S. Transcriptional regulation of erythropoiesis: an affair involving multiple partners. Oncogene. 2002;21:3368–3376. doi: 10.1038/sj.onc.1205326. [DOI] [PubMed] [Google Scholar]
- Chen ML, Logan TD, Hochberg ML, Shelat SG, Yu X, Wilding GE, Tan W, Kujoth GC, Prolla TA, Selak MA, et al. Erythroid dysplasia, megaloblastic anemia, and impaired lymphopoiesis arising from mitochondrial dysfunction. Blood. 2009;114:4045–4053. doi: 10.1182/blood-2008-08-169474. [DOI] [PMC free article] [PubMed] [Google Scholar]
- Chin K, DeVries S, Fridlyand J, Spellman PT, Roydasgupta R, Kuo WL, Lapuk A, Neve RM, Qian Z, Ryder T, et al. Genomic and transcriptional aberrations linked to breast cancer pathophysiologies. Cancer Cell. 2006;10:529–541. doi: 10.1016/j.ccr.2006.10.009. [DOI] [PubMed] [Google Scholar]
- Davidson EH. Genomic Regulatory Systems. Development and Evolution. 2001 doi: 10.1242/dev.124.10.1851. [DOI] [PubMed] [Google Scholar]
- Ebert BL, Golub TR. Genomic approaches to hematologic malignancies. Blood. 2004;104:923–932. doi: 10.1182/blood-2004-01-0274. [DOI] [PubMed] [Google Scholar]
- Fontenay M, Cathelin S, Amiot M, Gyan E, Solary E. Mitochondria in hematopoiesis and hematological diseases. Oncogene. 2006;25:4757–4767. doi: 10.1038/sj.onc.1209606. [DOI] [PubMed] [Google Scholar]
- Funnell AP, Maloney CA, Thompson LJ, Keys J, Tallack M, Perkins AC, Crossley M. Erythroid Kruppel-like factor directly activates the basic Kruppel-like factor gene in erythroid cells. Mol Cell Biol. 2007;27:2777–2790. doi: 10.1128/MCB.01658-06. [DOI] [PMC free article] [PubMed] [Google Scholar]
- Hahm K, Cobb BS, McCarty AS, Brown KE, Klug CA, Lee R, Akashi K, Weissman IL, Fisher AG, Smale ST. Helios, a T cell-restricted Ikaros family member that quantitatively associates with Ikaros at centromeric heterochromatin. Genes Dev. 1998;12:782–796. doi: 10.1101/gad.12.6.782. [DOI] [PMC free article] [PubMed] [Google Scholar]
- Haining WN, Ebert BL, Subrmanian A, Wherry EJ, Eichbaum Q, Evans JW, Mak R, Rivoli S, Pretz J, Angelosanto J, et al. Identification of an evolutionarily conserved transcriptional signature of CD8 memory differentiation that is shared by T and B cells. J Immunol. 2008;181:1859–1868. doi: 10.4049/jimmunol.181.3.1859. [DOI] [PMC free article] [PubMed] [Google Scholar]
- Hirai H, Zhang P, Dayaram T, Hetherington CJ, Mizuno S, Imanishi J, Akashi K, Tenen DG. C/EBPbeta is required for ‘emergency’ granulopoiesis. Nat Immunol. 2006;7:732–739. doi: 10.1038/ni1354. [DOI] [PubMed] [Google Scholar]
- Iwasaki H, Akashi K. Hematopoietic developmental pathways: on cellular basis. Oncogene. 2007;26:6687–6696. doi: 10.1038/sj.onc.1210754. [DOI] [PubMed] [Google Scholar]
- Kim HD, Shay T, O'Shea EK, Regev A. Transcriptional regulatory circuits: predicting numbers from alphabets. Science. 2009;325:429–432. doi: 10.1126/science.1171347. [DOI] [PMC free article] [PubMed] [Google Scholar]
- Kino T, Takatori H, Manoli I, Wang Y, Tiulpakov A, Blackman MR, Su YA, Chrousos GP, DeCherney AH, Segars JH. Brx mediates the response of lymphocytes to osmotic stress through the activation of NFAT5. Sci Signal. 2009;2:ra5. doi: 10.1126/scisignal.2000081. [DOI] [PMC free article] [PubMed] [Google Scholar]
- Krivtsov AV, Twomey D, Feng Z, Stubbs MC, Wang Y, Faber J, Levine JE, Wang J, Hahn WC, Gilliland DG, et al. Transformation from committed progenitor to leukaemia stem cell initiated by MLL-AF9. Nature. 2006;442:818–822. doi: 10.1038/nature04980. [DOI] [PubMed] [Google Scholar]
- Lecuyer E, Hoang T. SCL: from the origin of hematopoiesis to stem cells and leukemia. Exp Hematol. 2004;32:11–24. doi: 10.1016/j.exphem.2003.10.010. [DOI] [PubMed] [Google Scholar]
- Lee HM, Zhang H, Schulz V, Tuck DP, Forget BG. Downstream targets of HOXB4 in a cell line model of primitive hematopoietic progenitor cells. Blood. 2010;116:720–730. doi: 10.1182/blood-2009-11-253872. [DOI] [PMC free article] [PubMed] [Google Scholar]
- Li Q, Frestedt JL, Kersey JH. AF4 encodes a ubiquitous protein that in both native and MLL-AF4 fusion types localizes to subnuclear compartments. Blood. 1998;92:3841–3847. [PubMed] [Google Scholar]
- Liu M, Lee MH, Cohen M, Bommakanti M, Freedman LP. Transcriptional activation of the Cdk inhibitor p21 by vitamin D3 leads to the induced differentiation of the myelomonocytic cell line U937. Genes Dev. 1996;10:142–153. doi: 10.1101/gad.10.2.142. [DOI] [PubMed] [Google Scholar]
- Look AT. Oncogenic transcription factors in the human acute leukemias. Science. 1997;278:1059–1064. doi: 10.1126/science.278.5340.1059. [DOI] [PubMed] [Google Scholar]
- Lu R, Markowetz F, Unwin RD, Leek JT, Airoldi EM, MacArthur BD, Lachmann A, Rozov R, Ma'ayan A, Boyer LA, et al. Systems-level dynamic analyses of fate change in murine embryonic stem cells. Nature. 2009;462:358–362. doi: 10.1038/nature08575. [DOI] [PMC free article] [PubMed] [Google Scholar]
- McLean CY, Bristor D, Hiller M, Clarke SL, Schaar BT, Lowe CB, Wenger AM, Bejerano G. GREAT improves functional interpretation of cis-regulatory regions. Nat Biotechnol. 2010;28:495–501. doi: 10.1038/nbt.1630. [DOI] [PMC free article] [PubMed] [Google Scholar]
- Mitelman F, Johansson B, Mertens F. Mitelman Database of Chromosome Aberrations and Gene Fusions in Cancer 2010 [Google Scholar]
- Monti S, Savage KJ, Kutok JL, Feuerhake F, Kurtin P, Mihm M, Wu B, Pasqualucci L, Neuberg D, Aguiar RC, et al. Molecular profiling of diffuse large B-cell lymphoma identifies robust subtypes including one characterized by host inflammatory response. Blood. 2005;105:1851–1861. doi: 10.1182/blood-2004-07-2947. [DOI] [PubMed] [Google Scholar]
- Muller FJ, Laurent LC, Kostka D, Ulitsky I, Williams R, Lu C, Park IH, Rao MS, Shamir R, Schwartz PH, et al. Regulatory networks define phenotypic classes of human stem cell lines. Nature. 2008;455:401–405. doi: 10.1038/nature07213. [DOI] [PMC free article] [PubMed] [Google Scholar]
- Ng SY, Yoshida T, Georgopoulos K. Ikaros and chromatin regulation in early hematopoiesis. Curr Opin Immunol. 2007;19:116–122. doi: 10.1016/j.coi.2007.02.014. [DOI] [PubMed] [Google Scholar]
- Orkin SH, Zon LI. Hematopoiesis: an evolving paradigm for stem cell biology. Cell. 2008;132:631–644. doi: 10.1016/j.cell.2008.01.025. [DOI] [PMC free article] [PubMed] [Google Scholar]
- Peck D, Crawford ED, Ross KN, Stegmaier K, Golub TR, Lamb J. A method for high-throughput gene expression signature analysis. Genome Biol. 2006;7:R61. doi: 10.1186/gb-2006-7-7-r61. [DOI] [PMC free article] [PubMed] [Google Scholar]
- Pevny L, Simon MC, Robertson E, Klein WH, Tsai SF, D'Agati V, Orkin SH, Costantini F. Erythroid differentiation in chimaeric mice blocked by a targeted mutation in the gene for transcription factor GATA-1. Nature. 1991;349:257–260. doi: 10.1038/349257a0. [DOI] [PubMed] [Google Scholar]
- Quesenberry PJ, Colvin GA. Hematopoietic stem cells, progenitor cells, and cytokines. Williams Hematology (McGraw-Hill) 2005:153–174. [Google Scholar]
- Rincon-Arano H, Valadez-Graham V, Guerrero G, Escamilla-Del-Arenal M, Recillas-Targa F. YY1 and GATA-1 interaction modulate the chicken 3′-side alpha-globin enhancer activity. J Mol Biol. 2005;349:961–975. doi: 10.1016/j.jmb.2005.04.040. [DOI] [PubMed] [Google Scholar]
- Rosenbauer F, Tenen DG. Transcription factors in myeloid development: balancing differentiation with transformation. Nat Rev Immunol. 2007;7:105–117. doi: 10.1038/nri2024. [DOI] [PubMed] [Google Scholar]
- Sandelin A, Alkema W, Engström P, Wasserman WW, Lenhard B. JASPAR: an open-access database for eukaryotic transcription factor binding profiles. Nucleic Acids Res. 2004:D91–94. doi: 10.1093/nar/gkh012. [DOI] [PMC free article] [PubMed] [Google Scholar]
- Scott EW, Simon MC, Anastasi J, Singh H. Requirement of transcription factor PU.1 in the development of multiple hematopoietic lineages. Science. 1994;265:1573–1577. doi: 10.1126/science.8079170. [DOI] [PubMed] [Google Scholar]
- Segal E, Pe'er D, Regev A, Koller D, Friedman N. Learning module networks. J Mach Learn Res. 2005:557–588. [Google Scholar]
- Segal E, Shapira M, Regev A, Pe'er D, Botstein D, Koller D, Friedman N. Module networks: identifying regulatory modules and their condition-specific regulators from gene expression data. Nat Genet. 2003:166–176. doi: 10.1038/ng1165. [DOI] [PubMed] [Google Scholar]
- Singh H, DeKoter RP, Walsh JC. PU.1, a shared transcriptional regulator of lymphoid and myeloid cell fates. Cold Spring Harb Symp Quant Biol. 1999;64:13–20. doi: 10.1101/sqb.1999.64.13. [DOI] [PubMed] [Google Scholar]
- Su AI, Wiltshire T, Batalov S, Lapp H, Ching KA, Block D, Zhang J, Soden R, Hayakawa M, Kreiman G, et al. A gene atlas of the mouse and human protein-encoding transcriptomes. Proc Natl Acad Sci U S A. 2004;101:6062–6067. doi: 10.1073/pnas.0400782101. [DOI] [PMC free article] [PubMed] [Google Scholar]
- Subramanian A, Tamayo P, Mootha VK, Mukherjee S, Ebert BL, Gillette MA, Paulovich A, Pomeroy SL, Golub TR, Lander ES, Mesirov JP. Gene set enrichment analysis: a knowledge-based approach for interpreting genome-wide expression profiles. Proc Natl Acad Sci U S A. 2005;102:15545–15550. doi: 10.1073/pnas.0506580102. [DOI] [PMC free article] [PubMed] [Google Scholar]
- Suzuki H, Forrest AR, van Nimwegen E, Daub CO, Balwierz PJ, Irvine KM, Lassmann T, Ravasi T, Hasegawa Y, de Hoon MJ, et al. The transcriptional network that controls growth arrest and differentiation in a human myeloid leukemia cell line. Nat Genet. 2009:553–562. doi: 10.1038/ng.375. [DOI] [PMC free article] [PubMed] [Google Scholar]
- Tamayo P, Scanfeld D, Ebert BL, Gillette MA, Roberts CW, Mesirov JP. Metagene projection for cross-platform, cross-species characterization of global transcriptional states. Proc Natl Acad Sci U S A. 2007;104:5959–5964. doi: 10.1073/pnas.0701068104. [DOI] [PMC free article] [PubMed] [Google Scholar]
- Tibshirani R, Hastie T. Outlier sums for differential gene expression analysis. Biostatistics. 2007;8:2–8. doi: 10.1093/biostatistics/kxl005. [DOI] [PubMed] [Google Scholar]
- Tomlins SA, Rhodes DR, Perner S, Dhanasekaran SM, Mehra R, Sun XW, Varambally S, Cao X, Tchinda J, Kuefer R, et al. Recurrent fusion of TMPRSS2 and ETS transcription factor genes in prostate cancer. Science. 2005;310:644–648. doi: 10.1126/science.1117679. [DOI] [PubMed] [Google Scholar]
- Valk PJ, Verhaak RG, Beijen MA, Erpelinck CA, Barjesteh van Waalwijk van Doorn-Khosrovani S, Boer JM, Beverloo HB, Moorhouse MJ, van der Spek PJ, Lowenberg B, Delwel R. Prognostically useful gene-expression profiles in acute myeloid leukemia. N Engl J Med. 2004;350:1617–1628. doi: 10.1056/NEJMoa040465. [DOI] [PubMed] [Google Scholar]
- Valouev A, Johnson DS, Sundquist A, Medina C, Anton E, Batzoglou S, Myers RM, Sidow A. Genome-wide analysis of transcription factor binding sites based on ChIP-Seq data. Nat Methods. 2008;5:829–834. doi: 10.1038/nmeth.1246. [DOI] [PMC free article] [PubMed] [Google Scholar]
- Xu RH, Sampsell-Barron TL, Gu F, Root S, Peck RM, Pan G, Yu J, Antosiewicz-Bourget J, Tian S, Stewart R, Thomson JA. NANOG is a direct target of TGFbeta/activin-mediated SMAD signaling in human ESCs. Cell Stem Cell. 2008;3:196–206. doi: 10.1016/j.stem.2008.07.001. [DOI] [PMC free article] [PubMed] [Google Scholar]
- Zhang Y, Liu T, Meyer CA, Eeckhoute J, Johnson DS, Bernstein BE, Nusbaum C, Myers RM, Brown M, Li W, Liu XS. Model-based analysis of ChIP-Seq (MACS) Genome Biol. 2008;9:R137. doi: 10.1186/gb-2008-9-9-r137. [DOI] [PMC free article] [PubMed] [Google Scholar]
Associated Data
This section collects any data citations, data availability statements, or supplementary materials included in this article.