

Abstract
Low compliance with medication is the major cause of poor outcome in schizophrenia treatment. While surgically implantable solvent-cast pellets were produced to improve outcome by increased compliance with medication, this process is laborious and time-consuming, inhibiting its broader application 1. In this study, the previous fabrication process was translated to a continuous and scalable extrusion method. Extrusion processes were modified based on in vitro release studies, drug load consistency examination, and surface morphology analysis using scanning electron microscopy. Afterwards, optimized haloperidol implants were implanted into rats for preliminary analysis of biocompatibility. Barrel temperature, screw speed and resulting processing pressure influenced surface morphology and drug release. Data suggest that fewer surface pores shift the mechanism from bulk to surface PLGA degradation and longer lag period. Results demonstrate that extrusion is a viable process for manufacturing antipsychotic implants.
Keywords: Controlled drug release, Extrusion, Implant, Poly lactic-co-glycolic acid (PLGA), Scanning electron microscopy (SEM), Formulation
Introduction
Schizophrenia is a serious mental disorder characterized by behavioral symptoms and lasting functional decline. Although there are efficacious antipsychotic medicines for schizophrenia, the main barrier to effective treatment is low compliance with medication and subsequent deterioration and rehospitalization 2,3. The major route of administration for schizophrenia medications is oral. Depot injections have also been created as an alternative method of administration for antipsychotic treatment, leading to increased medication adherence and improved clinical outcome 4–7. However, there are several drawbacks to depot injections, including pain at the injection site from repeated injections such that some patients decline sustained treatment 8. As a result, the rate of discontinuation increases over time, which reduces the overall benefit for improved patient adherence 9.
We previously proposed that a surgically-implantable, long-term delivery of antipsychotic drug implants could improve the adherence of patients beyond that achieved by depot injections 10. Therefore, long-term drug delivery implants may fill an unmet need in psychiatric care. In addition, drug implants can be removed through a simple procedure if removal is required. Alternatively, depot injections are inherently irreversible. Parenteral delivery from drug implants may also offer pharmacokinetic benefits over oral administration due to reduced peaks and troughs of drug concentration. Implants can provide a steady release pattern with less variability. Lower peak values may reduce side effects, which can make drugs more acceptable to a broader group of patients. Furthermore, parenteral administration bypasses first pass metabolism and reduces over all drug exposure.
Previous studies described haloperidol implants fabricated by a solvent-casting method with a resulting steady rate of drug release over five months 11. This study utilized poly lactic-co-glycolic acid (PLGA) as a biodegradable polymer matrix, which has been widely used for drug delivery research 12–16. Additionally, biological effects of several Active Pharmaceutical Ingredients (APIs) have been demonstrated in animal studies following release from PLGA implants 1,17,18. These studies suggested that antipsychotic implants may be feasible as long-term delivery systems in schizophrenia. However, solvent-casting methods are not ideal for industrial scale-up for many reasons: First, the process requires large amounts of an organic solvent to dissolve PLGA and API to combine the drug and polymer for pellet fabrication. Second, this process requires a very long time (2–3 weeks) to fully remove solvents from the resulting material. Third, solvent-casting and compression molding are not continuous processes, which may increase batch-to-batch variation in the composition of implants as well as cost of manufacturing.
In order to translate this laboratory-based method into a more traditional manufacturing process that could be more easily adapted by industry, we examined the use of a scalable, continuous process to produce haloperidol implants. We used a single-screw micro extruder to fabricate drug implants through melt extrusion 19–21. The purpose of this study is to maximize the translation and scalability potential of a laboratory based method for industrial use. Once the key variables are determined, future studies can apply this knowledge to other type of drugs and/or types of PLGA. Thus, we focused on fabrication of 50:50 PLGA implants to test the feasibility, as this yields the shortest time to evaluate a large number of potential variables of the translated manufacturing process. Applications utilizing other types of PLGA with increased degradation duration will be tested in future studies. We compared performances of solvent-cast and extruded implants and modified the fabrication process based on in vitro release profiles and surface morphology analysis. Optimized extruded implants were then implanted into rats to test their biocompatibility. An ideal system would release 2 mg/day, similar to clinically efficacious doses of haloperidol depot formulations (approximately 50 mg/mo). Previous studies using solvent cast methods have achieved this goal with 40% drug load, yielding clinically applicable doses from 5 mg of implant material per day (e.g. 150 mg of implant material = approximately 1.5 cm implant per month) 1,11,17,18. The current study evaluates a scalable, continuous manufacturing method to foster easy, cost effective transfer of this novel therapeutic approach from the academic setting into clinical practice.
Materials and Methods
Solvent-casting
Solvent-cast pellets were fabricated using a polymer consisting of 50% lactide and 50% Gylcolide (50:50 PLGA, inherent viscosity = 0.47dl/g) (Lakeshore Biomaterials, Birmingham, AL) and haloperidol (Sigma, St. Louis, MO). Polymer and drug were mixed in a ratio of 60:40 by mass for 40% haloperidol pellets and 80:20 for 20% haloperidol pellets and solvent cast with acetone. Acetone was evaporated at 40°C in oven under constant airflow until no solvent remained, which was determined by weighing the resultant mixture to make sure it returned to its constituent mass. The resulting material was compression-molded under a force of 25,000 lb at 80°C for 3 minutes. Pellets for negative control were fabricated by the same method with pure polymer.
Extrusion
Drug-polymer powder mixtures were extruded using a ¾ inch diameter, mixing single-screw Microtruder RCP-0750 (Randcastle Extrusion Systems, Cedar Grove, NJ) (Figure 1A). To prepare powders for extrusion, 50:50 PLGA were ground and sieved to 0.5 mm. Haloperidol was used directly without grinding. Polymer and drug were mixed in a ratio of 60:40 by mass. The mixture was constantly mixed by rotating and shaking the combined powders to foster homogeneity of the feed material. Conditions for extrusion are listed in Table 1. The set temperatures in each zone are listed, and the extruder was preheated for 1 hour to allow the extruder to reach steady state. Zone 1 is the feed section of the extruder. Zone 2 and Zone 3 are the upper and lower parts of the extruder chamber. Zone 4 is the die, through which material exits the extruder (Figure 1B). The first condition (Ext-Ctl) referred to the extrusion control and used 50:50 PLGA only. The next three extrusion runs are designated as Ext-1, Ext-2, and Ext-3 and included polymer and drug in ratio of 60:40. Process parameters for Ext-Ctl and Ext-1 were based on preliminary runs using temperatures above the glass transition temperature (Tg) of 50:50 PLGA (43–48°C) and below the melting temperature of haloperidol (150–152°C). Parameters in Ext-2 and Ext-3 were adjusted based on the results of in vitro release studies and surface morphology analysis.
Figure 1.

A) photograph of the micro extruder used in these studies. B) Schematic representation of the apparatus. C) Flow diagram of implant fabrication.
Table 1.
Extrusion parameters for implant fabrication. (Zone 1: feed section. Zone 2 and 3: Upper and lower part of extruder chamber. Zone 4: Die.)
| Zone1(°C) | Zone2(°C) | Zone3(°C) | Zone4(°C) | Speed(rpm) | |
|---|---|---|---|---|---|
| Ext-Ctl | 110 | 115 | 109 | 105 | 20.0 |
| Ext-1 | 80 | 90 | 87 | 82 | 21.5 |
| Ext-2 | 80 | 92 | 86 | 76 | 24.0 |
| Ext-3 | 80 | 99 | 89 | 78 | 21.5 |
At the beginning of each extrusion run, sufficient polymer-drug mixture was fed through the extruder to ensure that the chambers were filled prior to collecting rods. The feed rate was 0.2 g/min, based on the output rate of the rods. Pressure inside the extruder was maintained below 4000 psi at this feed rate to prevent overloading the drive motor. Extruded rods were cut into five segments, each with 1 foot (30.5 cm) in length, and labeled as #1 to #5. These rods were then stored in the dark at 4°C until use (Figure 1C).
In Vitro Assay
Each implant was added to a separate amber-glass dissolution jar containing 500 ml of phosphate-buffered saline (PBS) at pH 7.4. The jars were stored in the dark at 37.4°C on a platform shaker (Barnstead International, Dubuque, IA) at 40 rpm consistent with USP guidelines to mimic physiological conditions in the subcutaneous space. Aliquots of 200 μl were taken from each jar three times per week and analyzed by ultraviolet spectrophotometer (Bio-Tek Instruments, Winooski, Vermont). After each sampling, 200 μl of fresh PBS was added to each jar to maintain constant volume during in vitro assessments. The calculated concentrations in the dissolution jars were corrected for the amount of drug removed at each sampling point. Standard solutions were prepared in PBS. Peak absorbance was measured at 254 nm. Assays included a negative control at every time point and a 0.02 mg/ml positive control of drug in PBS to assess stability of the API over time.
Drug Load Test
Five segments from Ext-1 to Ext-3 were examined by ultraviolet spectrophotometer. Three pieces of rods were cut from each segments and weighed. These sample rods were then dissolved in 10 ml acetonitrile respectively and vortex for 5 minutes until all samples were dissolved. 100 μl of the resultant solution was transferred to 10 ml of PBS and vortexed for 5 minutes. 200 ml of the mixed solution was then transferred to 96-well plate and read by ultraviolet spectrophotometer.
Surface Morphology Analysis
Surface morphologies of implants fabricated by solvent-casting and extrusion were evaluated by scanning electron microscopy (SEM) (FEI Strata DB235, Oregon). Implants were fixed on the sample holder, coated with gold/palladium, and imaged using secondary electrons.
Lateral surface roughness (Ra), which is defined as the average height of a surface peak relative to the midline, was analyzed using ImageJ and Matlab. An example image is shown in Figure 2. The procedures for analysis were as follows:
Figure 2.

Example images for lateral surface analysis using ImageJ and Matlab. A) The original sample image. B) Binary image with a dark sample and a bright background under threshold intensity. C) Determination of the best-fit line on the edge coordinates. D) The resultant histogram shows the distance from each pixel on edge to best-fit line.
Examination of the intensity histogram for each sample area and background area
Definition of threshold intensity to yield a binary image with a dark sample and a bright background.
Determination of coordinates of the sample edge and fitting the line to edge coordinates.
Determination of the distance from each pixel on edge to best-fit line and plot histogram.
Calculation of the Ra as the arithmetic average of absolute values of the sample edge to centerline distance.
Cross-sectional surface porosity (φ), which is defined as the ratio of the total area of pores in a cross-section to the area of the cross-section, was evaluated by ImageJ and Excel. An example image is shown in Figure 3. The processes for analysis were as follows:
Figure 3.
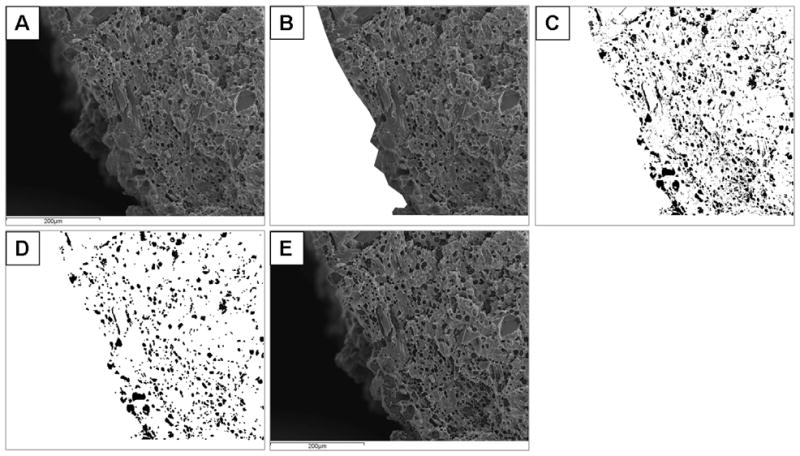
Example images for cross-sectional surface analysis using ImageJ and Excel. A) Sample image for analysis. B) Sample area defined based on intensity histogram to cut the portion of image that is not at the surface. C) Clearance of all background pixels and defining threshold intensity as being 19 intensity units below the mode of the intensity histogram, resulting in a binary image with a bright sample and dark pores. D) The image with single dark pixels eliminated. E) Plotting the resultant “pores” on top of original image to confirm that the results are consistent with the original image.
Examination of the intensity histogram for each sample area and background area
Definition and measurement of sample area.
Clearing of all background pixels.
Definition of threshold intensity was set to 19 intensity units below the mode of the intensity histogram, resulting in a binary image with a bright sample and dark pores.
Erode the image to eliminate single dark pixels.
Dilate the image to restore original without single pixels.
Plot “pores” on top of original image to confirm consistency.
Measure the area of the dark regions.
Calculate the porosity φ as the total number of dark pixels in the sample area over the total number of pixels in the sample area.
In Vivo Test
Animals
Implants were tested in rats (Harlan, Indianapolis, IN). All animals were housed in Association for Assessment and Accreditation of Laboratory Animal Care (AAALAC)-accredited animal facility at the University of Pennsylvania. The Institutional Animal Care and Use Committee (IACUC) approved all protocols. A total of sixteen rats were used for pharmacokinetic analysis of serum levels over time (n=8 with haloperidol implants and 8 with polymer alone control implants).
Implantation Surgery
The implants were prepared from the rods fabricated by Ext-Ctl and Ext-3. The dose of haloperidol was approximately 1.0 mg/kg/day. Rats were anaesthetized with isoflurane and the skin on the dorsal aspect was shaved prior to cleaning the area with betadine and alcohol. Then, the implant was inserted into the site between dermis and muscle by using a trochar. After implantation, the wound was closed with a surgical staple.
Pharmacokinetic Studies
One ml samples of blood were collected at days 7, 14, 21, 29, and 37. Blood was centrifuged for 30 min, yielding 200 μl of serum, which was stored at −80°C until analysis. Serum haloperidol concentrations were determined at each time point for each animal by solid phase extraction (MCX, Waters) and HPLC/UV detection.
Solid phase extraction (SPE) was performed using the Waters 20-postion SPE vacuum manifold and Waters Oasis MCX SPE cartridges (1 ml/30 mg cartridges). SPE cartridges were conditioned with methanol and water, loaded with samples containing 2 % volume phosphoric acid, and then washed with 5 % volume methanol in 0.1 N hydrochloric acid followed by a 100 % acetonitrile wash. The final elusion was performed by washing each SPE cartridge with 5 % volume NH4OH in 95 % volume acetonitrile. Each of these samples were then dried under nitrogen in a water bath at 80°C, reconstituted in 100 ml of mobile phase, vortexed, and centrifuged for 5 min. 75 μl of the reconstituted samples were then loaded into an auto sampler and 50 μl were injected.
Analysis was then performed by HPLC with UV detection at 254 nm. In vivo standard solutions of haloperidol were prepared in normal rat serum. Standards were then extracted using the same protocol as the study samples and were included within each run to provide both the standard curve and retention time for the compound. The retention time for haloperidol was approximately 7.567 min.
Results
In Vitro Release Study
In vitro haloperidol release profiles of solvent-cast pellets were shown in Figure 4. Release of 20% haloperidol 50:50 PLGA pellets lasted approximately 40 days with a three-phase release profile: slower release during first 8 days (Phase 1), followed by a more rapid release between day 8 and 35 (Phase 2) and another slow release period (Phase 3) until full drug release. The in vitro release profile from 40% solvent-cast pellets showed a similar three-phase release pattern.
Figure 4.

Cumulative in vitro release profiles from 20% haloperidol and 40% haloperidol solvent-cast pellets. Cumulative drug released is expressed as percent of total drug released. Phase 1 is the initial slow release, Phase 2 is a period of rapid release after Phase 1 and Phase 3 is the final slow release period until full drug release.
Drug load of rods in all three extrusions were examined by ultraviolet spectrophotometer and the results are shown in Figure 5. As seen in Figure 5, Ext 1 rods showed the most variability of drug load between each rod section and drug loads were lower than the expected value of 40%. Ext 2 rods showed improved consistency in drug load. Ext 3 rods showed highest consistency of drug load in each section among all extrusions.
Figure 5.

Drug load in rods. Drug load is expressed as weight percentage of drug in sample rods. 1–5 on the x-axis represent the five segments in each extrusion. For each segment in each extrusion, three rod were cut for drug load analysis and are expressed as the mean ± sem.
Figures 6 shows the in vitro release profiles and Figure 7 shows the daily percentage of drug released respectively, for extruded rods. Ext 1 rods started release after 10 days followed by a 20-day rapid release (Figures 6 and 7A). Ext 2 rods showed release after 7 days followed by a 20-day rapid release (Figure 6 and 7B). Ext 3 rods began release after 7 days followed by a 30-day more uniform release (Figure 6 and 7C). Rods demonstrate a three-phase release profile, albeit with less drug released during Phase 1 than pellets.
Figure 6.

Cumulative in vitro release profiles from 40% haloperidol 50:50 PLGA rods in Extrusions 1–3. Phase 1 is the initial slow release, Phase 2 is a period of rapid release after Phase 1 and Phase 3 is the final slow release period until full drug release.
Figure 7.
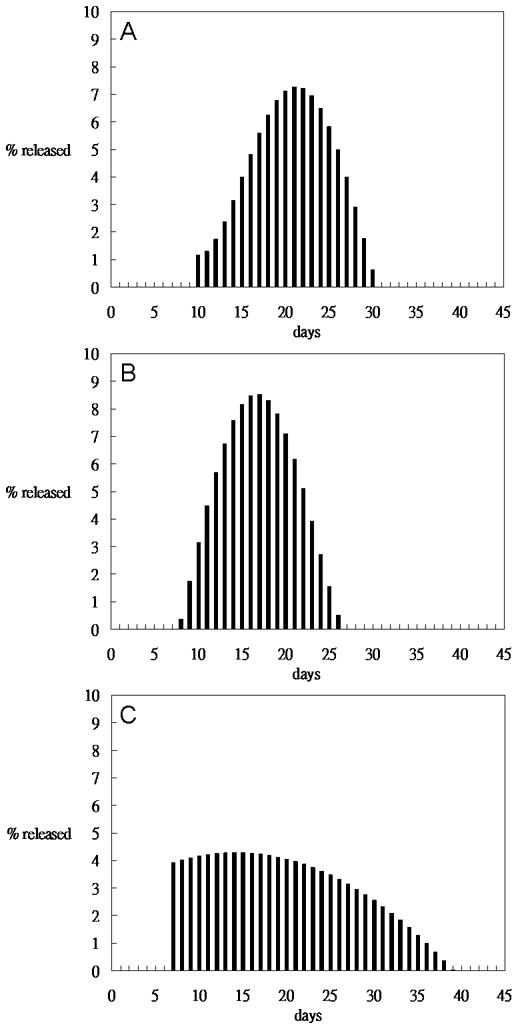
Daily percentage of drug released calculated based on release profiles. A) Extrusion 1, B) is Extrusion 2 and C) is Extrusion 3 of 40% drug loaded 50:50 PLGA.
Surface Morphology Analysis
Surface morphology of solvent-cast, compression-molded pellets was examined by SEM as shown in Figure 8. Figure 8A shows the outer surface of pellet, with both cracks and smooth regions. Figure 8B shows the cross-sectional fracture surface of a molded pellet. Lateral surface morphology of extruded rods is shown in Figure 9. The surface of Ext-1 rods showed moderate roughness (Figure 9A and 9B). Figure 9C and 9D reveal the most surface roughness in rods from Ext 2. Ext 3 rods show smooth surface morphology (Figure 9E and 9F). Figure 9A, 9C, and 9E were further characterized by ImageJ and Matlab (Table 4) and data are consistent with the qualitative observations.
Figure 8.

Scanning electron micrographs showing the surface morphology of 40% haloperidol solvent-cast pellets. Panel A) illustrates the lateral surface at a magnification of 100× with a scale bar of 500 μm. Panel B) illustrates the cross-sectional surfaces at a magnification of 100× with a scale bar of 500 μm.
Figure 9.
Lateral surface micrographs of extruded rods: Ext-1 rods are shown in panels A) and B), Ext-2 rods are shown in panels C) and D), and Ext-3 rods are shown in panel E) and F). The scale bars in A), C), and E) are 1 mm at a magnification of 50× and the scale bars in B), D), and F) is 500 μm at a magnification of 100×.
Table 4.
The lateral surface morphology of extruded rods pictured in images 9A, 9C, and 9E was characterized by the surface roughness, Ra, which is defined as the average height of a surface peak relative to the midline.
| 6A | 6C | 6E | |
|---|---|---|---|
| Ra (μm) | 3.6 | 10.9 | 2.7 |
| Sample length(μm) | 1503 | 1628 | 1580 |
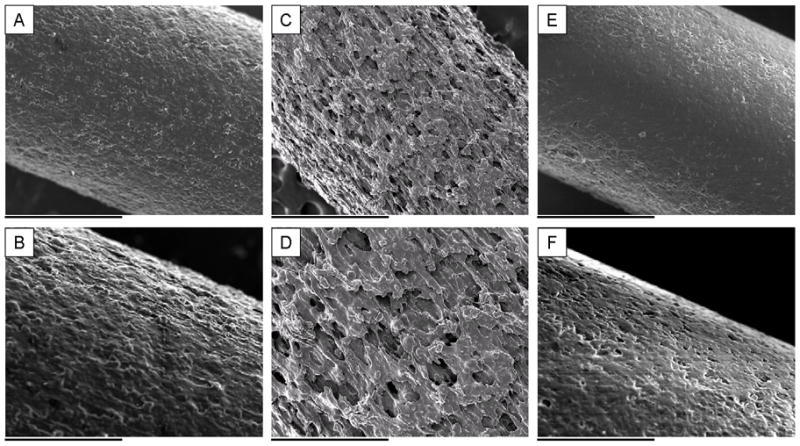
Cross-sectional surface morphology of rods was shown in Figure 10. Ext 1 rods showed moderate porosity, which can be seen in Figure 10A and 10B. As shown in Figure 10C and 10D, more pores were observed on the cross-sectional surface of Ext 2 rods. Fewer pores were observed in Ext 3 rods (Figure 10E and 10F). Porosity analysis of Figures 10B, 10D, and 10F by ImageJ are consistent with qualitative descriptions as shown in Table 5.
Figure 10.

Cross-sectional surface micrographs of extruded rods. A) and B) show Ext 1-rods. C) and D) show Ext-2 rods. E) and F) show Ext-3 rods. The scale bar in A), C), and E) is 500 μm at a magnification of 100× and the scale bar in B), D), and F) is 200 μm at a magnification of 200×.
Table 5.
The cross-sectional morphology for rods pictured in images 10B, 10D, and 10F was evaluated by the percent porosity, φ, which is defined as the ratio of the total area of pores in a cross-section to the cross-sectional area.
| 7B | 7D | 7F | |
|---|---|---|---|
| Porosity φ (%) | 8.3 | 12.0 | 4.3 |
| Sample area (μm2) | 189414 | 159970 | 171206 |
In Vivo Test
In Vivo Release Study
The in vivo release profile of Ext-3 rods is shown in Figure 11. Drug was released for approximately 40 days with slightly more released in the first week (day 7 mean ± sem = 3.74 ± 1.11) followed by a steady release rate between 7 and 21 (day 14 = 1.99 ± 0.76, day 21 = 1.74 ± 0.77). Release rate was further reduced on days 29 (0.83±0.21) and 37 (0.76±0.38), consistent with the in vitro release profile of Ext-3 (Figure 7C). Body weight of the rats increased steadily for both groups. There were no signs of inflammation or other differences in appearance between groups.
Figure 11.

In vivo serum concentration for 40% haloperidol 50:50 PLGA implants from Ext-3, 40% drug load. Drug was released for approximately 40 days with slightly more released in the first week (day 7 mean ± sem = 3.74 ± 1.11) followed by a steady release rate between 7 and 21 (day 14 = 1.99 ± 0.76, day 21 = 1.74 ± 0.77). Release rate was further reduced on days 29 (0.83±0.21) and 37 (0.76±0.38), consistent with the in vitro release profile of Ext-3 (Figure 7C).
Discussion
This study compared the pattern of in vitro drug release and analyzed surface morphology of haloperidol-PLGA implants fabricated through two different methods: solvent-casting and extrusion. As shown in Figure 4, steady release was achieved from 20% haloperidol solvent-cast pellets, consistent with previously published data 1,11,17. 40% haloperidol pellets showed a slightly different release pattern, possibly due to decreased hydrophilicity from the increased ratio of hydrophobic API. The increased haloperidol load also reduced the difference in slope between Phase 1 and Phase 2.
Despite favorable performance of these pellets, there were several disadvantages of the solvent-casting, including laborious processing, large amount of organic solvent required, and a long time period required to fully remove solvent from the mixture. All of these factors together make this process difficult to scale-up and apply to a clinical setting. Therefore, we examined the feasibility of fabricating comparable drug implants through extrusion, which is a continuous, solvent-free process that is more suitable for large scale clinical fabrication.
Previous studies revealed that in vitro release patterns of diclofenac sodium-PLGA implants fabricated by extrusion were not steady and further improvement of extrusion process was required 22. Similar studies also resulted in burst release and short release duration 23. We and others have previously suggested that the drug release profiles are influenced by the fabrication process, as well as the drug and materials used 1,24,25. In addition to the polymer used, drug type and percentage also influenced degradation rate of polymer matrices because less hydrophilic API shifted the degradation mechanism from bulk degradation to surface degradation 1. Increased ratio of drug to polymer also influenced mechanical properties, optimal processing temperature, and viscosity of the final product with resulting effects on release profile 26. We focused on fabricating 40% drug implants because increased drug load results in decreased implant volume, allowing for longer drug release periods (weeks to months) from comparably sized implants 8.
Extrusion parameters for Ext-1 were initially selected to be between the glass transition temperature of PLGA (43–48°C) and melting temperature of haloperidol (150–152°C). However, optimal conditions for extrusion could not be determined merely through these properties because the rheological properties, such as viscosity, were different for drug-polymer mixtures. Therefore, initial temperatures were determined empirically by several preliminary runs prior to Ext-1.
Unlike the steady drug release from solvent-cast pellets, Ext-1 rods showed 10-day lag (Phase 1) followed by 20-day release (Phase 2) for rods from the initial extrusion conditions. Rods had longer delay and shorter steady release compared to profiles from pellets. This may indicate a longer latency for water to penetrate the surface. We hypothesized that a barrier of polymer formed on the outer surface of the rods during extrusion due to contact with the hot surface of the transfer tube and exit aperture. This process could lead to fusion between PLGA particles or chains on the outer rod surface, similar to phenomenon called sintering in a previous study 27. Additionally, surface tension generated when fusion occurred could also result in pulling of PLGA chains from inner regions to the outer surface of the rods. These factors may have resulted in a concentration gradient with higher drug load in the inner portions of the rod, yielding both delayed drug release (initial lags obtained in all rods) as well as the accompanied decreased release of drug in early Phase 2. Although the densities of solvent-cast pellets (Table 2) and extruded rods (Table 3) are similar, the difference in release pattern may be due to uneven distribution of polymer in extruded rods.
Table 2.
Physical characteristics of solvent-cast pellets.
| Pellet | Weight(mg) | Radius(mm) | Thickness(mm) | Density(mg/mm3) |
|---|---|---|---|---|
| 20% drug #1 | 46.9 | 3 | 1.31 | 1.27 |
| 20% drug #2 | 48.1 | 3 | 1.35 | 1.26 |
| 20% drug #3 | 46.5 | 3 | 1.29 | 1.27 |
| 40% drug #1 | 50.1 | 3 | 1.45 | 1.22 |
| 40% drug #2 | 49.6 | 3 | 1.40 | 1.25 |
| 40% drug #3 | 49.5 | 3 | 1.41 | 1.24 |
Table 3.
Physical characterization of three portions of each set of extrusion conditions: Samples were taken from three lengths along each extrusion run, and are designated as 1, 2, and 3 starting with the initial portion of the run (−1) and proceeding to the latter portion of the extrusion stream (−3).
| Weight(mg) | Diameter(mm) | Length(mm) | Density(mg/mm3) | |
|---|---|---|---|---|
| Ext 1-1 | 43.7 | 2.0 | 10.9 | 1.3 |
| Ext 1-2 | 42.6 | 2.0 | 10.4 | 1.3 |
| Ext 1-3 | 45 | 2.0 | 11.1 | 1.3 |
| Ext 2-1 | 44.8 | 2.0 | 11.9 | 1.1 |
| Ext 2-2 | 41.5 | 2.0 | 10.9 | 1.1 |
| Ext 2-3 | 43.4 | 2.0 | 11.2 | 1.1 |
| Ext 3-1 | 50.9 | 2.0 | 12.8 | 1.3 |
| Ext 3-2 | 41.3 | 2.0 | 10.9 | 1.2 |
| Ext 3-3 | 43.1 | 2.0 | 10.9 | 1.3 |
Alternatively, we hypothesized that contact of the material with the screw should not contribute to this phenomenon because of the intense mixing forces. Thus fusion would only occur during the time at which rods left the extruder barrel and entered the die. Although the transit time in this section is only a few minutes, we suggested that it was enough to affect the polymer distribution in the outer portion of the rods because the processing temperature (76–82°C) was 30 degree higher than the Tg of PLGA (43–48°C). Additionally, a high percentage of drug may have lowered the viscosity of the mixture, which could facilitate polymer chain movement.
To examine this hypothesis, we lowered temperature in Zone 4 to reduce the driving force for polymer chains to move towards the surface and increased screw speed to decrease transit time to the aperture. In vitro studies revealed a shorter Phase 1 (7 days) followed by a shorter Phase 2 (14 days) as compared to Ext-1. Surface morphology analysis showed increased surface roughness on lateral surface and higher porosity on cross-sectional surfaces of Ext-2 rods. Increased roughness of lateral surface and a shorter Phase 1 in Ext-2 rods likely resulted from less sintering, consistent with our hypothesis that a surface polymer barrier led to longer delay in Ext-1. This phenomenon suggests that fewer pores on the surface may shift the PLGA degradation process from bulk degradation to surface degradation, which leads to more time required for solution to penetrate the surface of the rod. As a result, the lag period increased in proportion to increased surface integrity.
Although the lag caused by a putative polymer barrier was reduced in Ext-2, burst release in Phase 2 was still a problem, possibly due to pores inside the rods 28. Pore formation also decreased the density of these rods to 1.1 mg/mm 3 (Table 3). We suggested that these pores were formed due to poor mixing or discontinuity of the process. Since temperature in Zone 4 affected the surface of rods, we increased the temperatures in Zone 2 and Zone 3. In vitro release from Ext-3 rods showed 7 days of lag followed by 30-days of steady release. Surface morphology of Ext-3 rods showed there were fewer pores on the lateral surface as well as decreased roughness than those on Ext-2 rods. We suggest that this set of parameters caused sintering on the surface, but not enough to cause as long lag as Ext-1. Similar to cross-sectional surface morphology of solvent-cast pellets, cross-sectional micrographs and porosity analysis showed that significantly fewer pores were generated inside Ext 3 rods, suggesting that an increased temperature in the extruder chamber increased mixing. Improved mixing can also be inferred because Ext-3 displayed the highest consistency of drug load among the conditions tested.
In vivo serum levels ranged from about 1 to 4 ng/ml over the course of treatment. Studies of haloperidol decanoate in humans indicate that therapeutic doses yield peak serum levels of approximately 7 ng/ml one week after injection, which tapper to 2 ng/ml within 30 days 29. The higher level at seven days than at later time points likely results from a brief elevation in drug release during phase 2 following initial implant hydration during the lag period (phase 1) as noted in the in vitro release curves. This corresponds well to the initiation of drug release in vitro noted for Ext-3 in Figure 7C. Thus the implants used in the current study provided roughly half of the human level from implants designed to deliver approximately one quarter of the human dose (0.5 mg/day in rat as compared to 2 mg/day using haloperidol depot). Although it is difficult to match doses accurately between rat and human due to large interspecies variation in metabolism (three to ten fold higher doses needed for biological effects in rat as compared to human), these data suggest that small PLGA implants in the current study can deliver clinically applicable doses 11,17.
Conclusion
These results suggest that it is possible to translate the previous laboratory-based solvent-casting methods to a more scalable extrusion process for human use.
Future Work
Future work will focus on extension to other types of PLGA polymers (molar ratios and molecular weights) with different drug loads, depending on the desired release period and amount of drug to be released. Additional pharmacokinetic studies in other species and behavioral tests will also be performed to further examine the potential efficacy of extruded haloperidol-PLGA implants.
Acknowledgments
Funding for this project was provided by The Stanley Medical Research Institute (RCG 01-314, SJS) and the National Institute of Mental Health (R01MH074672-01, SJS)
References
- 1.Siegel SJ, Kahn JB, Metzger K, Winey KI, Werner K, Dan N. Effect of drug type on the degradation rate of PLGA matrices. Eur J Pharm Biopharm. 2006;64(3):287–93. doi: 10.1016/j.ejpb.2006.06.009. [DOI] [PubMed] [Google Scholar]
- 2.Marder SR. Facilitating compliance with antipsychotic medication. J Clin Psychiatry. 1998;59 (Suppl 3):21–5. [PubMed] [Google Scholar]
- 3.Nasrallah HA. The case for long-acting antipsychotic agents in the post-CATIE era. Acta Psychiatr Scand. 2007;115(4):260–7. doi: 10.1111/j.1600-0447.2006.00982.x. [DOI] [PubMed] [Google Scholar]
- 4.Knox ED, Stimmel GL. Clinical review of a long-acting, injectable formulation of risperidone. Clinical Therapeutics. 2004;26(12):1994–2002. doi: 10.1016/j.clinthera.2004.12.009. [DOI] [PubMed] [Google Scholar]
- 5.Bhanji NH, Chouinard G, Margolese HC. A review of compliance, depot intramuscular antipsychotics and the new long-acting injectable atypical antipsychotic risperidone in schizophrenia. Eur Neuropsychopharmacol. 2004;14(2):87–92. doi: 10.1016/S0924-977X(03)00109-3. [DOI] [PubMed] [Google Scholar]
- 6.Niaz OS, Haddad PM. Thirty-five months experience of risperidone long-acting injection in a UK psychiatric service including a mirror-image analysis of in-patient care. Acta Psychiatr Scand. 2007;116(1):36–46. doi: 10.1111/j.1600-0447.2006.00980.x. [DOI] [PubMed] [Google Scholar]
- 7.Schooler NR. Relapse and rehospitalization: comparing oral and depot antipsychotics. J Clin Psychiatry. 2003;64 (Suppl 16):14–7. [PubMed] [Google Scholar]
- 8.McEvoy JP. Risks versus benefits of different types of long-acting injectable antipsychotics. J Clin Psychiatry. 2006;67 (Suppl 5):15–8. [PubMed] [Google Scholar]
- 9.Olfson M, Marcus SC, Ascher-Svanum H. Treatment of Schizophrenia With Long-Acting Fluphenazine, Haloperidol, or Risperidone. Schizophr Bull. 2007 doi: 10.1093/schbul/sbm033. [DOI] [PMC free article] [PubMed] [Google Scholar]
- 10.Irani F, Dankert M, Brensinger C, Bilker WB, Nair SR, Kohler CG, Kanes SJ, Turetsky BI, Moberg PJ, Ragland JD, et al. Patient attitudes towards surgically implantable, long-term delivery of psychiatric medicine. Neuropsychopharmacology. 2004;29(5):960–8. doi: 10.1038/sj.npp.1300385. [DOI] [PubMed] [Google Scholar]
- 11.Siegel SJ, Winey KI, Gur RE, Lenox RH, Bilker WB, Ikeda D, Gandhi N, Zhang WX. Surgically implantable long-term antipsychotic delivery systems for the treatment of schizophrenia. Neuropsychopharmacology. 2002;26(6):817–23. doi: 10.1016/S0893-133X(01)00426-2. [DOI] [PubMed] [Google Scholar]
- 12.Gomes AJ, Lunardi CN, Lunardi LO, Pitol DL, Machado AE. Identification of psoralen loaded PLGA microspheres in rat skin by light microscopy. Micron. 2007 doi: 10.1016/j.micron.2007.06.015. [DOI] [PubMed] [Google Scholar]
- 13.Budhian A, Siegel SJ, Winey KI. Haloperidol-loaded PLGA nanoparticles: Systematic study of particle size and drug content. Int J Pharm. 2006 doi: 10.1016/j.ijpharm.2006.11.061. [DOI] [PubMed] [Google Scholar]
- 14.Schnieders J, Gbureck U, Thull R, Kissel T. Controlled release of gentamicin from calcium phosphate-poly(lactic acid-co-glycolic acid) composite bone cement. Biomaterials. 2006;27(23):4239–49. doi: 10.1016/j.biomaterials.2006.03.032. [DOI] [PubMed] [Google Scholar]
- 15.Weinberg BD, Ai H, Blanco E, Anderson JM, Gao J. Antitumor efficacy and local distribution of doxorubicin via intratumoral delivery from polymer millirods. J Biomed Mater Res A. 2007;81(1):161–70. doi: 10.1002/jbm.a.30914. [DOI] [PubMed] [Google Scholar]
- 16.Vasir JK, Labhasetwar V. Biodegradable nanoparticles for cytosolic delivery of therapeutics. Adv Drug Deliv Rev. 2007;59(8):718–28. doi: 10.1016/j.addr.2007.06.003. [DOI] [PMC free article] [PubMed] [Google Scholar]
- 17.Metzger KL, Shoemaker JM, Kahn JB, Maxwell CR, Liang Y, Tokarczyk J, Kanes SJ, Hans M, Lowman AM, Dan N, et al. Pharmacokinetic and behavioral characterization of a long-term antipsychotic delivery system in rodents and rabbits. Psychopharmacology (Berl) 2007;190(2):201–11. doi: 10.1007/s00213-006-0616-8. [DOI] [PubMed] [Google Scholar]
- 18.Rabin C, Liang Y, Ehrlichman RS, Budhian A, Metzger KL, Majewski-Tiedeken C, Winey KI, Siegel SJ. In vitro and in vivo demonstration of risperidone implants in mice. Schizophr Res. 2008;98(1–3):66–78. doi: 10.1016/j.schres.2007.08.003. [DOI] [PMC free article] [PubMed] [Google Scholar]
- 19.Breitenbach J. Melt extrusion: from process to drug delivery technology. Eur J Pharm Biopharm. 2002;54(2):107–17. doi: 10.1016/s0939-6411(02)00061-9. [DOI] [PubMed] [Google Scholar]
- 20.Widmer MS, Gupta PK, Lu L, Meszlenyi RK, Evans GR, Brandt K, Savel T, Gurlek A, Patrick CW, Jr, Mikos AG. Manufacture of porous biodegradable polymer conduits by an extrusion process for guided tissue regeneration. Biomaterials. 1998;19(21):1945–55. doi: 10.1016/s0142-9612(98)00099-4. [DOI] [PubMed] [Google Scholar]
- 21.Miller DA, McConville JT, Yang W, Williams RO, 3rd, McGinity JW. Hot-melt extrusion for enhanced delivery of drug particles. J Pharm Sci. 2007;96(2):361–76. doi: 10.1002/jps.20806. [DOI] [PubMed] [Google Scholar]
- 22.Viitanen P, Suokas E, Tormala P, Ashammakhi N. Release of diclofenac sodium from polylactide-co-glycolide 80/20 rods. J Mater Sci Mater Med. 2006;17(12):1267–74. doi: 10.1007/s10856-006-0601-0. [DOI] [PubMed] [Google Scholar]
- 23.Desai KG, Mallery SR, Schwendeman SP. Formulation and Characterization of Injectable Poly(DL: -lactide-co-glycolide) Implants Loaded with N-Acetylcysteine, a MMP Inhibitor. Pharm Res. 2007 doi: 10.1007/s11095-007-9430-1. [DOI] [PMC free article] [PubMed] [Google Scholar]
- 24.Hsu YY, Gresser JD, Trantolo DJ, Lyons CM, Gangadharam PR, Wise DL. Effect of polymer foam morphology and density on kinetics of in vitro controlled release of isoniazid from compressed foam matrices. J Biomed Mater Res. 1997;35(1):107–16. doi: 10.1002/(sici)1097-4636(199704)35:1<107::aid-jbm11>3.0.co;2-g. [DOI] [PubMed] [Google Scholar]
- 25.Lemmouchi Y, Schacht E, Kageruka P, De Deken R, Diarra B, Diall O, Geerts S. Biodegradable polyesters for controlled release of trypanocidal drugs: in vitro and in vivo studies. Biomaterials. 1998;19(20):1827–37. doi: 10.1016/s0142-9612(98)00074-x. [DOI] [PubMed] [Google Scholar]
- 26.Bhardwaj R, Blanchard J. In vitro evaluation of Poly(,-lactide-co-glycolide) polymer-based implants containing the [alpha]-melanocyte stimulating hormone analog, Melanotan-I. Journal of Controlled Release. 1997;45(1):49–55. [Google Scholar]
- 27.Jiang T, Abdel-Fattah WI, Laurencin CT. In vitro evaluation of chitosan/poly(lactic acid-glycolic acid) sintered microsphere scaffolds for bone tissue engineering. Biomaterials. 2006;27(28):4894–903. doi: 10.1016/j.biomaterials.2006.05.025. [DOI] [PubMed] [Google Scholar]
- 28.Luan X, Bodmeier R. Modification of the tri-phasic drug release pattern of leuprolide acetate-loaded poly(lactide-co-glycolide) microparticles. Eur J Pharm Biopharm. 2006;63(2):205–14. doi: 10.1016/j.ejpb.2005.12.010. [DOI] [PubMed] [Google Scholar]
- 29.Regenthal R, Kunstler U, Junhold U, Preiss R. Haloperidol serum concentrations and D2 dopamine receptor occupancy during low-dose treatment with haloperidol decanoate. Int Clin Psychopharmacol. 1997;12(5):255–61. doi: 10.1097/00004850-199709000-00002. [DOI] [PubMed] [Google Scholar]