Abstract
Background & Aims
Mechanisms of the progression from Barrett’s oesophagus (BO) to oesophageal adenocarcinoma (OA) are not fully understood. Bile acids may play an important role in this progression. The aim of this study is to examine the role of NADPH oxidase NOX5-S and a novel bile acid receptor TGR5 in taurodeoxycholic acid (TDCA)-induced increase in cell proliferation.
Methods
Human Barrett’s cell line BAR-T and OA cell line FLO were transfected by using Lipofectamine 2000 or Amaxa-Nucleofector-System. mRNAs were measured by real-time PCR. H2O2 was measured by a fluorescent assay. Cell proliferation was determined by measurement of thymidine incorporation.
Results
NOX5-S was present in FLO cells. TDCA significantly increased NOX5-S expression, H2O2 production and thymidine incorporation in FLO and BAR-T cells. This increase in thymidine incorporation was significantly reduced by knockdown of NOX5-S. TGR5 mRNA and protein levels were significantly higher in OA tissues than in normal oesophageal mucosa or Barrett’s mucosa. Knockdown of TGR5 markedly inhibited TDCA-induced increase in NOX5-S expression, H2O2 production and thymidine incorporation in FLO and BAR-T cells. Overexpression of TGR5 significantly enhanced the effects of TDCA in FLO cells. TGR5 receptors were coupled with Gαq and Gαi-3 proteins, but only Gαq mediated TDCA-induced increase in NOX5-S expression, H2O2 production and thymidine incorporation in FLO cells.
Conclusions
TDCA-induced increase in cell proliferation depends on upregulation of NOX5-S expression in BAR-T and FLO cells. TDCA-induced NOX5-S expression may be mediated by activation of the TGR5 receptor and Gαq protein. Our data may provide potential targets to prevent and/or treat Barrett’s OA.
Keywords: bile acid receptor, NADPH oxidase, G proteins, Barrett’s oesophagus, oesophageal adenocarcinoma
Introduction
The incidence of oesophageal adenocarcinoma (OA) has increased by more than 6 fold in the past three decades.[1] Gastroesophageal reflux disease (GERD) complicated by Barrett’s oesophagus (BO) is a major risk factor for OA.[2] The major components of the refluxate in gastroesophageal reflux disease may contain oro-esophageal (saliva, esophageal secretions), gastric (acid, pepsin, mucus) and duodenal (bile salts, trypsin, and lipase) components.[3] Acid and bile acids, present in refluxate, may be major risk factors for the progression from BO to OA.[4–6] However, the mechanisms of this progression are not fully understood.
Acid reflux may mediate the progression from metaplasia to dysplasia and to OA in patients with BO because of the following: 1) cultured biopsy specimens of intestinal metaplastic cells demonstrate a significant increase in tritiated thymidine uptake when explants are briefly exposed to acid;[7] 2) long-term inhibition of oesophageal acid exposure by administration of proton pump inhibitors to patients with BO has been shown to decrease proliferation of metaplastic cells;[8] 3) a prospective study showed that proton pump inhibitor treatment significantly reduced the incidence of dysplasia in BO patients, when compared with no therapy or treatment with H2 receptor antagonists.[9]
In addition to acid reflux, there is increasing evidence that bile acids may also contribute to the progression from BO to OA [10, 11] since 1) in animal models, diversion of duodenal contents into the lower oesophagus leads to OA;[12–14] 2) reflux of bile acids into the oesophagus not only causes short-term damage to the mucosa but also induces long-term oxidative stress, and cellular DNA damage;[15, 16] 3) bile salts may induce upregulation of cyclooxygenase-2 and c-myc expression,[17, 18] and activate mitogen activated protein (MAP) kinase and NF-κB pathways,[19, 20] thereby increasing cell proliferation and decreasing cell apoptosis. However, mechanisms whereby bile acids promote the development of OA are not known.
Recently, a novel cell membrane receptor of bile acid, TGR5 (a G-protein-coupled receptor) has been shown to be important in bile acid-regulated lipid metabolism, energy homeostasis, and glucose metabolism.[21–23] Whether TGR5 receptor mediates bile acid-induced increase in cell proliferation is not known. Bile acids also have been reported to induce production of reactive oxygen species (ROS) in OA cells.[24] In our previous studies, we have demonstrated that acid exposure increases H2O2 production and cell proliferation, an increase which is blocked by knockdown of NOX5-S, suggesting that NADPH oxidase NOX5-S mediates acid induced-increase in H2O2 production and cell proliferation.[4, 5] Whether NADPH oxidases mediate bile acid-induced increase in cell proliferation and ROS production is not known. We now show that taurodeoxycholic acid (TDCA, a bile salt)-induced increase in cell proliferation depends on upregulation of NOX5-S expression. To our knowledge we are the first to report that TDCA-induced NOX5-S expression is mediated by activation of the TGR5 receptor and Gαq protein in OA cells.
Material and Methods
Cell Culture and TDCA Treatment
Human Barrett’s adenocarcinoma cell line FLO was derived from human oesophageal Barrett’s adenocarcinomas[25] and generously provided by Dr. David Beer (University of Michigan Medical School). Cells were cultured in DMEM containing 10 % fetal bovine serum and antibiotics at 37 °C with 5 % CO2 humidified atmosphere.
Human Barrett's cell line BAR-T was derived from oesophageal mucosal biopsies of patients with BO (intestinal metaplasia) and immortalized with telomerase as described previously.[26] Cells were cultured in wells precoated with collagen IV (1 µg/cm2; BD Bioscience, Bedford, MA) and in Keratinocyte Medium-2 (Ca2+-free solution, Cambrex, Rockland, ME) supplemented with 1.8 mM CaCl2, 5% fetal bovine serum, 400 ng/ml hydrocortisone, 20 ng/ml epidermal growth factor, 0.1 nM cholera toxin, 20 µg/ml adenine, 5 µg/ml insulin, 70 µg/ml bovine pituitary extract, and antibiotics.
For TDCA treatment, FLO and BAR-T cells were incubated with different concentrations of TDCA for 24 h. Then, the culture medium and cells were collected for measurements.
Human oesophageal tissues
Normal oesophageal mucosa, Barrett’s mucosa and OA tissues were obtained from patients with OA undergoing esophagogastrectomy. The experimental protocols were approved by the Human Research Institutional Review Committee at Rhode Island Hospital.
Construction of pCDNA3.1-TGR5 plasmid
The DNA fragment encoding TGR5 gene (G protein-coupled bile acid receptor 1) (GenBank® accession number BC033625) was PCR-amplified from human cDNA with the following primers: TGR5-sense: 5’-GCAAGCTTATGACGCCCAACAGCACTGGCGAG-3’ (the introduced Hind III is underlined) and TGR5-antisense: 5’-GCTCTAGAGTTCA AGTCCAGGTCGACACTGCT-3’ (the introduced XbaI is underlined). The cDNA fragment obtained above were first cloned into pGEM®-T Easy Vector (Promega, Madison,Wisconsin,USA), verified by sequencing, and then subcloned into pCDNA3.1 between Hind III and Xba I to obtain TGR5 expression plasmid pCDNA3.1-TGR5.
Detecting of NOX5 in FLO OA Cells
The primers used for detecting of NOX5 in FLO OA cells were as follows: 5-ATGGGCTACGTGGTAGTGGGGC-3 (2F), 5-ATGGAGAACCTGACCATCAGC-3 (3F), 5-TTGGGCCCATGAAAGATGAGCA-3 (2R), 5-GTGTGAGCCACAGTGTGCACG-3 (3R), 5-AGCCCCACTACCACGTAGCCC-3 (4R), 5-AGTGGGCAGCGCTGATGGTC-3 (5R), and 5-CTAGAAATTCTCTTGGAAAAATCTG-3 (6R). Three primers (3R for RT, 4R and 5R for nested PCR) were used to amplify the 5′-end of NOX5 using a 5′-RACE kit (Invitrogen, Grand Island, NY). PCR products were gel-extracted, and sequenced by GENEWIZ, Inc. (South Plainfield, NJ).
Small Interfering RNA (siRNA) and Plasmid Transfection
24 h before transfection at 70–80% confluence, cells were trypsinized (1–3 ×10⁵ cells/ml) and transferred to 12-well plates. Transfection of siRNAs was carried out with Lipofectamine 2000 (Invitrogen, Grand Island,New York, USA) according to the manufacturer’s instruction. Per well, 75 pmol of siRNA duplex of NOX5, TGR5, Gαq, Gαi3 or control siRNA formulated into liposomes were applied; the final volume was 1.2 ml/well. 48 h after transfection, cells were treated without or with TDCA (10−11 M) in culture medium (pH 7.2, without phenol red) for 24 h, and then the culture medium and cells were collected for measurements. Transfection efficiencies were determined by fluorescence microscopy after transfection of Block-it fluorescent oligonucleotide (Invitrogen, Grand Island,New York, USA) and were about 70% at 48 h.
For transfection of pCDNA3.1-TGR5 plasmid, FLO cells (70% confluence, approx. 5×10⁶ cells) were transfected with 2 µg of pCDNA3.1-TGR5 or control plasmids using Amaxa-Nucleofector-System (Lonza, Allendale, NJ, USA) according to the manufacturer’s instructions. 24 h after transfection, cells were treated with TDCA (10−11 M) for additional 24 h and then the culture medium and cells were collected for measurements. Transfection efficiencies were determined by fluorescence microscopy after transfection of pmax-GFP (Lonza, Allendale, NJ, USA) and were about 90% at 48 h.
Reverse Transcription-PCR
Total RNA was extracted by TRIzol reagent (Invitrogen, Grand Island,New York, USA) and purified by the total RNA purification system (Invitrogen, Grand Island,New York, USA). According to the protocols of the manufacturers, 1.5 µg of total RNAs from cultured cells was reversely transcribed by using a SuperScript® First-Strand Synthesis System for RT-PCR (Invitrogen).
Quantitative Real Time PCR
Quantitative real time PCR was carried out on a Stratagene Mx4000®multiplex quantitative PCR system (Stratagene, La Jolla, CA, USA). The primers used were: NOX5-S sense (5’- AAGACTCCATCACGGGGCTGCA-3’), NOX5-S antisense (5’-CCTTCAGCACCTTGGCCAGA -3’), TGR5 sense (5’-CTGGCCCTGGCAAGCCTCAT-3’), TGR5 antisense (5’-CTGCCATGTAGCGCTCCCCGT-3’), 18S sense (5’- CGGACAGGATTGACAGATTGATAGC -3’), and 18S antisense (5’- TGCCAGAGTCTCGTTCGTTATCG -3’). All reactions were performed in triplicate in a 25 µl total volume containing a 1×concentration of Brilliant® SYBR® Green QPCR Master Mix (Stratagene), the concentration of each sense and antisense primer were 100 nM, 1 µl cDNA, and 30 nM reference dyes. Reactions were carried out in a Stratagene Mx4000®multiplex quantitative PCR system for one cycle at 94 °C for 5 min; 40 cycles at 94 °C for 30 s, 59 °C for 30 s, and 72 °C for 30 s; one cycle at 94 °C for 1 min; and one cycle at 55 °C for 30 s. The transcript level of each specific gene was normalized to GAPDH or 18S amplification.
Coupling To Immunoprecipitation Matrix And Immunoprecipitation Experiments
TGR5 Antibody (5 µg) were coupled to 40–50 µl of suspended IP matrix (Santa Cruz Biotechnology, Santa Cruz, California, USA) in 500 µl phosphate-buffered saline as recommended by the manufacturer, incubated at 4 °C on a rotator overnight. 48 h after pCDNA3.1-TGR5 transfection, cells were lysed in Triton X lysis buffer containing 50 mM Tris_HCl (pH 7.5), 100 mM NaCl, 50 mM NaF, 5mM EDTA, 1% (v/v) Triton X-100, 40 mM β-glycerol phosphate, 40 mM p-nitrophenylphosphate, 200 µM sodium orthovanadate, 100 µM phenylmethylsulfonyl fluoride, 1 µg/ml leupeptin, 1 µg /ml pepstatin A, and 1 µg /ml aprotinin. The supernatants were mixed with TGR5 antibody-IP matrix complex and incubated at 4 °C on a rotator for 5 h. The immunoadsorbents were recovered by centrifugation for 5 min at 700×g, washed three times with cell lysis buffer, mixed with SDS loading buffer (Sigma), and heated at 100 °C for 5 min.
Western Blot Analysis
Cells were lysed in Triton X lysis buffer. The suspension was centrifuged at 15,000 ×g for 5 min, and the protein concentration in the supernatant was determined. Western blot was done as described previously.[27]
Primary antibodies used were as follows TGR5 antibody (1:1000), Gαq antibody (1:2000), Gαs antibody (1:1000), Gα13 antibody (1:1000), Gαi 3 antibody (1:1000), Gαi 1–2 antibody (1:1000), and GAPDH antibody (1:2000), NOX5 antibody was prepared against a mixture of unique NOX5 peptides (NH2-YESFKASDPLGRGSKRC-COOH and NH2-YRHQKRKHTCPS-COOH)[28] and used at a dilution of 1:1000.
[3H]Thymidine Incorporation
24 h after transfection with control siRNA, NOX5 siRNA or TGR5 siRNA, cells were treated without or with TDCA for 24 h and then incubated with methyl-[3H] thymidine (0.05 µCi/ml) for 4 h. After washing three times with phosphate-buffered saline, cells were collected and homogenized with a lysis buffer containing (pH 7.4): 50 mM HEPES, 50 mM NaCl, 1% Triton X-100, 1% Nonidet P-40, 0.1 mM phenylmethylsulfonyl fluoride and 1 mM dithiothreitol. Methyl-[3H] thymidine uptake was measured in a scintillation counter. The level of protein in the homogenates was also determined and the level of methyl-[3H] thymidine incorporation was normalized to protein content.
Amplex® Red Hydrogen Peroxide Fluorescent Assay
Levels of H2O2 in culture medium were determined by using the Amplex® Red H2O2 assay kit (Molecular Probes, Inc., Eugene, OR) according to the manufacturer’s instruction. Fluorescence is measured with a fluorescence microplate reader using excitation at 550 nm and emission detection at 590 nm.
Materials
Methyl-[3H]-thymidine was purchased from PerkinElmer (Waltham, MA) and human NOX5 siRNA from Ambion Inc. (Austin, TX); TGR5 siRNA, TGR5 antibody, Gα13 antibody, and GAPDH antibody were bought from Santa Cruz Biotechnology, Inc. (Santa Cruz, CA). Gαq antibody, Gαs antibody, Gαi 3 antibody, and Gαi 1–2 antibody were purchased from EMD Chemicals, Inc. (Gibbstown, NJ). TDCA, hydrocortisone, epidermal growth factor, cholera toxin, adenine, insulin, bovine pituitary extract, Triton X-100, phenylmethylsulfonyl-fluoride, and other reagents were purchased from Sigma (St. Louis, MO).
Statistical Analysis
Data is expressed as mean ± S.E. Statistical differences between two groups were determined by Student’s t test. Differences between multiple groups were tested using analysis of variance (ANOVA) and checked for significance using Fisher’s protected least significant difference test.
Results
Effect of TDCA on NOX5-S Expression and ROS Production
We have previously shown that NADPH oxidase NOX5-S is overexpressed in Barrett’s oesophagus with high-grade dysplasia, mediates acid-induced hydrogen peroxide production, and increases cell proliferation.[4] To test which NADPH oxidase isoforms exist in OA FLO cells, we performed RT-PCR and 5’-RACE. RT-PCR demonstrated that NOX5 was the only NADPH oxidase expressed in FLO OA cells (Fig. 1A).
Figure 1. Expression of NADPH oxidases in FLO OA cells.
(A) RT-PCR showed that only NOX5 was detectable in human oesophageal adenocarcinoma cells FLO. (B) Only one band was detected in FLO OA cells by 5’-RACE using the primers abridged universal amplification primer and 5R (11–31 from ATG). The size of this PCR product was consistent with NOX5-S but not with NOX5 α, β, δ or γ.
NOX5 has isoforms α, β, δ and γ or NOX5-S.[29] Figure 1B showed that only one band (around 200bp) was detected by 5’-RACE (Fig. 1B) using the primers abridged universal amplification primer and 5R (+11 to +31 from ATG). The size of this PCR product was consistent with NOX5-S but not with the other NOX5 isoforms. NOX5-S in FLO cells was sequenced, and this sequence was consistent with previously reported (Gen-BankTM accession number AF317889) (data not shown). These data confirmed that NOX5-S may be the major isoform of NOX5 present in FLO OA cells
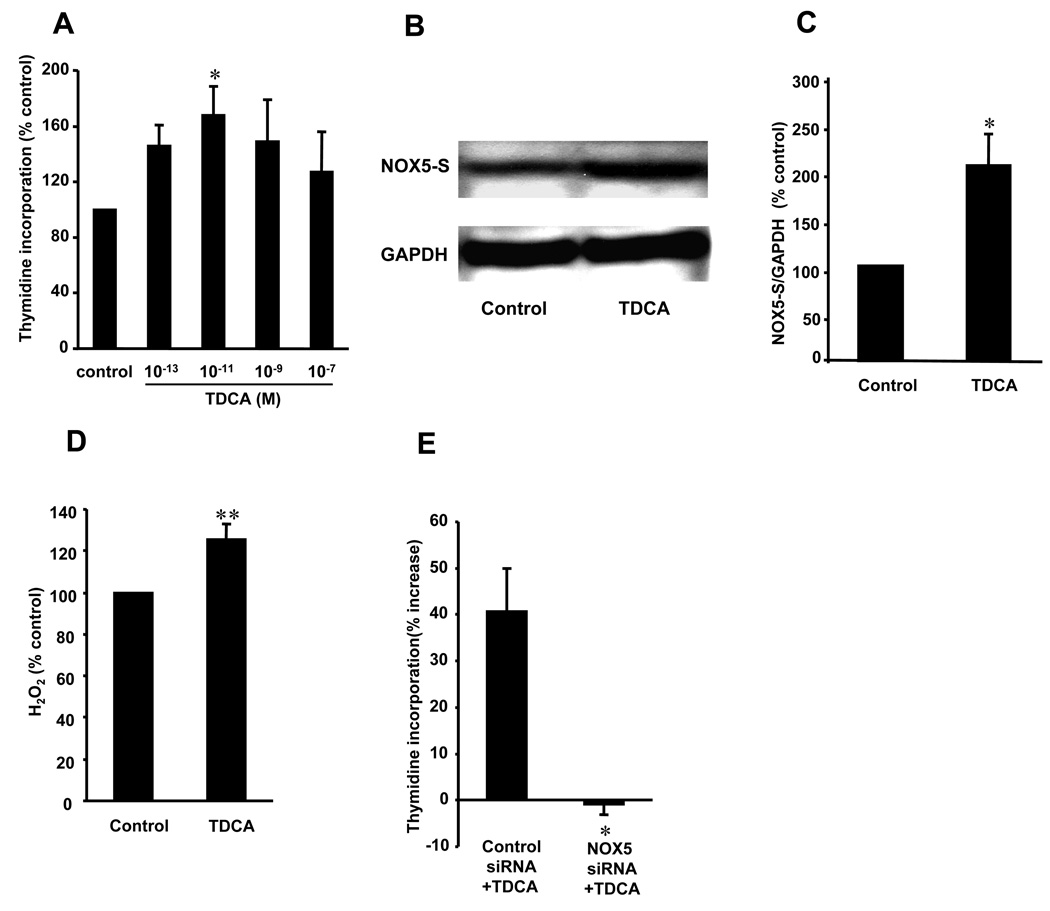
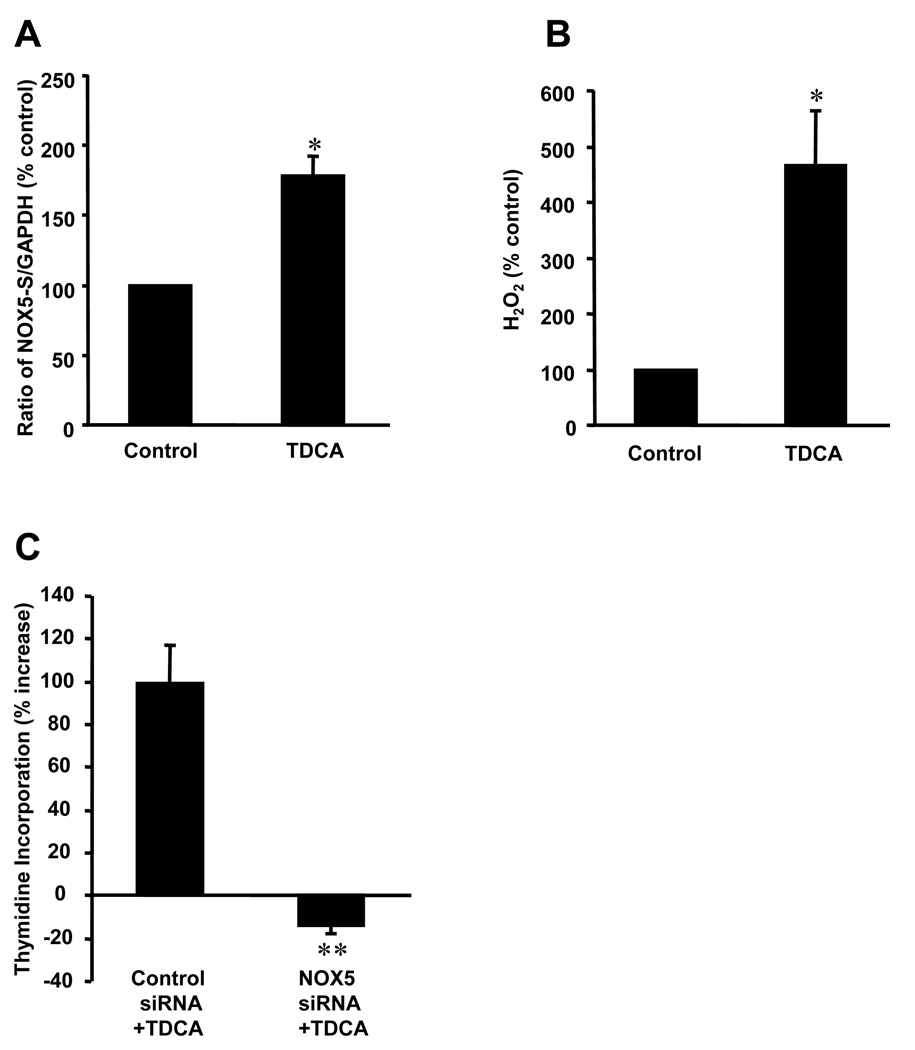
To determine whether bile salts increase NOX5-S expression and induce production of ROS, FLO cells were exposed to TDCA as described in material and method. We found that low dose of TDCA (10−11M), but not higher doses, significantly increased thymidine incorporation (Fig. 2A), suggesting that low dose of TDCA may increase cell proliferation. Similarly, 10−11M TDCA significantly increased thymidine incorporation in BAR-T cells (figure 3C). In addition, low dose of TDCA significantly increased NOX5-S expression (Fig. 2, B–C; Fig 3A) and H2O2 production (Fig. 2D; Fig 3B) in FLO OA cells and BAR-T cells. Fig. 2E and Fig 3C showed that knockdown of NOX5-S with NOX5 siRNA significantly decreased TDCA-induced increase in thymidine incorporation in FLO OA cells and BAR-T cells. NOX5 siRNA has been shown by us to effectively knock down NOX5-S protein in OA cells.[4] The data suggest that low dose of TDCA may increase NOX5-S expression, H2O2 production and cell proliferation in FLO cells and BAR-T cells.
Figure 2. NOX5-S expression, H2O2 production and cell proliferation after TDCA treatment in FLO OA cells.
(A) 10−11M taurodeoxycholic acid (TDCA, 24h) significantly increased 3H-thymidine incorporation. (B) Western blot analysis, (C) summarized data and (D) H2O2 measurement showed that 10−11 M TDCA significantly increased NOX5-S expression and H2O2 production. (E) Knockdown of NOX5-S by NOX5 small interfering RNA blocked TDCA-induced increase in thymidine incorporation. The data suggest that TDCA may increase NOX5-S expression, H2O2 production and cell proliferation in FLO cells and that TDCA-induced increase in cell proliferation may depend on activation of NOX5-S. N=3, ANOVA, * P<0.05, ** P<0.01, compared with control.
Figure 3. NOX5-S expression, H2O2 production and cell proliferation after TDCA treatment in BAR-T cells.
(A) Real time PCR data and (B) H2O2 measurement showed that TDCA (10−11 M) significantly increased NOX5-S mRNA level and H2O2 production. (C) Knockdown of NOX5-S by NOX5 small interfering RNA blocked TDCA-induced increase in thymidine incorporation in BAR-T cells. The data suggest that TDCA (low dose) may increase NOX5-S expression, H2O2 production and cell proliferation in BAR-T cells and that TDCA-induced increase in cell proliferation may depend on activation of NOX5-S. N=3, ANOVA,*P<0.01, compare with control, **P<0.05, compare with control siRNA+TDCA.
Role of TGR5 Receptors in TDCA-Induced NOX5-S Expression and ROS Production
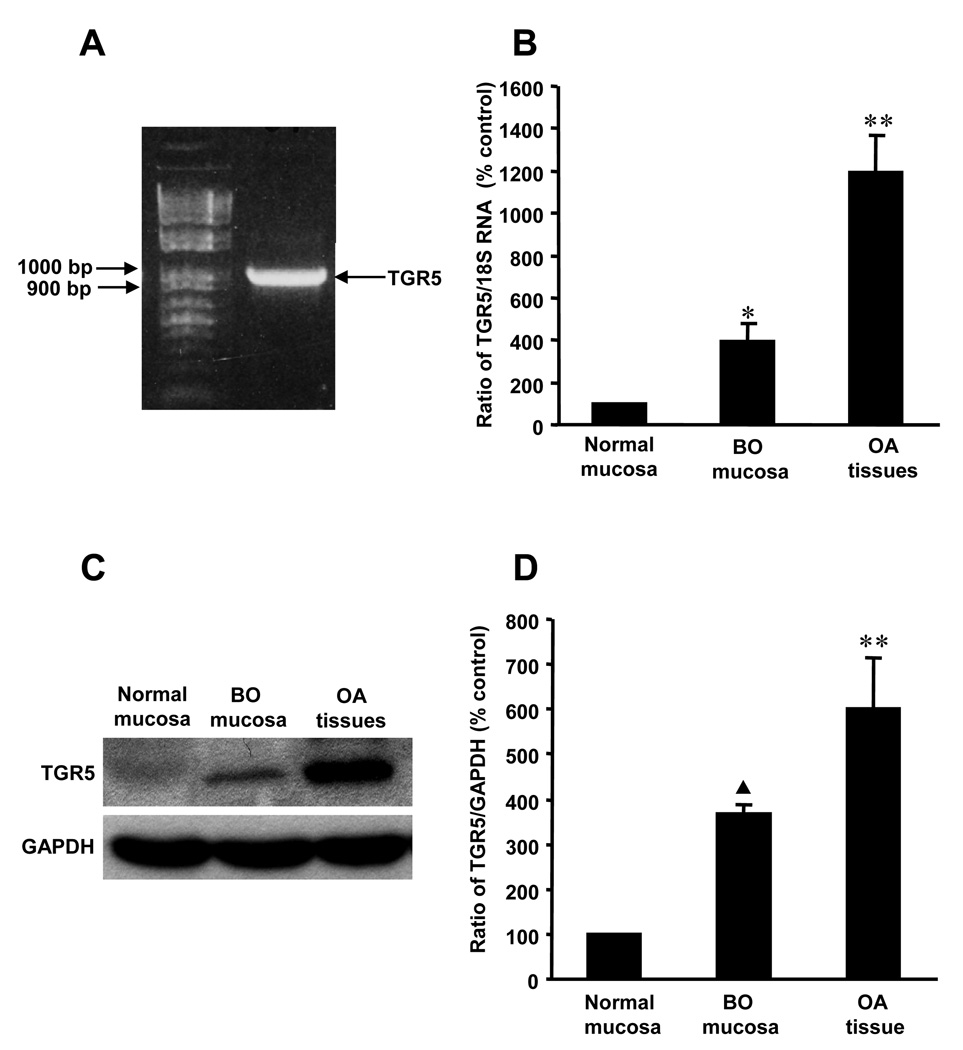
The G protein-coupled bile acid receptor 1 (TGR5) has been reported to be a cell surface receptor and mediates different biological functions of bile acids.[21, 30] To test whether this receptor is present in FLO cells, we did RT-PCR. RT-PCR showed that TGR5 mRNA was detectable in FLO cells (Fig. 4A). The PCR product was sequenced and confirmed to be TGR5. Western blot analysis also showed that TGR5 protein was present in FLO cells (Fig. 5A). Next we measured TGR5 mRNA levels and protein levels in different tissues by real-time PCR and Western blot analysis. We found that TGR5 mRNA and protein expression were significantly increased in Barrett’s mucosa (Fig. 4B, N=12; Fig. 4C–D, N=3), when compared with normal mucosa. Furthermore, TGR5 expression was much higher in human OA tissue, when compared with normal mucosa or Barrett’s mucosa. The data suggest that TGR5 receptors may be important in the development of OA.
Figure 4. Expression of TGR5.
(A) RT-PCR showed that TGR5 was detectable in human oesophageal adenocarcinoma cells FLO. (B) Real time RT-PCR (N=12), (C) Western Blot analysis and (D) summarized data (N=3) showed that the levels of TGR5 mRNA and protein expression were significantly increased in BO mucosa, when compared with normal oesophageal mucosa. TGR5 mRNA and protein levels are significantly higher in OA tissue than in normal oesophageal mucosa or in BO mucosa, supporting the importance of TGR5 in the development of OA. ANOVA,*P<0.01, ▲P<0.05, compared with normal oesophageal mucosa, **P<0.01, compared with BO mucosa.
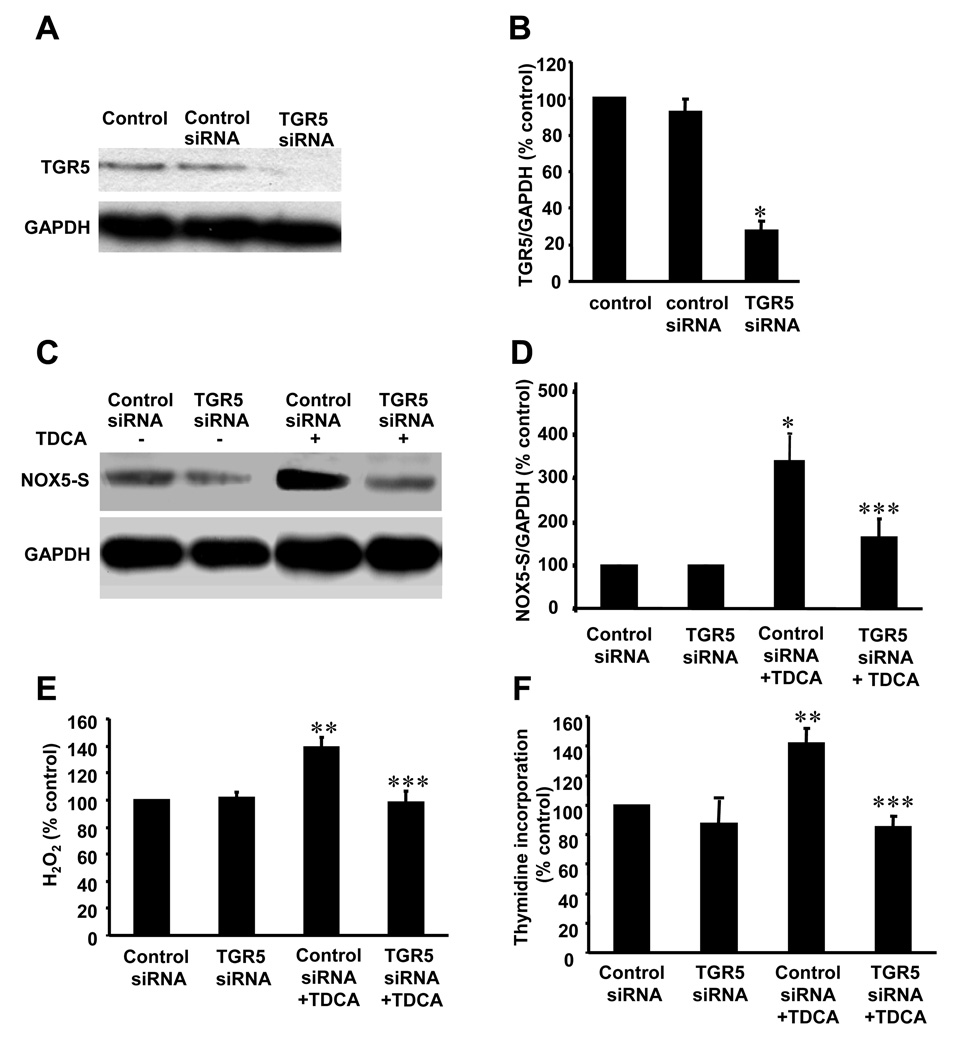
Figure 5. Role of TGR5 in TDCA-induced NOX5-S expression in FLO OA cells.
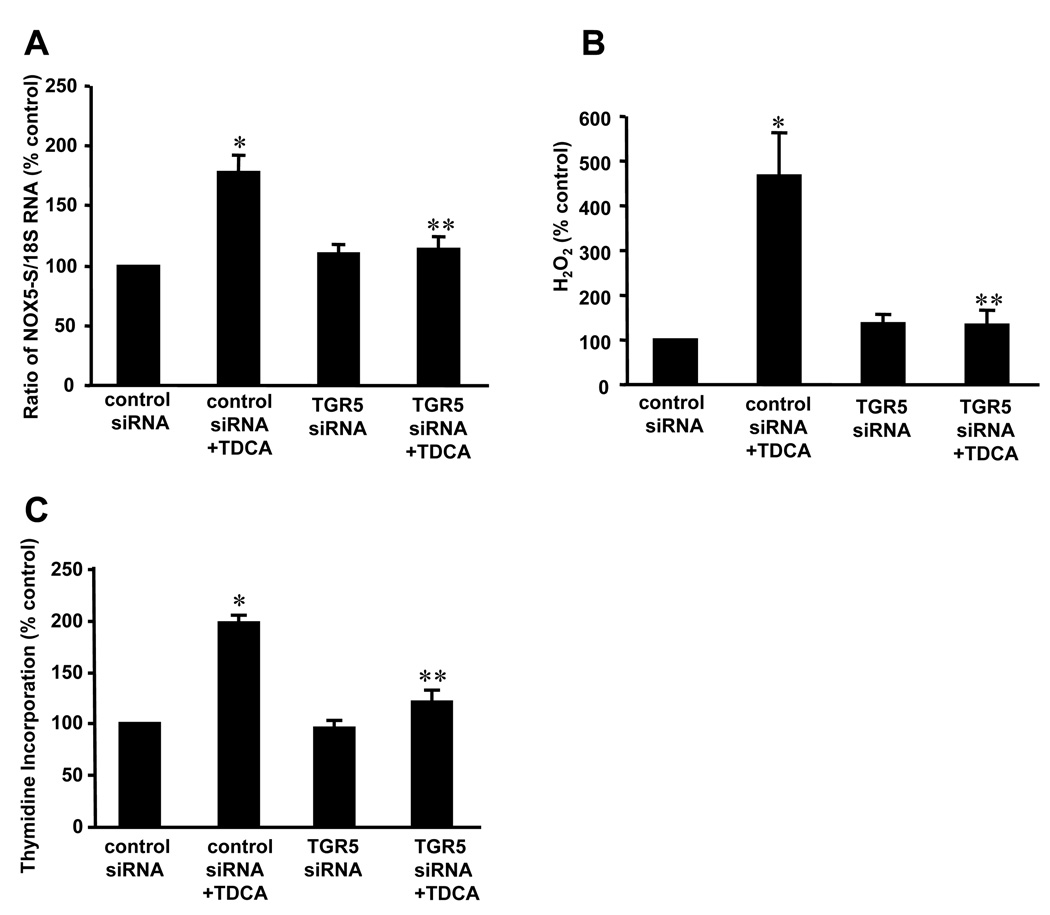
(A) Western blot analysis and (B) summarized data showed that transfection with TGR5 siRNA significantly decreased TGR5 protein expression in FLO cells, indicating that TGR5 siRNA effectively knocked down TGR5 protein expression (n=3). (C) Western blot analysis and (D) summarized data showed that knockdown of TGR5 significantly decreased TDCA-induced NOX5-S expression. (E) Knockdown of TGR5 significantly decreased TDCA-induced H2O2 production. (F) Knockdown of TGR5 significantly decreased TDCA-induced thymidine incorporation. The data suggest that TGR5 receptor may mediate TDCA-induced NOX5-S expression, H2O2 production and cell proliferation in FLO OA cells. N=3, ANOVA, * P<0.001, ** P<0.01, compared with control siRNA group; *** P<0.001, compared with control siRNA+TDCA group.
To test whether TGR5 is involved in TDCA-induced NOX5-S expression and H2O2 production, we used TGR5 siRNA to knock down TGR5. TGR5 siRNA significantly decreased TGR5 protein expression 48 h after transfection (Fig. 5A and 5B), indicating that TGR5 siRNA knocked down TGR5 effectively. Knockdown of TGR5 with TGR5 siRNA significantly reduced NOX5-S expression (Fig.5, C–D; Fig. 6A), H2O2 production (Fig. 5E, Fig. 6B) and thymidine incorporation (Fig. 5F, Fig.6C) in response to TDCA treatment both in FLO and BAR-T cells. These data suggest that TGR5 receptors may contribute to TDCA-induced increase in NOX5-S expression, H2O2 production and cell proliferation in FLO and BAR-T cells.
Figure 6. Role of TGR5 in TDCA-induced NOX5-S expression in BAR-T cells.
(A) Real time PCR data showed that knockdown of TGR5 significantly decreased TDCA-induced NOX5-S expression. (B) Knockdown of TGR5 significantly decreased TDCA-induced H2O2 production. (C) Knockdown of TGR5 significantly decreased TDCA-induced thymidine incorporation. The data suggest that TGR5 receptor may mediate TDCA-induced NOX5-S expression, H2O2 production and cell proliferation in BAR-T cells. N=3, ANOVA, *P<0.01, compare with control siRNA;**P<0.01, compare with control siRNA+TDCA.
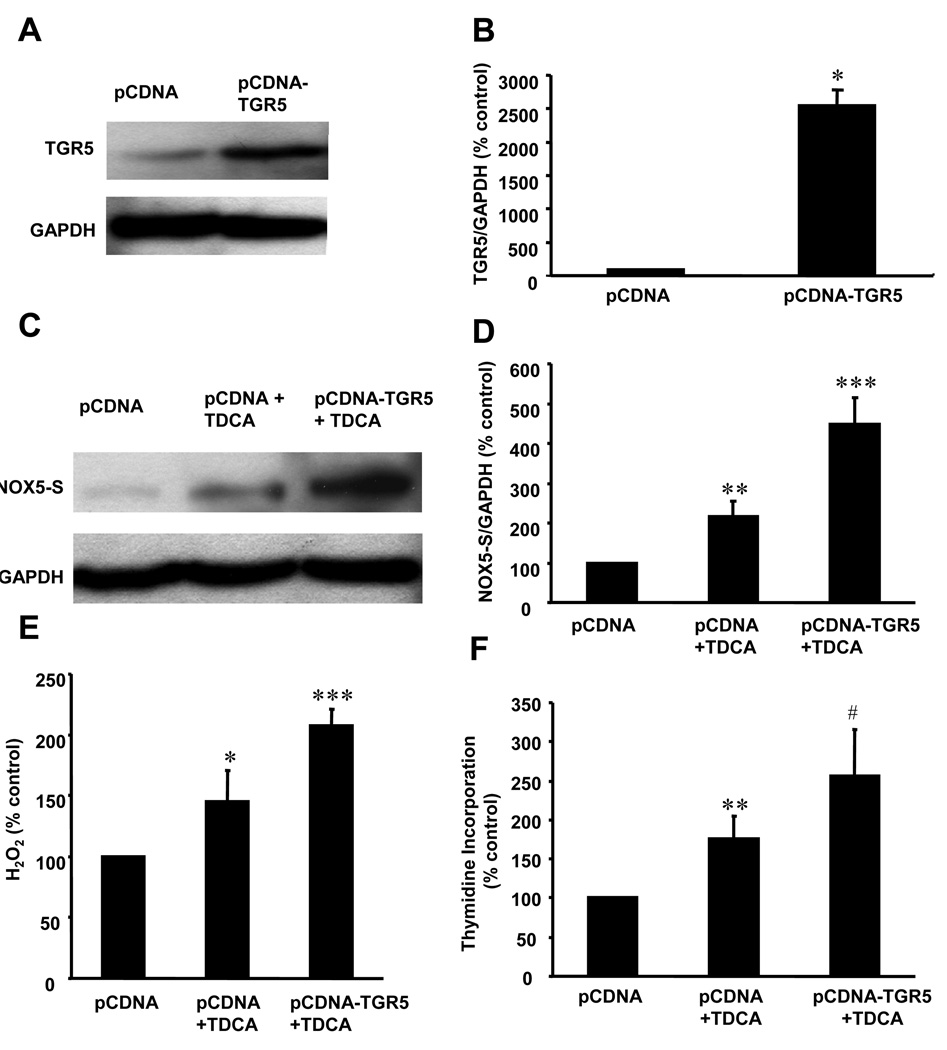
To further confirm the role of TGR5 in TDCA-induced NOX5-S expression and H2O2 production, we constructed pCDNA3.1-TGR5 plasmid and transfected this recombinant plasmid into FLO cells. Transfection of pCDNA3.1-TGR5 plasmid significantly increased TGR5 protein expression in FLO cells, when compared with pCDNA3.1 control (Fig. 7A and 7B), indicating that TGR5 receptors are successfully overexpressed in FLO cells. Overexpression of TGR5 significantly enhanced NOX5-S expression (Fig. 7C and 7D), H2O2 production (Fig. 7E) and thymidine incorporation (Fig. 7F) in response to TDCA treatment, compared with pCDNA3.1 group treated with TDCA. These data indicate that TGR5 receptor may mediate TDCA-induced increase in NOX5-S expression, H2O2 production and cell proliferation.
Figure 7. NOX5-S expression and thymidine incorporation in FLO OA cells with TGR5 overexpression.
(A) Western blot analysis and (B) summarized data showed that TGR5 protein was successfully overexpressed in FLO cells after transfection with pCDNA3.1-TGR5 (pCDNA-TGR5). (C) Western blot analysis and (D) summarized data showed that overexpression of TGR5 receptor significantly increased TDCA-induced NOX5-S expression, (E) H2O2 production and (F) thymidine incorporation. The data suggest that TDCA-induced increase in NOX5-S expression, H2O2 production and cell proliferation may depend on activation of TGR5 receptor. N=3, ANOVA, * P<0.01, ** P<0.05, compared with control plasmid pCDNA3.1 (pCDNA); *** P<0.001, #P<0.05, compared with pCDNA3.1 (pCDNA) + TDCA group.
Gαq Proteins Coupled With TGR5 Receptor In FLO Cells
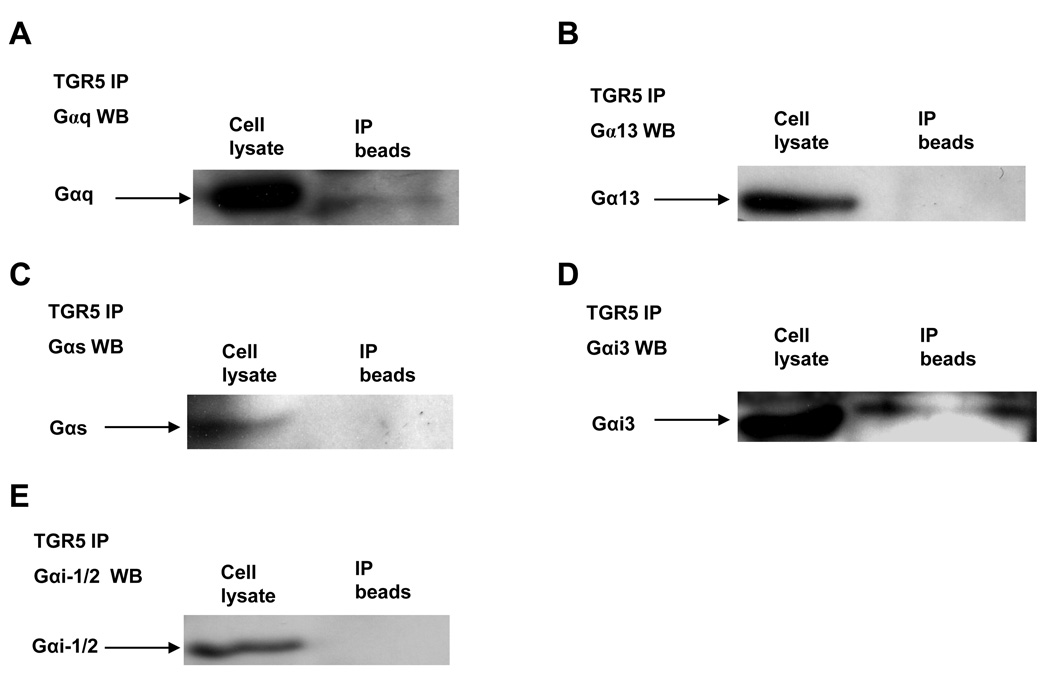
To determine which G proteins are coupled with the TGR5 receptor, we used the TGR5 antibody to immunoprecipitate TGR5 and then to detect different G protein in the immunoprecipitates by Western blot analysis. We found that Gαq and Gαi-3 proteins were co-immunoprecipitated with TGR5 from FLO cell lysate (Fig.8, A–E), indicating that TGR5 receptors are coupled with Gαq and Gαi-3 protein in FLO OA cells.
Figure 8. Immunoprecipitation of G proteins with TGR5 antibody from FLO cell lysate.
Cell extracts were immunoprecipitated with an antibody against TGR5, followed by Western blot analysis using the indicated antibodies. A typical example of Western blot analysis of three experiments (A–E) showed that Gαq and Gαi-3 protein were immunoprecipitated with TGR5 antibody from FLO cell lysate, indicating that TGR5 receptor may be coupled with Gαq and Gαi-3 protein in FLO OA cells.
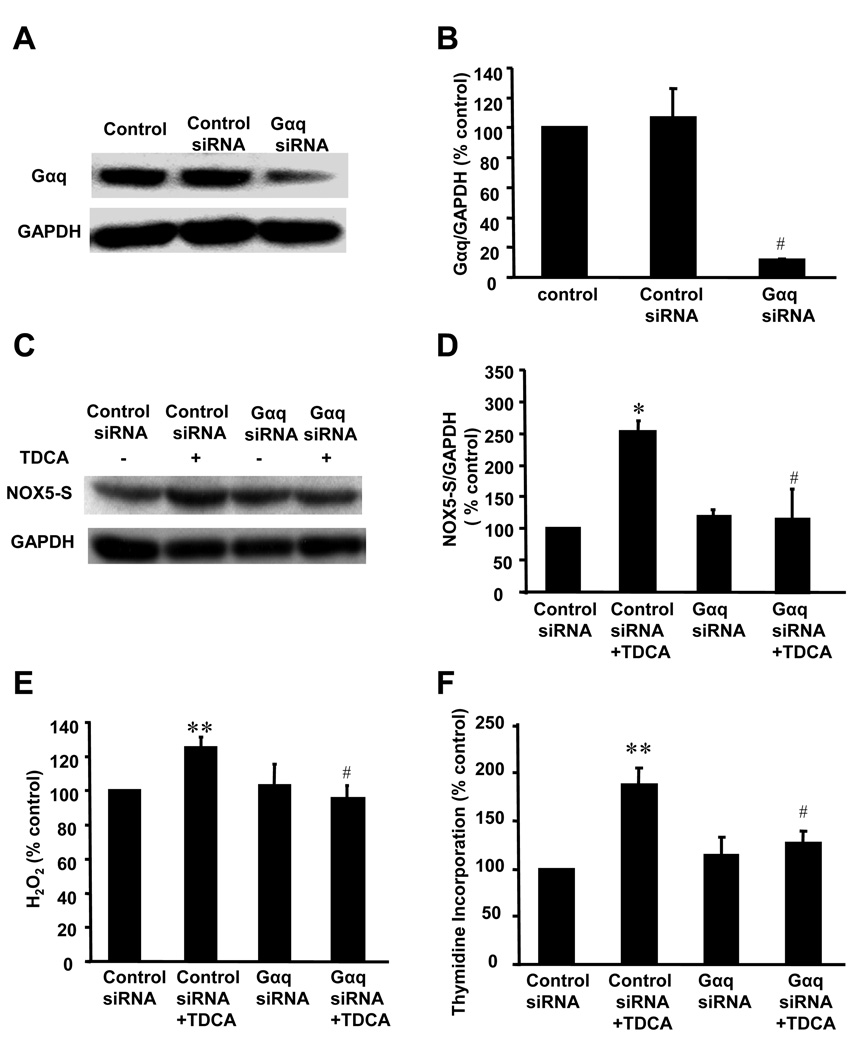
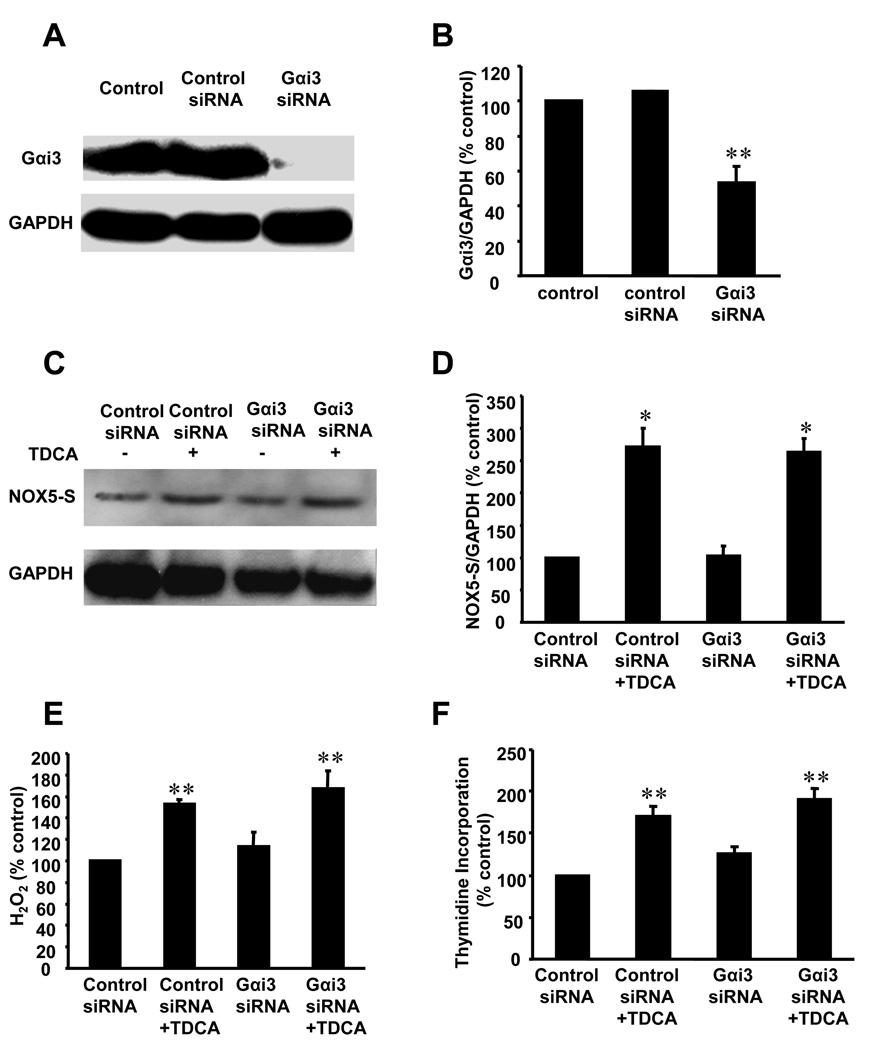
To test whether Gαq and Gαi-3 participate in TDCA-induced NOX5-S expression and H2O2 production, we used Gαq and Gαi-3 siRNA to knock down Gαq and Gαi-3 expression respectively. Gαq and Gαi-3 siRNA significantly decreased its corresponding protein expression (Fig.9, A and B) and (Fig.10, A and B) 48 h after transfection. Knockdown of Gαq protein expression with Gαq siRNA significantly decreased NOX5-S expression (Fig.9, C and D), H2O2 production (Fig. 9E) and thymidine incorporation (Fig. 9F) in response to TDCA stimulation in FLO cells. However, knockdown of Gαi-3 protein did not affect NOX5-S expression (Fig.10, C and D), H2O2 production (Fig. 10E) and thymidine incorporation (Fig. 10F) induced by TDCA treatment. The data suggest that TDCA-induced NOX5-S expression and H2O2 production may be mediated by Gαq proteins, but not Gαi-3 proteins.
Figure 9. NOX5-S expression after down-regulation of Gαq protein.
(A) Western blot analysis and (B) summarized showed that transfection with Gαq siRNA significantly decreased Gαq protein expression in FLO cells, indicating that Gαq siRNA effectively knocks down Gαq protein (n=3). (C) Western blot analysis and (D) summarized data showed that knockdown of Gαq protein significantly decreased TDCA-induced NOX5-S expression, (E) H2O2 production and (F) thymidine incorporation. The data suggest that Gαq proteins may contribute to TDCA-induced increase in NOX5-S expression, H2O2 production and cell proliferation in FLO OA cells. N=3, Differences between different groups were tested using ANOVA. * P<0.001, ** P<0.05, compared with control siRNA group; # P<0.01, compared with control siRNA+ TDCA group.
Figure 10. NOX5-S expression after down-regulation of Gαi3 protein.
(A) Western blot analysis and (B) summarized data show that transfection with Gαi-3 siRNA significantly decreased Gαi-3 protein expression in FLO OA cells, indicating that Gαi-3 siRNA effectively down-regulated Gαi-3 protein expression (n=3). (C) Western blot analysis and (D) summarized data showed that knockdown of Gαi-3 protein did not significantly affect TDCA-induced increase in NOX5-S expression, (E) H2O2 production and (F) thymidine incorporation. The data suggest that TDCA induced increase in NOX5-S expression, H2O2 production and cell proliferation may not be mediated by activation of Gαi-3 in FLO OA cells. N=3, differences among different groups were tested using ANOVA. * P<0.05, ** P<0.01, compared with control siRNA group. There was no statistically significant difference between control siRNA+ TDCA group and Gαi-3 siRNA+ TDCA group.
Discussion
ROS may play an important role in the development of OA since levels of ROS are increased in BO[31, 32] and OA.[33, 34] ROS may cause damage to DNA, RNA, lipids and proteins, which may result in increased mutation and altered functions of enzyme and proteins (e.g. activation of oncogene products and/or inhibition of tumor suppressor proteins).[33, 35] However, the sources of ROS in these conditions have not been well defined.
Low levels of ROS, seen in non-phagocytic cells, were thought to be byproducts of aerobic metabolism. More recently, however, superoxide-generating homologues of phagocytic NADPH oxidase catalytic subunit gp91phox (NOX1, NOX3-NOX5, DUOX1, DUOX2) and homologues of other subunits (p41phox or NOXO1, p51phox or NOXA1) have been found in several cell types,[29, 36, 37] suggesting that ROS generated in these cells may have distinctive cellular functions related to immunity, signal transduction and modification of the extracellular matrix. NOX5 has five isoforms: α, β, δ and γ, and NOX5-S.[29, 38] NOX5 α, β, δ and γ have EF-hand (a helix-loop-helix structural domain) motifs at its N-terminal,[29] whereas NOX5-S does not.[39]
We have shown that NOX5-S mRNA is significantly higher in Barrett’s tissues with high-grade dysplasia than without dysplasia. In the present study we found that NOX5-S is the major isoform of NADPH oxidase in FLO OA cells (Fig. 1A and 1B). We have previously shown that acid-induced H2O2 production is mediated by the NADPH oxidase NOX5-S and that acid-induced NOX5-S expression depends on an increase in intracellular calcium and activation of cyclic AMP response element binding protein (CREB). Overproduction of ROS, derived from upregulation of NOX5-S, increases cell proliferation and decreases apoptosis[4]. In the present study, we also found that TDCA significantly increased NOX5-S expression and H2O2 production in FLO and BAR-T cells (Fig. 2B–D, Fig. 3A–B). ROS production induced by 24-hour treatment with bile acids may be mediated by both activation and up-regulation of NOX5-S, whereas ROS production caused by short-term exposure to bile acids may be due to activation of NOX5-S only. The mechanisms of NOX5-S activation are not known and needs to be further explored.
Since bile acids have been implicated to contribute to the development of OA in a rat model of Barrett’s oesophagus,[13, 14, 40] we studied whether bile acids upregulate NOX5-S expression and increase cell proliferation in OA cells. Bile acids, a group of structurally diverse molecules that are primarily synthesized in the liver are the major components of bile. Besides their well-established roles in dietary lipid absorption and cholesterol homeostasis, it has recently emerged that bile acids are also signaling molecules in cell metabolism and signal transduction.[21, 41] Taurodeoxycholic acid (TDCA) has been reported to be one of the major bile acids in the refluxate of patients with Barrett’s oesophagus,[42] and is more toxic than primary bile acids, thus we used TDCA in our studies. Although reflux episodes are usually in terms of minutes or hours, particularly in long segment BO and in the supine position, per cent total time pH less than 4 ranges from 10.0 to 46.0 in BO patients,[42] i.e. oesophageal mucosa is exposed to the refluxate for 2.4–11.0 hours per day. It is possible that low concentration of bile acids is present in the mucus layer that covers the surface of metaplastic cells for a much longer time after reflux episodes. In addition, it has been reported that short-term bile acid treatment does not alter cell proliferation in BAR-T cells.[43] Therefore, 24-hour treatment with TDCA was used in our studies.
We found that low dose of TDCA significantly increased cell proliferation in FLO and BAR-T cells (Fig. 2A, 3C and 6C). This result is consistent with other reports showing bile acids increase cell proliferation in a rat intestinal epithelial line IEC6.[44, 45] The concentrations of bile acids in micromolar range are commonly found in the refluxate of BO patients,[42] but metaplastic cells may be exposed to a much lower concentrations of bile acids due to the mucus layer that covers the surface of these cells. This notion is implicated by an in vivo study showing that the interstitial pH is conserved in normal rat oesophagus when luminal pH is reduced to 1.0.[46] During the process of oesophageal tumorigenesis, cells become hyperproliferative, independently of exogenous mitogenic stimuli, resistant to growth-inhibitory signals and resistant to apoptosis.[47] Therefore, 10−11M TDCA which increases cell proliferation was used in the present study.
The mechanisms of bile acid-induced increase in cell proliferation are poorly understood. TDCA-induced cell proliferation was significantly decreased by knockdown of NOX5-S expression with NOX5-S siRNA in FLO OA and BAR-T cells (Fig, 2E; Fig. 3C), suggesting that TDCA-induced increase in cell proliferation may depend on overexpression of NOX5-S and over-production of H2O2 in FLO and BAR-T cells. This is consistent with other reports showing that blockade of NOX5 inhibits cell proliferation and increases apoptosis in the prostate cancer cell line DU145[28] and that blockade of NOX4 by transfection of NOX4 antisense oligo decreases melanoma cell proliferation.[48]
Recently, a novel G protein-coupled receptor TGR5 has been identified to mediate bile acids’ effects as a cell-surface receptor.[30] TGR5 receptor is abundantly expressed in human monocytes and macrophages, and participates in the regulation of cell metabolism.[49, 50] Primary bile acids (cholic acid, taurocholic acid and glycocholic acid) and secondary bile acids (deoxycholic acid, taurodeoxycholic acid, glycodeoxycholic acid and taurolithocholic acid) have been reported to be present in the refluxate of BO patients.[42] All these bile acids have been shown to bind to TGR5 receptors. [30] Primary bile acids are much weaker to induce cyclic AMP production via activation of TGR5 than secondary bile acids. Deoxycholic acid, taurodeoxycholic acid, and glycodeoxycholic acid have similar strength in inducing cyclic AMP production.[30] Whether TGR5 receptor is present in FLO cells is not known. We found that TGR5 receptors are present in FLO cells (Fig. 4A) and that TGR5 expression levels were significantly greater in OA tissues than normal oesophageal mucosa or Barrett’s mucosa (Fig.4, B–D), suggesting that TGR5 may play an important role in the development of OA. In addition, we found that TGR5 receptors may mediate TDCA-induced NOX5-S expression, H2O2 production and increase in cell proliferation since 1) knockdown of TGR5 expression with TGR5 siRNA remarkably decreased TDCA-induced increase in NOX5-S expression (Fig.5, C–D; Fig 6A), H2O2 production (Fig. 5E, Fig.6B) and cell proliferation (Fig. 5F, Fig.6C) in FLO OA and BAR-T cells; 2) TGR5 overexpression significantly increased NOX5-S expression, H2O2 production and cell proliferation in response to TDCA treatment in FLO cells (Fig.7, C–F).
Which G proteins are coupled to TGR5 receptor is not fully understood. In CHO cells, TGR5 receptor may be coupled to Gαs protein.[30] In FLO cells we found that Gαq and Gαi3 proteins are coupled with TGR5 receptor (Fig.8) and that Gαq proteins, but not Gαi3, may mediate TDCA-induced NOX5-S expression and H2O2 production. This data suggest that one receptor may be coupled to more than one G-proteins and that only Gαq is involved in TDCA-induced increase in NOX5-S expression and cell proliferation. This finding is consistent with our previous finding in lower oesophageal sphincter where leukotriene receptor is coupled to Gαq and Gαi3 proteins, but only Gαq protein mediates leukotriene D4-induced contraction.[51]
In conclusion, TGR5 receptor is over-expressed in OA tissues. TDCA-induced increase in cell proliferation depends on upregulation of NOX5-S expression. TDCA-induced NOX5-S expression is mediated by activation of TGR5 receptor and Gαq protein in OA cells. Our data may provide potential targets to prevent and/or treat Barrett’s oesophageal adenocarcinoma.
Summary Box.
Mechanisms of the progression from Barrett’s oesophagus to oesophageal adenocarcinoma are not fully understood. Bile acids may play an important role in this progression.
In animal models, diversion of duodenal contents into the lower oesophagus leads to oesophageal adenocarcinoma.[12–14]
Reflux of bile acids into the oesophagus not only causes short-term damage to the mucosa but also induces long-term oxidative stress and cellular DNA damage. [15, 16]
In this study a novel bile acid receptor TGR5 and a novel NADPH oxidase NOX5-S were identified in oesophageal adenocarcinoma cell line FLO.
TGR5 mRNA and protein levels were significantly higher in oesophageal adenocarcinoma tissues than in normal oesophageal mucosa or Barrett’s mucosa.
Bile acid taurodeoxycholic acid-induced increase in cell proliferation may depend on activation of the TGR5 receptor, Gαq protein and NOX5-S.
Our data may provide potential targets to prevent and/or treat Barrett’s oesophageal adenocarcinoma.
Acknowledgement
These data were presented in part at the 109th annual meeting of the American Gastroenterological Association, in San Diego CA, in May 2008.
Funding:
This work was supported by NIDDK R21 DK073327-02 and R01 DK080703-01A1.
Abbreviations
- BO
Barrett’s oesophagus
- OA
oesophageal adenocarcinoma
- TDCA
taurodeoxycholic acid
- PPI
proton pump inhibitors
- ROS
reactive oxygen species
- NOX5-S
NAPDH oxidase short form
- TGR5
G protein-coupled bile acid receptor 1
- siRNA
Small Interfering RNA
- H2O2
hydrogen peroxide
- CREB
cyclic AMP response element binding protein
- 5-RACE
rapid amplification of 5' complementary DNA ends
Footnotes
No conflicts of interest exist.
Competing interest: None
Copyright license statement
“The Corresponding Author has the right to grant on behalf of all authors and does grant on behalf of all authors, an exclusive licence (or non-exclusive for government employees) on a worldwide basis to the BMJ Publishing Group Ltd, and its Licensees to permit this article (if accepted) to be published in [INSERT NAME OF JOURNAL] and any other BMJPGL products and to exploit all subsidiary rights, as set out in our licence.”
References
- 1.Pohl H, Welch HG. The role of overdiagnosis and reclassification in the marked increase of esophageal adenocarcinoma incidence. J Natl Cancer Inst. 2005;97:142–146. doi: 10.1093/jnci/dji024. [DOI] [PubMed] [Google Scholar]
- 2.Lagergren J, Bergstrom R, Lindgren A, et al. Symptomatic gastroesophageal reflux as a risk factor for esophageal adenocarcinoma. N Engl J Med. 1999;340:825–831. doi: 10.1056/NEJM199903183401101. [DOI] [PubMed] [Google Scholar]
- 3.Gutschow CA, Schroder W, Holscher AH. Barrett's esophagus: what is the poison - alkaline, biliary or acidic reflux? Dis Esophagus. 2002;15:5–9. doi: 10.1046/j.1442-2050.2002.00218.x. [DOI] [PubMed] [Google Scholar]
- 4.Fu X, Beer DG, Behar J, et al. cAMP-response element-binding protein mediates acid-induced NADPH oxidase NOX5-S expression in Barrett esophageal adenocarcinoma cells. J Biol Chem. 2006;281:20368–20382. doi: 10.1074/jbc.M603353200. [DOI] [PubMed] [Google Scholar]
- 5.Si J, Fu X, Behar J, et al. NADPH oxidase NOX5-S mediates acid-induced cyclooxygenase-2 expression via activation of NF-kappa B in Barrett's esophageal adenocarcinoma cells. J Biol Chem. 2007 Apr 2;282:16244–16255. doi: 10.1074/jbc.M700297200. [Epub ahead of print] [DOI] [PubMed] [Google Scholar]
- 6.Souza RF, Shewmake K, Terada LS, et al. Acid exposure activates the mitogen-activated protein kinase pathways in Barrett's esophagus. Gastroenterology. 2002;122:299–307. doi: 10.1053/gast.2002.30993. [DOI] [PubMed] [Google Scholar]
- 7.Fitzgerald RC, Omary MB, Triadafilopoulos G. Dynamic effects of acid on Barrett's esophagus. An ex vivo proliferation and differentiation model. J Clin Invest. 1996;98:2120–2128. doi: 10.1172/JCI119018. [DOI] [PMC free article] [PubMed] [Google Scholar]
- 8.Ouatu-Lascar R, Fitzgerald RC, Triadafilopoulos G. Differentiation and proliferation in Barrett's esophagus and the effects of acid suppression. Gastroenterology. 1999;117:327–335. doi: 10.1053/gast.1999.0029900327. [DOI] [PubMed] [Google Scholar]
- 9.El-Serag HB, Aguirre TV, Davis S, et al. Proton pump inhibitors are associated with reduced incidence of dysplasia in Barrett's esophagus. Am J Gastroenterol. 2004;99:1877–1883. doi: 10.1111/j.1572-0241.2004.30228.x. [DOI] [PubMed] [Google Scholar]
- 10.Kauer WK, Stein HJ. Bile reflux in the constellation of gastroesophageal reflux disease. Thorac Surg Clin. 2005;15:335–340. doi: 10.1016/j.thorsurg.2005.03.004. [DOI] [PubMed] [Google Scholar]
- 11.Jankowski JA, Anderson M. Review article: management of oesophageal adenocarcinoma -- control of acid, bile and inflammation in intervention strategies for Barrett's oesophagus. Aliment Pharmacol Ther. 2004;20 Suppl 5:71–80. doi: 10.1111/j.1365-2036.2004.02143.x. discussion 95–6. [DOI] [PubMed] [Google Scholar]
- 12.Attwood SE, Smyrk TC, DeMeester TR, et al. Duodenoesophageal reflux and the development of esophageal adenocarcinoma in rats. Surgery. 1992;111:503–510. [PubMed] [Google Scholar]
- 13.Clark GW, Smyrk TC, Mirvish SS, et al. Effect of gastroduodenal juice and dietary fat on the development of Barrett's esophagus and esophageal neoplasia: an experimental rat model. Ann Surg Oncol. 1994;1:252–261. doi: 10.1007/BF02303531. [DOI] [PubMed] [Google Scholar]
- 14.Fein M, Peters JH, Chandrasoma P, et al. Duodenoesophageal reflux induces esophageal adenocarcinoma without exogenous carcinogen. J Gastrointest Surg. 1998;2:260–268. doi: 10.1016/s1091-255x(98)80021-8. [DOI] [PubMed] [Google Scholar]
- 15.Bernstein H, Bernstein C, Payne CM, et al. Bile acids as carcinogens in human gastrointestinal cancers. Mutat Res. 2005;589:47–65. doi: 10.1016/j.mrrev.2004.08.001. [DOI] [PubMed] [Google Scholar]
- 16.Todd JA, de Caestecker J, Jankowski J. Gastro-esophageal reflux disease and bile acids. J Pediatr Gastroenterol Nutr. 2003;36:172–174. doi: 10.1097/00005176-200302000-00004. [DOI] [PubMed] [Google Scholar]
- 17.Buskens CJ, Van Rees BP, Sivula A, et al. Prognostic significance of elevated cyclooxygenase 2 expression in patients with adenocarcinoma of the esophagus. Gastroenterology. 2002;122:1800–1807. doi: 10.1053/gast.2002.33580. [DOI] [PubMed] [Google Scholar]
- 18.Tselepis C, Morris CD, Wakelin D, et al. Upregulation of the oncogene c-myc in Barrett's adenocarcinoma: induction of c-myc by acidified bile acid in vitro. Gut. 2003;52:174–180. doi: 10.1136/gut.52.2.174. [DOI] [PMC free article] [PubMed] [Google Scholar]
- 19.Looby E, Abdel-Latif MM, Athie-Morales V, et al. Deoxycholate induces COX-2 expression via Erk1/2-, p38-MAPK and AP-1-dependent mechanisms in esophageal cancer cells. BMC Cancer. 2009;9:190. doi: 10.1186/1471-2407-9-190. [DOI] [PMC free article] [PubMed] [Google Scholar]
- 20.Wu J, Gong J, Geng J, et al. Deoxycholic acid induces the overexpression of intestinal mucin, MUC2, via NF-kB signaling pathway in human esophageal adenocarcinoma cells. BMC Cancer. 2008;8:333. doi: 10.1186/1471-2407-8-333. [DOI] [PMC free article] [PubMed] [Google Scholar]
- 21.Houten SM, Watanabe M, Auwerx J. Endocrine functions of bile acids. Embo J. 2006;25:1419–1425. doi: 10.1038/sj.emboj.7601049. [DOI] [PMC free article] [PubMed] [Google Scholar]
- 22.Katsuma S, Hirasawa A, Tsujimoto G. Bile acids promote glucagon-like peptide-1 secretion through TGR5 in a murine enteroendocrine cell line STC-1. Biochem Biophys Res Commun. 2005;329:386–390. doi: 10.1016/j.bbrc.2005.01.139. [DOI] [PubMed] [Google Scholar]
- 23.Watanabe M, Houten SM, Mataki C, et al. Bile acids induce energy expenditure by promoting intracellular thyroid hormone activation. Nature. 2006;439:484–489. doi: 10.1038/nature04330. [DOI] [PubMed] [Google Scholar]
- 24.Jenkins GJ, D'Souza FR, Suzen SH, et al. Deoxycholic acid at neutral and acid pH, is genotoxic to oesophageal cells through the induction of ROS: The potential role of anti-oxidants in Barrett's oesophagus. Carcinogenesis. 2007;28:136–142. doi: 10.1093/carcin/bgl147. [DOI] [PubMed] [Google Scholar]
- 25.Hughes SJ, Nambu Y, Soldes OS, et al. Fas/APO-1 (CD95) is not translocated to the cell membrane in esophageal adenocarcinoma. Cancer Res. 1997;57:5571–5578. [PubMed] [Google Scholar]
- 26.Jaiswal KR, Morales CP, Feagins LA, et al. Characterization of telomerase-immortalized, non-neoplastic, human Barrett's cell line (BAR-T) Dis Esophagus. 2007;20:256–264. doi: 10.1111/j.1442-2050.2007.00683.x. [DOI] [PubMed] [Google Scholar]
- 27.Cao W, Sohn UD, Bitar KN, et al. MAPK mediates PKC-dependent contraction of cat esophageal and lower esophageal sphincter circular smooth muscle. Am J Physiol Gastrointest Liver Physiol. 2003;285:G86–G95. doi: 10.1152/ajpgi.00156.2002. [DOI] [PubMed] [Google Scholar]
- 28.Brar SS, Corbin Z, Kennedy TP, et al. NOX5 NAD(P)H oxidase regulates growth and apoptosis in DU 145 prostate cancer cells. Am J Physiol Cell Physiol. 2003;285:C353–C369. doi: 10.1152/ajpcell.00525.2002. [DOI] [PubMed] [Google Scholar]
- 29.Banfi B, Maturana A, Jaconi S, et al. A mammalian H+ channel generated through alternative splicing of the NADPH oxidase homolog NOH-1. Science. 2000;287:138–142. doi: 10.1126/science.287.5450.138. [DOI] [PubMed] [Google Scholar]
- 30.Kawamata Y, Fujii R, Hosoya M, et al. A G protein-coupled receptor responsive to bile acids. J Biol Chem. 2003;278:9435–9440. doi: 10.1074/jbc.M209706200. [DOI] [PubMed] [Google Scholar]
- 31.Olyaee M, Sontag S, Salman W, et al. Mucosal reactive oxygen species production in oesophagitis and Barrett's oesophagus. Gut. 1995;37:168–173. doi: 10.1136/gut.37.2.168. [DOI] [PMC free article] [PubMed] [Google Scholar]
- 32.Wetscher GJ, Hinder RA, Klingler P, et al. Reflux esophagitis in humans is a free radical event. Dis Esophagus. 1997;10:29–32. doi: 10.1093/dote/10.1.29. discussion 3. [DOI] [PubMed] [Google Scholar]
- 33.Farhadi A, Fields J, Banan A, et al. Reactive oxygen species: are they involved in the pathogenesis of GERD, Barrett's esophagus, and the latter's progression toward esophageal cancer? Am J Gastroenterol. 2002;97:22–26. doi: 10.1111/j.1572-0241.2002.05444.x. [DOI] [PubMed] [Google Scholar]
- 34.Sihvo EI, Ruohtula T, Auvinen MI, et al. Simultaneous progression of oxidative stress and angiogenesis in malignant transformation of Barrett esophagus. J Thorac Cardiovasc Surg. 2003;126:1952–1957. doi: 10.1016/j.jtcvs.2003.08.014. [DOI] [PubMed] [Google Scholar]
- 35.Ohshima H, Tatemichi M, Sawa T. Chemical basis of inflammation-induced carcinogenesis. Arch Biochem Biophys. 2003;417:3–11. doi: 10.1016/s0003-9861(03)00283-2. [DOI] [PubMed] [Google Scholar]
- 36.Lambeth JD. NOX enzymes and the biology of reactive oxygen. Nat Rev Immunol. 2004;4:181–189. doi: 10.1038/nri1312. [DOI] [PubMed] [Google Scholar]
- 37.Suh YA, Arnold RS, Lassegue B, et al. Cell transformation by the superoxide-generating oxidase Mox1. Nature. 1999;401:79–82. doi: 10.1038/43459. [DOI] [PubMed] [Google Scholar]
- 38.Vignais PV. The superoxide-generating NADPH oxidase: structural aspects and activation mechanism. Cell Mol Life Sci. 2002;59:1428–1459. doi: 10.1007/s00018-002-8520-9. [DOI] [PMC free article] [PubMed] [Google Scholar]
- 39.Cheng G, Cao Z, Xu X, et al. Homologs of gp91phox: cloning and tissue expression of Nox3, Nox4, and Nox5. Gene. 2001;269:131–140. doi: 10.1016/s0378-1119(01)00449-8. [DOI] [PubMed] [Google Scholar]
- 40.Ireland AP, Peters JH, Smyrk TC, et al. Gastric juice protects against the development of esophageal adenocarcinoma in the rat. Ann Surg. 1996;224:358–370. doi: 10.1097/00000658-199609000-00012. discussion 70–1. [DOI] [PMC free article] [PubMed] [Google Scholar]
- 41.Fitzgerald RC. Barrett's oesophagus and oesophageal adenocarcinoma: how does acid interfere with cell proliferation and differentiation? Gut. 2005;54 Suppl 1:i21–i26. doi: 10.1136/gut.2004.041558. [DOI] [PMC free article] [PubMed] [Google Scholar]
- 42.Nehra D, Howell P, Williams CP, et al. Toxic bile acids in gastro-oesophageal reflux disease: influence of gastric acidity. Gut. 1999;44:598–602. doi: 10.1136/gut.44.5.598. [DOI] [PMC free article] [PubMed] [Google Scholar]
- 43.Bajpai M, Liu J, Geng X, et al. Repeated exposure to acid and bile selectively induces colonic phenotype expression in a heterogeneous Barrett's epithelial cell line. Lab Invest. 2008;88:643–651. doi: 10.1038/labinvest.2008.34. [DOI] [PubMed] [Google Scholar]
- 44.Toledo A, Yamaguchi J, Wang JY, et al. Taurodeoxycholate stimulates intestinal cell proliferation and protects against apoptotic cell death through activation of NF-kappaB. Dig Dis Sci. 2004;49:1664–1671. doi: 10.1023/b:ddas.0000043383.96077.99. [DOI] [PubMed] [Google Scholar]
- 45.Yamaguchi J, Toledo A, Bass BL, et al. Taurodeoxycholate increases intestinal epithelial cell proliferation through c-myc expression. Surgery. 2004;135:215–221. doi: 10.1016/j.surg.2003.08.025. [DOI] [PubMed] [Google Scholar]
- 46.Tanaka S, Chu S, Hirokawa M, et al. Direct measurement of acid permeation into rat oesophagus. Gut. 2003;52:775–783. doi: 10.1136/gut.52.6.775. [DOI] [PMC free article] [PubMed] [Google Scholar]
- 47.Souza RF, Morales CP, Spechler SJ. Review article: a conceptual approach to understanding the molecular mechanisms of cancer development in Barrett's oesophagus. Aliment Pharmacol Ther. 2001;15:1087–1100. doi: 10.1046/j.1365-2036.2001.01046.x. [DOI] [PubMed] [Google Scholar]
- 48.Brar SS, Kennedy TP, Sturrock AB, et al. An NAD(P)H oxidase regulates growth and transcription in melanoma cells. Am J Physiol Cell Physiol. 2002;282:C1212–C1224. doi: 10.1152/ajpcell.00496.2001. [DOI] [PubMed] [Google Scholar]
- 49.Keitel V, Donner M, Winandy S, et al. Expression and function of the bile acid receptor TGR5 in Kupffer cells. Biochem Biophys Res Commun. 2008;372:78–84. doi: 10.1016/j.bbrc.2008.04.171. [DOI] [PubMed] [Google Scholar]
- 50.Yang JI, Yoon JH, Myung SJ, et al. Bile acid-induced TGR5-dependent c-Jun-N terminal kinase activation leads to enhanced caspase 8 activation in hepatocytes. Biochem Biophys Res Commun. 2007;361:156–161. doi: 10.1016/j.bbrc.2007.07.001. [DOI] [PubMed] [Google Scholar]
- 51.Kim N, Cao W, Song IS, et al. Leukotriene D4-induced contraction of cat esophageal and lower esophageal sphincter circular smooth muscle. Gastroenterology. 1998;115:919–928. doi: 10.1016/s0016-5085(98)70264-1. [DOI] [PubMed] [Google Scholar]


