

Abstract
Given the very substantial heterogeneity of most human cancers, it is likely that most cancer therapeutics will be active in only a small fraction of any population of patients. As such, the development of new therapeutics, coupled with methods to match a therapy with the individual patient, will be critical to achieving significant gains in disease outcome. One such opportunity is the use of expression signatures to identify key oncogenic phenotypes that can serve not only as biomarkers but also as a means of identifying therapeutic compounds that might specifically target these phenotypes. Given the potential importance of targeting tumors exhibiting a stem-like phenotype, we have developed an expression signature that reflects common biological aspects of various stem-like characteristics. The Consensus Stemness Ranking (CSR) signature is upregulated in cancer stem cell enriched samples, at advanced tumor stages and is associated with poor prognosis in multiple cancer types. Using two independent computational approaches we utilized the CSR signature to identify clinically useful compounds that could target the CSR phenotype. In vitro assays confirmed selectivity of several predicted compounds including topoisomerase inhibitors and resveratrol towards breast cancer cell lines that exhibit a high-CSR phenotype. Importantly, the CSR signature could predict clinical response of breast cancer patients to a neoadjuvant regimen that included a CSR-specific agent. Collectively, these results suggest therapeutic opportunities to target the CSR phenotype in a relevant cohort of cancer patients.
Keywords: personalized medicine, expression signatures, stem-like phenotype, biomarkers
Introduction
A common characteristic of many cancers is heterogeneity–diseases described as ‘breast cancer’ or ‘lung cancer’ or ‘brain cancer’ are actually collections of diseases with distinct molecular mechanisms and clinical characteristics. The advent of technology to measure gene expression on a genome-wide scale has transformed cancer biology by providing the tools to measure these subtle distinctions. A particularly powerful aspect of the use of expression data has been the development of signatures representing a well defined in vitro or in vivo phenotype such as the potential for metastasis or response to therapy(1).
The high self renewal capacity and phenotypic plasticity of tumor cells are reminiscent of the traits displayed by normal stem cells. These parallels inspired numerous studies aimed at understanding of stem-like phenotypes in cancer. Several recent studies have utilized gene expression profiling and developed stem cell signatures in order to assess the relationships of such stem-like phenotypes with clinical characteristics. These independent studies reproducibly demonstrated the association of stem cell signatures with poor prognosis in multiple cancer types (2–4).
Since different published stem cell signatures were derived from different biological contexts such as embryonic stem cells (2, 4)and isolated breast cancer stem cells (3)it is presently unclear whether these signatures measure overlapping or distinct aspects of tumor stem-like character. Most importantly, despite obvious prognostic value it remains unclear, how the knowledge that a particular tumor exhibits ES-like character would affect therapy selection for an individual patient.
Here we develop an expression signature that reflects common biological aspects of four stemness-ranking methods. This consensus signature shows prognostic power in several cancer types providing a rational for its therapeutic targeting. Application of several signature-based techniques resulted in identification of several drugs that potentially target the stem-like phenotype. Our computational predictions are then validated experimentally. Taken together, this study not only confirms the importance of the reactivation of stem-like phenotype during cancer progression but suggest novel therapeutic opportunities to target this phenotype in a relevant cohort of cancer patients.
Materials and methods
Microarray analysis
For microarray analysis of breast cancer cell lines and of separated CD133+ and CD133-glioblastoma cells RNA was prepared using RNeasy kit (Qiagen, Valencia, CA). RNA integrity was ensured using Agilent Lab-on-a-Chip RNA Bioanalizer. RNA samples were amplified using Ambion Message-Amp Premier kit and analyzed on Affymetrix U133A 2.0 microarrays. Microarray data were deposited in Gene Expression Omnibus under accession number GSE24717.
Bayesian binary regression to predict phenotypes using expression signatures
Statistical methods followed those previously described (5)using Bayesian binary regression algorithm BinReg ver2.0(http://www.duke.edu/~dinbarry/BINREG).
The iPS signature was developed using microarray data from induced pluripotency experiment (6). Mas5-normalized and log transformed data from GSE9832 was filtered to U133A probes and used for training. One sample labeled as fibroblasts (GSM248213) was removed from the training set as it was clustered with stem cells in unsupervised hierarchical clustering. iPS signature was developed using the following binary regression parameters: 100 genes, 2 metagenes, 1000 burn-in, 5000 iterations, 1 skip. The iPS training set is provided at https://discovery.genome.duke.edu/express/resources/2499/iPS_signature_training_set.xls and the list of probes constituting the iPS signature is shown in Supplementary Table 2.
The CSR signature was developed using the CSR tumor set (see section “Defining the CSR tumor set”) using the following binary regression parameters: 100 genes, 2 metagenes, 1000 burn-in, 5000 iterations, 1 skip. The CSR training set is provided at https://discovery.genome.duke.edu/express/resources/2499/CSR_training.xls and the list of probes constituting the CSR signature is shown in Supplementary Table 3. Multiple independent analyses with varying seed starting points and 5000–100000 iterations demonstrated convergence of the model onto almost identical posterior (average Pearson correlation of 0.996). Microarray datasets used in this study are described in Supplementary Table 1. For all CSR signature predictions besides the analysis of lung cancer dataset (7)RMA (Robust Multichip Average)-normalization was used. For the analysis of lung cancer dataset (7)Mas5-normalized log transformed version of the CSR training set was used. Test data were merged with the signature training data using Affymetrix probe IDs. All analyses were preceded by quantile and shift-scale normalizations built into the BinReg program.
Defining the CSR tumor set
Compilation of BC1143 breast tumors dataset derived from 10 independent studies and normalized using Bayesian Factor Regression Modeling is described in (5). The stem-like characteristics of tumors in this dataset were assessed using four different stemness signatures as described below. Core ESC (Embryonic Stem Cell)- like signature which consists of 335 genes commonly expressed in mouse and human ES cells (4)was extracted by gene symbol (multiple probes for one gene allowed) and tumor samples ranked by average signature expression. ES exp1 signature (ES exp1) which consists of 380 genes over-expressed in human ES (2)was extracted by gene symbol (multiple probes for one gene allowed) and tumor samples ranked by average signature expression.
IGS (invasiveness gene signature ) (3)
Breast CSC raw data was downloaded from GEO (GSE6883), RMA normalized and merged with the breast tumors BC1143 compendium. Expression of IGS signature was extracted by Affymetrix ID. Data was mean gene centered and Pearson correlation coefficient was calculated between average IGS signature expression in six tumorigenic (CD44+CD24−/lowlin−)samples and in each breast cancer sample in the compendium. Tumor samples were ranked by correlation coefficient.
iPS signature
iPS signature was developed using microarray data from induced pluripotency experiment where human fibroblasts were reprogrammed to pluripotency by ectopic expression of four transcription factors (Oct4, Sox2, Klf4 and Myc) yielding induced pluripotent stem (iPS) cells (6). The binary regression methodology and parameters used are described in the section “Prediction of phenotypes using expression signatures.”Tumor samples were ranked by probability being ES-like.
Defining the CSR tumor set
A tumor was considered “high CSR” if it was ranked 1–250 and “low CSR” if it was ranked 893–1143by all four ranking methods. This resulted in a selection of 21 samples with high and 14 samples with low stem-like characteristics.
Computational screen of NCI-60 for potential drugs targeting the CSR phenotype
The methodology used for the NCI-60 was essentially as previously described (8). We calculated Pearson correlation between CSR signature predictions and log GI50 across the NCI-60 cell line panel and then permuted the cell line labels 1,000,000 times and re-calculated the correlations using the permuted scores. The p-value is the proportion of times in which the correlations from the permuted data was more extreme than from the actual data in a two-tailed test. To control for multiple hypothesis tests, we calculated the false discovery rate (9).
Cell culture, drug treatments and flow cytometry
Breast cancer cell lines were obtained from the American Type Culture Collection in 2004 and cell line identity was periodically monitored by morphology. Breast cancer culture conditions were as described in (10). Glioma xenografts, cell culture and separation of CD133+ and CD133-populations were as described in (11)with or without5 μg/ml laminin (Sigma-Aldrich). Daunorubicin, etoposide, docetaxel and resveratrol were from Sigma (St Louis, MO). Topotecan HCL was from Alexis Biochemicals (San Diego, CA).
For drug sensitivity assays cells were plated in 96 well plates from Corning(Cambridge, MA) at 1000–6000 cell per well. After 24 hours medium was replaced with drug-containing medium. After 72 hours medium was replaced for fresh growth medium containing 20% CellTiter 96R AQueous One Solution Cell Proliferation Assay (MTS) from Promega (Madison, USA)and absorption was read two hours later.
For assessment of growth inhibitory effect cells were treated with 100 nM topotecan, 20 μM etoposide or 200 nM daunorubicin and results are presented as a percentage of vehicle control. For assessment of cytotoxic effect cells were treated with 3 μM topotecan, 100 μM etoposide, 1.6 μM daunorubicin, 200 μM resveratrol or 1μM docetaxel and results are presented as a percentage of reading taken from a parallel plate at the time of drug application (% of day 0). For flow cytometry of CD44, CD24 and ESA (EpCAM) the following antibodies from BD Biosciences (San Jose, CA) were used: anti-EpCAM-FITC(347197), anti CD24-PE (555428), anti-CD44-APC (559942).
Statistical analysis
Standard Kaplan Meier mortality curves and their significance levels were generated using GraphPad software. The survival curves were compared using the logrank test. For estimation of statistical significance of differences between two classes of samples a Mann- Whitney U-test was employed using GraphPad software.
Results
Development of a Consensus Stemness Ranking (CSR) gene expression signature
A series of recent studies have used gene expression analysis to focus on stem cell characteristics in human tumors. In one example, an expression module consisting of 335 genes shared between independently derived mouse and human ES signatures was defined as core ES module (4).In a second example, an ES gene signature (ES exp1) was identified which was comprised of 380 genes found to be upregulated in human ES cells by multiple profiling studies(2). A third example made use of 186 genes that were differentially expressed between tumorigenic CD44+CD24−/low lin− cells and normal breast epithelium(IGS)(3). Finally, recent studies show that it is possible to reprogram differentiated cells to pluripotency by ectopic expression of four transcription factors (Oct4, Sox2, Klf4 and Myc) yielding induced pluripotent stem (iPS) cells. Human iPS cells resemble embryonic stem cells in morphology and gene expression and in the capacity to form teratomas in immune-deficient mice(6). We used publicly available expression data from a study in which normal human fibroblasts were reprogrammed to pluripotency (6)to develop an iPS signature consisting of 100 probes corresponding to 86 unique genes (Supplementary Table 2, see Materials and Methods for details).
Given the diverse nature of these expression profiling approaches, we first investigated the concordance between their estimates of tumor stem-like character in a large collection of breast cancer tumors(7). An evaluation of each of the signatures across a dataset of 1,143 breast tumor samples revealed substantial variation. Whereas the patterns for the ES1 signature of Ben-Porath et al and core ES-like module of Wong et al. were similar, the patterns obtained with the iPS signature and the IGS signature were quite different (Fig. 1A). This result emphasizes the diversity of characteristics associated with previously defined stemness measures and provides the impetus to develop a “consensus stemness signature” that has the potential to capture this diversity.
Figure 1. Development of CSR signature.

A. 1143 breast cancer samples were ranked using microarray expression data to measure the degree to which a tumor sample exhibits stem-like characteristics using four independent methods: “core ES”(4), “ES exp1” (2), “iPS”(6), and “IGS”-(3).See text for details. Low rankings (high stemness) shown in blue and high rankings (low stemness) shown in red. Samples that were ranked high (or low) by the consensus of all four ranking methods (boxed) represent the CSR training set.
B. Image intensity display of the expression levels of genes comprising the CSR signature. Expression levels are standardized to zero mean and unit variance across samples, displayed with genes as rows and samples as columns, and color coded to indicate high (red) or low (blue) expression levels.
C. CSR signature predictions in separated CD133+ and CD133-fractions from two human glioblastoma xenograft tumors. Separated cells were grown with or without laminin (Lam).
D. Percentage of CD44+/CD24− /ESA+cells in 14 breast cancer cell lines was determined by flow cytometry. Each dot represents mean of at least three independent experiments. Cell lines are grouped as a function of CSR signature predictions following microarray expression profiling of unseparated cultures. Mann-Whitney test was used to calculate the p-value for the significance of difference between high-and low-CSR groups using values from all individual experiments.
To this end, we chose to focus on breast tumors displaying high or low stemness characteristics as assessed by all four distinct stemness-based signatures. In particular, we identified those breast tumors which ranked in the top or bottom quintiles by the consensus of the four methods. This resulted in a selection of 21 samples with high and 14 samples with low stem-like characteristics(boxed in Fig. 1A). To reflect the way this set of breast tumors was defined, we refer to it as Consensus Stemness Ranking (CSR) set.
Next, we made use of the CSR set of tumor samples to train a Bayesian binary regression probabilistic model that could quantitatively assess the CSR phenotype (10, 12). We refer to this model as the CSR signature. Fig. 1B depicts a heat map of the resulting signature that consisted of 93probes upregulated and 7probes downregulated in high CSR samples (Suppl Table 3). A leave-one-out cross-validation demonstrated a robust performance of this predictor to distinguish samples with low and high CSR phenotype (Suppl Fig. 1).
Numerous studies have shown that the CD133+ subpopulation of glioblastoma tumors is enriched for cancer stem cells (13). As one test of the capacity of the CSR signature to detect stem-like characteristics, we separated CD133+ and CD133-cells from two glioblastoma xenograft tumors. Both CD133+ and CD133-glioma cells were cultured in serum-free media for 48 hours in the presence of absence of laminin, which led to adherent growth of glioma stem cells while preserve stemness (14).Microarray profiling demonstrated that the CSR signature was high in the CD133+ fractions and low in the CD133-fractions irrespective of growth conditions(Fig.1C).
A further example is seen in breast cancer where CD44+/CD24-/ESA+ subpopulations of established breast cancer cell lines have been shown to be highly enriched for tumorigenicity. Importantly, a clear correlation between the percentage of CD44+/CD24−/ESA+ cells in a cell line and the tumorigenic and aggressive phenotype of the line in vivo was demonstrated (15). We measured the percentage of CD44+/CD24−/ESA+ subpopulation in fourteen breast cancer cell lines by flow cytometry. In parallel, gene expression of unseparated cultures was measured by microarrayanalys is and the CSR phenotype was assessed using the CSR signature. Fig.1D and (Suppl Table 4) show that the percentage of CD44+/CD24−/ESA+ subpopulation was significantly higher in CSR-high cell lines. Taken together, these results suggest that the CSR signature is able to measure stemness-related phenotype.
High-CSR phenotype is associated with late stage tumors and predicts poor prognosis
To evaluate the extent to which the CSR signature could identify tumors with clinically-significant phenotypes, we made use of several published datasets with associated clinical information. Assessment of the CSR signature in an Estrogen Receptor (ER)-positive breast cancer dataset demonstrated that on average the CSR signature is low in grade 1 tumors, intermediate in grade 2 and almost always high in grade 3 tumors (Suppl Fig. 2A). Importantly, within each of the lower grades, the CSR signature has a wide range of values implying a large degree of heterogeneity with regard to CSR phenotype.
As expected from a stemness-related signature, the CSR phenotype strongly correlated with the degree of differentiation in lung adenocarcinoma. Well differentiated tumors generally exhibited a low CSR phenotype while poorly differentiated tumors generally displayed a high CSR phenotype (Suppl Fig. 2B). CSR is almost uniformly high in breast metastases as compared to primary breast tumors(Suppl Fig. 2C). The progressive upregulation of CSR with the disease stage is not limited to breast and lung cancer as average CSR is very low in benign nevi, intermediate in primary melanoma and high in melanoma metastases(Suppl Fig. 2D).
We next analyzed the prognostic value of the CSR signature in breast cancer. We found that the high CSR group had significantly worse survival in a dataset of 256 ER-positive tumors(16) (Fig.2A). Similarly, high predicted CSR was associated with a significantly worse prognosis (p<0.0001, HR=2.14)in the BC1143 dataset which represents the heterogeneity of breast cancer molecular subtypes (Suppl Fig 3A)(5). Analogous results were obtained when only ER-positive tumors from the BC1143 dataset were analyzed (Suppl Fig 3B).
Figure 2. High-CSR phenotype associates with poor survival in diverse cancer types.

CSR phenotype was determined using binary regression with the CSR signature. Samples were divided into two cohorts using CSR probability of P=0.5 as a cutoff. Survival curve of patients, tumors of which displayed high CSR probability (P>0.5) is shown in red and survival curve of patients, tumors of which displayed low CSR probability (P<0.5) is shown in green.
A. Survival analysis (censored at 10 years)in a dataset of 256 patients with estrogen receptor positive breast tumors (16).
B. Survival analysis (censored at 10 years) of 60patients with grade 1 estrogen receptor positive breast tumors (16).
C. Survival analysis of 274 lung adenocarcinoma patients (censored at 60 months) (7).
D. Survival analysis of 47 medulloblastoma patients (censored at 6years)(17).
Since low grade ER-positive breast cancer represents a particularly challenging clinical decision with regard to the necessity of neoadjuvant chemotherapy treatment, we separately analyzed the prognostic power of the CSR signature in grade 1 and grade 2tumors. Fig. 2B and (Suppl Fig. 3C) demonstrate that the CSR signature identified a poor prognosis cohort within this generally low risk population, suggesting its potential use to help treatment decisions in early stage breast cancer.
Next we explored the potential prognostic use of the CSR signature in lung cancer. In an analysis of a compendium of four studies comprising 274 lung adenocarcinoma samples, those that displayed high CSR had a significantly worse 5 year survival (Fig.2C) (7). Importantly, the CSR signature enabled classification of tumors with moderate differentiation into high-and low-CSR subgroups. Survival analysis of this patient cohort demonstrated that tumors displaying high-CSR phenotype associated with significantly worse prognosis (Suppl Fig. 3D).
Lastly, we evaluated the prognostic value of the CSR signature in human medulloblastoma patients(17). As evident from Fig.2D, patients tumors of which displayed high CSR had dramatically worse prognosis. Taken together, these data demonstrate a strong prognostic value of the CSR signature across multiple cancer types and subcategories of disease independent of ER status, stage or degree of differentiation.
Computational prediction of drugs targeting the CSR phenotype
Given the apparent extreme diversity of disease states, a major challenge in the successful treatment of cancer patients is the capacity to match the most effective therapeutic regimen with the characteristics of the individual patient’s tumor. Furthermore, the fact that any given drug is likely to be effective in only a small fraction of any cancer population, requires a substantial increase in the number of available active drugs in order to effectively manage the disease. One of the powerful aspects of the expression signature concept is a capacity to link otherwise distinct biological contexts based on the common denominator of gene expression. In this case, we have used the CSR signature, which clearly identifies a subpopulation of cancer patients with poor prognosis, to explore the potential of identifying therapeutic compounds that might target these CSR-high tumors.
As a starting point we used the Connectivity Map, a publicly available resource that enables prediction of candidate drugs that might either repress or upregulate an expression signature. This resource is based on a reference collection of gene-expression profiles from cultured human cells treated with bioactive small molecules, together with pattern-matching software to mine these data (18). Querying the Connectivity Map with the CSR signature resulted in the identification of 50 compounds predicted to repress the CSR signature (Table 1 and Suppl Table 5). The list included several compounds that are either approved or undergoing clinical trials in different cancer types. Interestingly, a natural compound from red wine, resveratrol, scored the highest rank. Several drug classes had multiple representatives on the list including four topoisomerase inhibitors (etoposide, daunorubicin, ellipticine, irinotecan), multiple histone deacetylase inhibitors (trichostatin A, vorinostat, MS-275), PI3K inhibitors (quinostatin,LY-294002) and cyclin-dependent kinases (CDKs) inhibitors (alsterpaullone, GW-8510).
Table 1. Potential drugs targeting the CSR phenotype.
Connectivity Map was queried with the CSR signature. Compounds potentially repressing the CSR signature with a significance of p<0.05are shown. Full output of this analysis is present in Suppl Table 5.
For the NCI-60 computational screen the GI-50 values of 22630 compounds (Suppl Table S6) were correlated with the predictions of the CSR signature across 59 cell lines. This analysis identified 457 compounds (462 experiments) at false-discovery rate of less than 0.3 (Suppl Table S7). Only compounds with recognizable drug names are shown here.
| Connectivity Map | NCI-60 Analysis |
|---|---|
| resveratrol | (Acetato)(2,3,5,6-tetramethylphenyl)mercury |
| MS-275 | .beta.-D-Arabinofuranosyl-5-fluorocytosine |
| ciclopirox | .beta.-D-Ribofuranoside, thymine-1 2-deoxy- |
| quinostatin | .beta.-Pyrazomycin |
| alsterpaullone | 9-N(N'-bis-chloroethyl-N'-1,2-diamino ethyl) 2-methoxy acridine dihydrochloride |
| azacitidine | 9-N-(N'-chloroethyl-N'-1,6-diaminohexyl) 2-methoxyacridine, dihydrochloride |
| bepridil | 9-N(N'-chloroethyl-N'-methyl-1,4-diaminobutyl) 2-methoxy acridine dihydrochloride |
| fluspirilene | Aclarlubicin HCl |
| cortisone | Acridine Orange |
| etoposide | Albacarcin M |
| loperamide | Albacarcin V |
| ikarugamycin | Anhydro-arabinosyl-5-fluoro-cytosine hydrochloride |
| pyrvinium | Arabinosyl cytosine palmitate |
| irinotecan | Combretastatin A4 |
| phenoxybenzamine | Ellipticine |
| solanine | Ellipticine N-oxide |
| nicergoline | Ellipticine, 6-(3-aminopropyl)-, dihydrochloride |
| monobenzone | Ellipticine, 6-3-aminopropyl)-9-methoxy-, dihydrochloride |
| ellipticine | Ellipticine, 9-chloro- |
| norcyclobenzaprine | ELLIPTICINE, 9-DIMETHYL AMINO-ETHOXY- |
| tobramycin | Ellipticine, 9-hydroxy-, hydrochloride |
| gossypol | Ellipticine, 9-methyl- |
| ethambutol | Illudin M |
| daunorubicin | Kidamycin |
| methotrexate | Labriformin |
| dextromethorphan | Landomycin A |
| thiostrepton | Lycobetaine chloride |
| propylthiouracil | Megaphone acetate |
| clotrimazole | N,N-Dibenzyldaunorubicin hydrochloride |
| amiodarone | Neriifolin |
| thioguanosine | Nybomycin acetate |
| rimexolone | Predorine |
| tranylcypromine | Sanguilutine pseudobase |
| ginkgolide A | Scilliglaucosidin |
| GW-8510 | Scutellaprostin D |
| hycanthone | |
| rolitetracycline | |
| dipyridamole | |
| perphenazine | |
| beta-escin | |
| 0173570-0000 | |
| hexamethonium bromide | |
| vorinostat | |
| trifluoperazine | |
| prochlorperazine | |
| 15-delta prostaglandin J2 | |
| thioridazine | |
| trichostatin A | |
| fluphenazine | |
| LY-294002 |
We also made use of publicly available drug sensitivity data from the National Cancer Institute (NCI). We have recently described a strategy that correlates the phenotype of interest (as measured by expression signature) with the pattern of drug sensitivity in the NCI-60 cancer cell line panel(8). Here we used the CSR signature to identify compounds that preferentially inhibit growth of cell lines exhibiting the high-CSR phenotype. This analysis identified457 compounds (462 experiments) at false-discovery rate of less than 0.3 (Suppl Table S7). Of these, 35 compounds were recognizable drugs (Table 1).Once again, topoisomerase inhibitors including multiple derivatives of ellipticine and N,N-Dibenzyldaunorubicin hydrochloride emerged from this analysis.
Experimental validation of candidate drugs targeting the CSR phenotype
To investigate the specificity of the candidate compounds towards samples with high CSR phenotype, we made use of a panel of breast cancer cell lines for which we could carry out measures of drug sensitivity and then compare this to microarray-based predictions of the CSR phenotype to determine if there was a relationship between the two. As shown in Suppl Fig. 4A drugs predicted to target the CSR phenotype (etoposide, topotecan, daunorubicin) showed preferential growth inhibitory activity in high-CSR cell lines. More importantly, etoposide, topotecan, daunorubicin and resveratrol showed selective cytotoxicity towards cell lines with high CSR (Fig. 3). In contrast, another commonly used chemotherapeutic, docetaxel, which was not predicted to display CSR selectivity, showed no differential activity towards CSR-high or CSR-low cell lines (Suppl Fig. 4B).
Figure 3. Specificity of predicted drugs towards high-CSR breast cancer cell lines.

Twelve breast cancer cell lines were treated with the indicated drugs for three days. The viability of cells was assessed by MTS colorimetric assay.
Cell lines were divided to two categories of high CSR (CSR>0.5-dark grey) and low CSR (CSR<0.5- light grey) as determined by expression microarrays. Cytotoxic effect was expressed as a percentage of the reading taken from a parallel plate at the time of drug application (% of day 0). Averages of duplicate wells from 2–4 independent experiments were pooled together according to the CSR category. The box shows 25th percentile to 75th percentile with a line at the median. The whiskers indicate the highest and the lowest values.
Utility of the CSR signature in predicting clinical response
Topoisomerase inhibitors as a class were independently predicted by both computational approaches to be preferentially effective in high-CSR tumors. As a measure of the ability of the CSR signature to predict a clinical response to agents identified by the CSR signature, we analyzed microarray data from a study of 132breast cancer patients treated with aneoadjuvant combination regimen (TFAC) that included the topoisomerase inhibitors doxorubicin or epirubicin (19). The CSR signature was used to predict the status of the CSR phenotype in each of the patient samples and then plotted as a function of the clinical response to TFAC. As can be seen from the analysis in Fig.4, patients that achieved a pathological complete response (pCR) to TFAC had a substantially higher CSR signature score than patients that did not respond to TFAC. Importantly, CSR status was able to predict response to TFAC (Table 2). The proportion of patients responding to TFAC was almost seven fold higher when their tumors displayed high CSR.
Figure 4. Clinical significance of CSR signature.
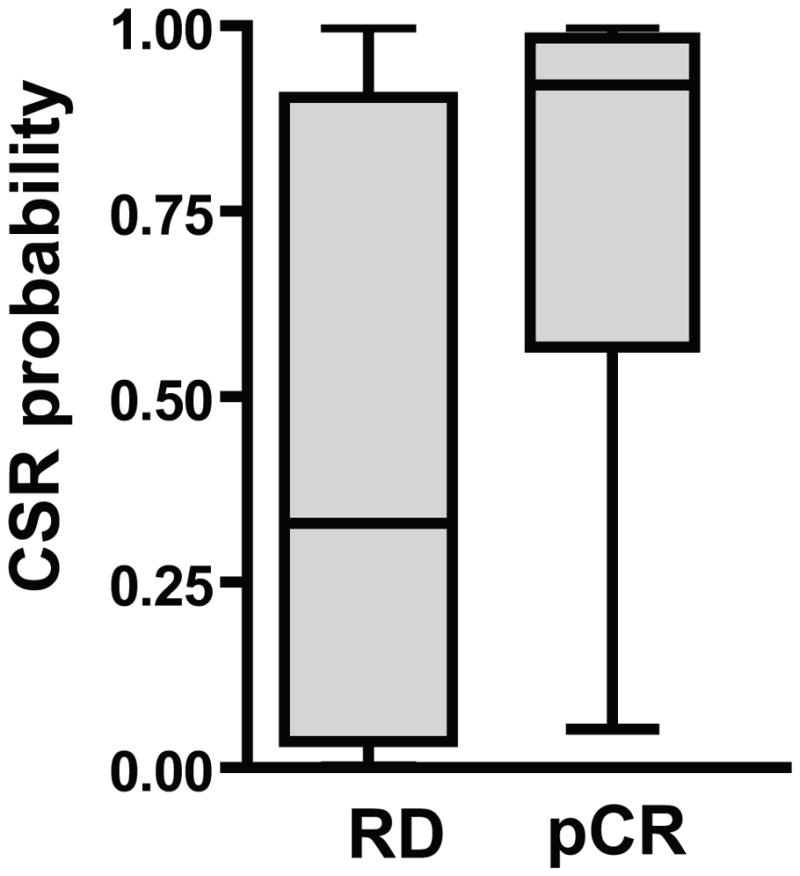
CSR signature predictions in 132 breast cancer patients treated with a combination of Taxol, 5FU, doxorubicin (or epirubicin)and cyclophosphamide (TFAC) in the neoadjuvant setting (19) stratified by clinical endpoint. The box shows 25th percentile to 75th percentile with a line at the median. The whiskers show the highest and the lowest values. Patients that achieved a pathological complete response (pCR) to TFAC had a significantly higher CSR signature score than patients that did not respond to TFAC (p<0.0001 by two tailed Mann Whitney test).
Table 2. CSR signature predicts response to TFAC.
CSR signature was evaluatedin a dataset of 132 breast cancer patients treated with a combination of Taxol, 5FU, doxorubicin (or epirubicin)and cyclophosphamide (TFAC) in aneoadjuvant setting (19). Numbers and percentages of patients that had pathological complete response (pCR) to TFAC are shown for low-CSR (CSR<0.3) and high-CSR (CSR>0.7) tumors. RD-residual disease.
| CSR | pCR (%) |
|---|---|
| CSR<0.3 | 3/51 (5.9) |
| CSR>0.7 | 24/61 (39.3) |
Discussion
The challenge of dissecting the heterogeneity of cancers is perhaps most acute in therapeutic considerations, attempting to match the right drug or drugs with the unique characteristics of the individual tumor. This is best illustrated with the example of Herceptin–an important drug for the treatment of breast cancer but only in the fraction of patients that are Her2 positive and then only in a fraction of these patients. Ultimately, Herceptin only benefits a small fraction of breast cancer patients (<10%), emphasizing the importance of directing therapy but also the critical need for many more drugs.
Our results suggest that the characteristics measured with the CSR signature reflect important and clinically significant characteristics that define distinct classes of various types of tumors. Thus the CSR signature joints numerous other stem cell signatures described previously, which demonstrated strong prognostic value in diverse cancer types (2–4, 20). We would like to stress, however, that it was not clear how the knowledge that a particular tumor exhibits ES-like character would affect therapy selection for an individual patient. It is in this context that the work we describe here is addressed–development of an expression signature that reflects a stemness-related phenotype and then using this signature as a basis for not only identifying those tumors that possess this phenotype but at the same time, linking the signature with therapeutic opportunities.
The computational methodology described in this study was used to find drugs targeting the CSR phenotype. However, this workflow could be easily generalized for any phenotype-based drug screen. The main idea is to use different methods to rank the degree of phenotype in question in a large relevant expression microarray dataset. The ranking methods are not limited to expression-based methods, but rather, may incorporate various types of information such as sequencing data, morphologic data, pathological scores etc. Using consensus of different rankings (or any other method such as average rank) samples representing the extremes of the phenotype are identified. Next, the training set is used to derive an expression signature, which represents the phenotype of interest. This signature serves as a portable link enabling quantification of the phenotype in diverse biological samples with available microarray data. The signature could be directly used in a search for potential drugs that might repress (or induce) the investigated phenotype. To this end, several independent methods (such as correlation with NCI60 drug sensitivity data or Connectivity Map) are used. Drugs that are identified by several independent methods get higher priority for further validation.
Notably, despite the fact that our computational drug predictions did not take into account the biological function of genes comprising the CSR signature, some mechanistic relationships could be readily identified. For example, the target of topoisomerase inhibitors, Top2A, is present and highly weighted in the CSR signature. Similarly, identification of cyclin-dependent kinase inhibitors as CSR-targeting drugs is in agreement with the presence of cyclin B, cyclin A, and cdc2 in the CSR signature. These drug-target associations further support the power of the presented unbiased computational approaches to identify relevant phenotype-specific drugs.
We suggest that the ability to identify various tumors as exhibiting high-CSR phenotype and then match this with appropriate therapeutic agents is an important application of the expression signature concept. Conversely, since low CSR signature associates with good prognosis but extremely low response rate to a common neoadjuvant regimen, determination of low-CSR tumor status might spare the side effects of aggressive chemotherapy from the patients that are highly unlikely to benefit from such treatment.
Our computational screens identify multiple drugs, including those drugs that did not show promising results in unselected patients, which might reclaim clinical value when targeted to patients with high-CSR tumors. One intriguing hit from our computational screen, CSR-specificity of which was experimentally validated is resveratrol. The anti-tumor properties of this dietary polyphenol were demonstrated in numerous in-vitro studies; however, efficacy in human patients is still controversial. Based on our results, potential use of CSR as a biomarker for resveratrol use might be considered in design or analysis of clinical trials.
Supplementary Material
Acknowledgments
We thank Dr. Anil Potti and all members of Nevins laboratory for helpful discussions. The research was supported by funding from the NCI (CA112952 and CA106520) and the V Foundation for Cancer Research.
References
- 1.Nevins JR, Potti A. Mining gene expression profiles: expression signatures as cancer phenotypes. Nat Rev Genet. 2007;8:601–9. doi: 10.1038/nrg2137. [DOI] [PubMed] [Google Scholar]
- 2.Ben-Porath I, Thomson MWy, Carey VJ, et al. An embryonic stem cell-like gene expression signature in poorly differentiated aggressive human tumors. Nat Genetics. 2008;40:499–507. doi: 10.1038/ng.127. [DOI] [PMC free article] [PubMed] [Google Scholar]
- 3.Liu R, Wang X, Chen GY, Dalerba P, et al. The prognostic role of a gene signature from tumorigenic breast-cancer cells. N Engl J Med. 2007;356:217–26. doi: 10.1056/NEJMoa063994. [DOI] [PubMed] [Google Scholar]
- 4.Wong DJ, Liu H, Ridky TW, Cassarino D, Segal E, Chang HY. Module map of stem cell genes guides creation of epithelial cancer stem cells. Cell Stem Cell. 2008;2:333–44. doi: 10.1016/j.stem.2008.02.009. [DOI] [PMC free article] [PubMed] [Google Scholar]
- 5.Gatza ML, Lucas JE, Barry WT, et al. A pathway-based classification of human breast cancer. Proc Natl Acad Sci. 2010 doi: 10.1073/pnas.0912708107. [DOI] [PMC free article] [PubMed] [Google Scholar]
- 6.Park IH, Zhao R, West JA, et al. Reprogramming of human somatic cells to pluripotency with defined factors. Nature. 2008;451:141–6. doi: 10.1038/nature06534. [DOI] [PubMed] [Google Scholar]
- 7.Shedden K, Taylor JM, Enkemann SA, et al. Gene expression-based survival prediction in lung adenocarcinoma: a multi-site, blinded validation study. Nat Med. 2008;14:822–7. doi: 10.1038/nm.1790. [DOI] [PMC free article] [PubMed] [Google Scholar]
- 8.Mori S, Chang JT, Andrechek ER, Potti A, Nevins JR. Utilization of genomic signatures to identify phenotype-specific drugs. PLoS One. 2009;4:e6772. doi: 10.1371/journal.pone.0006772. [DOI] [PMC free article] [PubMed] [Google Scholar]
- 9.Benjamini Y, Hochberg Y. Controlling the False Discovery Rate: A Practical and Powerful Approach to Multiple Testing. J R Statist Soc B. 1995;57:289–300. [Google Scholar]
- 10.Bild AH, Yao G, Chang JT, et al. Oncogenic pathway signatures in human cancers as a guide to targeted therapies. Nature. 2006;439:353–7. doi: 10.1038/nature04296. [DOI] [PubMed] [Google Scholar]
- 11.Wang J, Wakeman TP, Lathia JD, et al. Notch promotes radioresistance of glioma stem cells. Stem cells. 2010;28:17–28. doi: 10.1002/stem.261. [DOI] [PMC free article] [PubMed] [Google Scholar]
- 12.West M, Blanchette C, Dressman H, et al. Predicting the clinical status of human breast cancer by using gene expression profiles. Proc Natl Acad Sci U S A. 2001;98:11462–7. doi: 10.1073/pnas.201162998. [DOI] [PMC free article] [PubMed] [Google Scholar]
- 13.Singh SK, Clarke ID, Terasaki M, et al. Identification of a cancer stem cell in human brain tumors. Cancer Res. 2003;63:5821–8. [PubMed] [Google Scholar]
- 14.Pollard SM, Yoshikawa K, Clarke ID, et al. Glioma stem cell lines expanded in adherent culture have tumor-specific phenotypes and are suitable for chemical and genetic screens. Cell Stem Cell. 2009;4:568–80. doi: 10.1016/j.stem.2009.03.014. [DOI] [PubMed] [Google Scholar]
- 15.Fillmore CM, Kuperwasser C. Human breast cancer cell lines contain stem-like cells that self-renew, give rise to phenotypically diverse progeny and survive chemotherapy. Breast Cancer Res. 2008;10:R25. doi: 10.1186/bcr1982. [DOI] [PMC free article] [PubMed] [Google Scholar]
- 16.Loi S, Haibe-Kains B, Desmedt C, et al. Definition of clinically distinct molecular subtypes in estrogen receptor-positive breast carcinomas through genomic grade. J Clin Oncol. 2007;25:1239–46. doi: 10.1200/JCO.2006.07.1522. [DOI] [PubMed] [Google Scholar]
- 17.Pomeroy SL, Tamayo P, Gaasenbeek M, et al. Prediction of central nervous system embryonal tumour outcome based on gene expression. Nature. 2002;415:436–42. doi: 10.1038/415436a. [DOI] [PubMed] [Google Scholar]
- 18.Lamb J, Crawford ED, Peck D, et al. The Connectivity Map: using gene-expression signatures to connect small molecules, genes, and disease. Science. 2006;313:1929–35. doi: 10.1126/science.1132939. [DOI] [PubMed] [Google Scholar]
- 19.Hess KR, Anderson K, Symmans WF, et al. Pharmacogenomic predictor of sensitivity to preoperative chemotherapy with paclitaxel and fluorouracil, doxorubicin, and cyclophosphamide in breast cancer. J Clin Oncol. 2006;24:4236–44. doi: 10.1200/JCO.2006.05.6861. [DOI] [PubMed] [Google Scholar]
- 20.Glinsky GV, Berezovska O, Glinskii AB. Microarray analysis identifies a death-from-cancer signature predicting therapy failure in patients with multiple types of cancer. J Clin Invest. 2005;115(6):1503–21. doi: 10.1172/JCI23412. [DOI] [PMC free article] [PubMed] [Google Scholar]
Associated Data
This section collects any data citations, data availability statements, or supplementary materials included in this article.