

Abstract
We show that lobster olfactory receptor neurons (ORNs), much like their vertebrate counterparts, generate a transient elevation of intracellular calcium (Cai) in response to odorant activation that can be used to monitor ensemble ORN activity. This is done in antennal slice preparation in situ maintaining the polarity of the cells and the normal micro-environment of the olfactory ilia. The Cai signal is ligand-specific and increases in a dose-dependent manner in response to odorant stimulation. Saturating stimulation elicits a robust increase of up to 1 μM free Cai within 1–2 sec of stimulation. The odor-induced Cai response closely follows the discharge pattern of extracellular spikes elicited by odorant application, with the maximal rise in Cai matching the peak of the spike generation. The Cai signal can be used to track neuronal activity in a functional subpopulation of rhythmically active ORNs and discriminate it from that of neighboring tonically active ORNs. Being able to record from many ORNs simultaneously over an extended period of time not only allows more accurate estimates of neuronal population activity but also dramatically improves the ability to identify potential new functional subpopulations of ORNs, especially those with more subtle differences in responsiveness, ligand specificity, and/or transduction mechanisms.
Introduction
An exciting new aspect of olfactory research is the emerging understanding that the olfactory periphery consists of multiple functional subtypes of ORNs. In mammals, for example, some are contained in organs other than the main olfactory epithelium (MOE), including the vomeronasal organ, the septal organ of Masera, the Grueneberg ganglion, but functionally different subsets of ORNs also occur within the MOE, including TAAR-expressing neurons and GC-D neurons [1–3]. This functional complexity in the olfactory periphery presumably is a general principle of olfactory organization. At least two different subsets of insect ORNs can be identified based on the type of receptors they express [4, 5]. Similarly, lobster ORNs fall at least into two functional classes based on whether their inherent activity is tonic or rhythmic [6]. Ultimately, we need to better understand the functional significance of this organizational diversity in the olfactory periphery.
Typically, functionality of ORNs is studied by patch-clamping or otherwise recording from single ORNs to obtain a representative response of cell to the variable(s) under study. Data obtained from cells usually recorded over several days are then analyzed statistically to obtain a reliable measure of the overall responsiveness of ‘like’ cells. While patching single cells is necessary for specific types of information, it is a highly inefficient way of obtaining population data and risks imposing experimental variability. To surmount these limitations in mammalian ORNs, investigators have used calcium imaging to measure on/off activity in acutely dissociated ORNs. This approach has been instrumental, for example, in developing the concept of combinatorial coding in canonical mammalian ORNs [7]. For more detailed functional analyses, however, it is advantageous to measure ORN activity in situ in order to improve the viability of the cells, to maintain their normal polarity and ionic environment in the epithelium, and to allow recording ensemble activity simultaneously [8–10].
The lobster is an established invertebrate animal model in olfactory research and offers relatively easy access to the cell bodies of ORNs in its large olfactory organ, the antennules. Calcium imaging has been used in invertebrates to record activity in situ from the olfactory CNS [11–13], although its utility to understanding the olfactory periphery has largely gone untested. Therefore, we investigated whether calcium imaging of lobster ORNs in situ could be used to study the functional organization of the olfactory organ. We show lobster ORNs in situ generate a somatic calcium signal that correlates with the electrophysiological response of the cells and can be used to characterize ensemble activity capable of discriminating and, ultimately, rigorously characterizing, functional subpopulations of the cells.
Methods
Preparation
Lobster ORNs were imaged in situ using a preparation developed earlier [6, 14]. In brief, a single annulus was excised from the lateral antennular filament and the cuticle on the side opposite from the olfactory sensilla (aesthetascs) was removed to provide better access to the cell bodies of the ORNs in the lumen of the annulus (Fig. 1A). Following treatment with trypsin, papain or collagenase (1mg/ml) the ensheathing tissue covering clusters of ORNs was carefully removed. This step was essential for successful dye loading. The specimens were mounted on a plastic or glass-bottom 35mm Petri dish and placed on the stage of an inverted microscope. ORNs were continuously superfused with Panulirus saline (PS) containing (mM): 486 NaCl, 5 KCl, 13.6 CaCl2, 9.8 MgCl2 and 10 HEPES, pH 7.8–8.0. A second application contour delivered stimulation solution to the olfactory sensilla containing the outer dendrites of the ORNs. Solution application was configured to confine odorant delivery to the outer dendrites (Fig.1A). Both perfusion contours were gravity fed. An aqueous extract of Tetra Marine (TET, Tetra Werke, Melle, Germany), a commercially available marine fish food was used as an odorant in most experiments. TET powder was dissolved in water 0.1g/ml, filtered through 0.2 μm syringe filter and for experiments diluted 1:200 in PS. The final maximum saturating concentration used in experiments was ~0.5 mg/ml. In some experiments several aminoacids (1 mM) were used to stimulate the ORNs. The stimulating stream washing the sensilla (~250 μl/min) was switched rapidly using a multi-channel rapid solution changer (RSC-160, Bio-Logic) under the software control of Clampex 9 (Molecular Devices). Stimulus intensity was controlled by changing the duration of odorant pulses/of exposure to odorant. The initial duration of odorant pulse, maximum exposure time and time increment varied and were selected, when necessary, for different preparations and/or ORNs individually. Maximum exposure time usually did not exceed 1 s at peak concentration.
Figure 1.
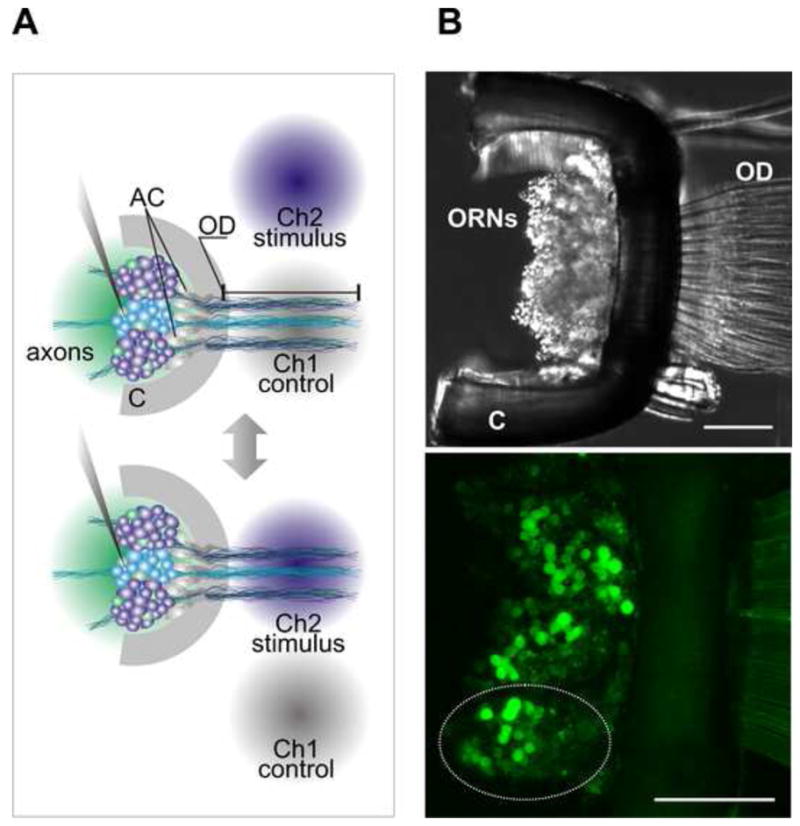
Schematic representation of the in situ preparation of lobster olfactory organ and stimulus delivery system. (A) Approximately 200–300 ORNs form a neuronal cluster projecting dendrites in a single hair-like structure aesthetasc (only three shown for clarity). Two independent gravity fed perfusion counters permanently wash ORN cell bodies (green circle) and outer dendrite zone (gray circle). Stimulation solution was rapidly switched between the two channels precisely applied only to the outer dendrites (blue circle). (B) DIC image of a single annulus of the antennule (olfactory organ). The cuticle is cut away to allow access to the ORN cell body for recording without disturbing the outer dendrites seen partially on the right. Cell bodies of ORNs (which can be clearly resolved in this picture) fill the lumen of the organ below the arc of cuticle. (C) Flattened stack of confocal images taken from the preparation loaded with fluo-4/AM. Roughly three clusters of ORNs could be visualized (dotted line denotes a single cluster). Auxiliary cells (AC), cuticle (C), outer dendrites (OD) is the signal transduction compartment of the olfactory receptor neurons (ORNs). Scale bars 100 μm.
Electrophysiological recordings and data analysis
Extracellular action potentials (spikes) were recorded from the soma of ORNs using loose-patch recording. Patch electrodes were pulled from borosilicate capillary glass (Sutter Instrument, BF150–86–10) using a Flaming-Brown micropipette puller (P-87, Sutter Instrument) and filled with PS. Resistance of the electrodes was 1–5 MOhm when filled with PS. Spikes were measured with an Axopatch 200B patch-clamp amplifier (Molecular Devices), low-pass filtered at 5 kHz, sampled at 5–20 kHz. Data were collected and analyzed with pCLAMP 8.1/9.2 software (Molecular Devices) in combination with SigmaPlot 8/9.0 (SPSS). The time of occurrence of the spike was taken as the time of peak current deflection, i.e., the peak of the spike.
Calcium imaging and data analysis
After enzymatic treatment and cleaning the preparation was placed in Eppendorf tube in PS containing the fluorescent calcium indicator of choice: Fluo – 3/AM, Fluo – 4/AM, Calcium Green – 1/AM, Fura – 2/AM (Invitrogen) or Quest Fluo – 8/AM (AAT BioQuest) at 5 – 15 μM prepared with 0.2 – 0.06% Pluronic F-127 (Invitrogen). The tube was mounted on the platform of horizontal shaker; loading was usually complete after at least 1 hr of agitation at room temperature. Mechanical agitation of the solution was absolutely required step to achieve effective dye loading. The tissue was transferred into fresh PS and mounted for imaging. After the dye loading the preparation typically remained viable for 2–4 hours when kept in normal PS. Fluorescence imaging was performed on an inverted microscope (Olympus IX-71) equipped with a cooled CCD camera (ORCA R2, Hamamatsu) under the control of Imaging Workbench 6 software (INDEC Systems). The software allows for complete integration with electrophysiological recording using Clampex 9 including triggering of the imaging system and synchronization of both optical and electrical signal acquisition. The illumination system (Lambda L10-BS with a SmartShutter controller, Sutter Instruments) was coupled to the microscope with a liquid light guide. A standard FITC filter set (excitation at 510 nm, emission at 530 nm, dichroic mirror 515 nm) was used for a single-wavelength measurements. Ratiometric imaging was performed using Fura-2 filter set (excitation at 340 nm or 380 nm, emission at 510 nm, dichroic mirror 435 nm). 336×256 pixels images were collected using 4×4 binning at 3–4 Hz to discriminate possible fast transient signals accompanying neuronal spontaneous action potentials. Illumination of cells was optimized to reduce photobleaching as follows. Excitation light was attenuated by a neutral density filter (ND 1.0) and exposure was set to 50 ms per frame (see Supplemental Figure S2). Even with a continuous illumination at 20 Hz sampling rate photobleaching was acceptable, not exceeding 10% during several minutes long recording. Stored time series image stacks were analyzed off-line using Imaging Workbench 6 or exported as TIFF files into ImageJ 1.42 (available from public domain at http://rsbweb.nih.gov/ij/index.html). For illustration and analysis purposes continuous traces of multiple responses were normalized and compensated for slow drift of the baseline fluorescence intensity due to random tissue movements and photobleaching (cf. raw recording shown in supplementary figure S2).
After each experiment using Fura-2 the preparation was washed thoroughly with Ca-free (no added Ca2+ or Mg2+) 10 mM EGTA PS to remove all residual extracellular Ca2+. It was then incubated in Ca-free PS or normal PS supplemented with 10 μM ionomycin (supplemental figure S1). Permeabilization of cells was monitored by measuring a decrease of 340/380 ratio (R). In a few experiments 0.1% digitonin was used to disrupt the cell membrane of ORNs and gave essentially the same results as with ionomycin calibration. Fluorescence background at both 340 nm and 380 nm was measured following addition of PS containing 10 mM MnCl2 quenching completely fura-2. The Cai concentration was calculated following standard equation, [Ca2+] = [(R-Rmin)/(Rmax-R)]*Kd*Sf/Sb [15]where Rmin is measured under Ca-free conditions, Rmax refers to a saturated Ca2+ concentration, Sf/Sb is a ratio of 380 nm fluorescence intensity measured at the minimal and maximal Ca2+ concentration. We used the previously determined Kd of 640 nM appropriate for measuring cytoplasmic Ca2+ concentration in neuronal cells of marine invertebrates [16].
To measure changes in intracellular pH the preparation was loaded with 15 μM BCECF (AnaSpec), a pH-sensitive fluorescent probe using the same protocol as above. Fluorescence associated with pH was detected using the same illumination as for Fluo-4. Sensitivity of the probe was confirmed by incubating the tissue in 50 mM KCl ASW supplemented with 10 μM nigericin and pH adjusted to 7.5, 7.1 or 5.4.
Data analysis
Data analysis was performed using ClampFit 9.2 (Molecular Devices), IgorPro 4.09 (Wavemetrics) or SigmaPlot 10 (Systat). Peristimulus Cai response and spike frequency distribution were fit with a double exponential function using ClampFit 9.2 or SigmaPlot. The data are presented as the mean ± SEM of n observations. In total, data were obtained from 28 lobsters. All recordings were performed at room temperature (22–25°C).
Results
The in situ lobster nose preparation provides direct access to the soma of the hundreds of ORNs that fill the lumen of the antenna (Fig. 1A,B). Each of the approximately 9–12 olfactory sensilla (aesthetascs) on one annulus contains the outer dendrites of an average of 300 ORNs [17], or approximately 3000–4000 ORNs per preparation. The ORNs are viable and responsive to odorants for extended periods of time (e.g. Fig. 5). Following optimization, most ORNs could be successfully loaded with calcium probes (Fig. 1B, bottom panel). Consistent with previous report [6] we measured spike bursting from rhythmically active ORNs (Fig. 2A) and approximately 21% (75/357) of cells sampled in several preparations generated spontaneous transient elevations in intracellular calcium (Cai), each with a distinct pattern of rhythmicity (Fig. 2B, upper three traces, supplemental movie S1). The other neurons in the cluster remained quiescent and showed little if any such oscillations in Cai (Fig. 2B, lower three traces). However most of these quiescent cells were odorant-sensitive otherwise, typical of tonically active ORNs [6].
Figure 5.

Specificity of the odor-induced Cai response in lobster ORNs. (A) Pseudo-colored images of the cluster stimulated with TET. Each image was acquired at the times indicated by red dots on top of the second response (second row). The odor was applied 6 times to demonstrate high reproducibility of the response. Each trace was color coded according to selected 8 most sensitive cells. Note a cell with high Cai already in the first image, this was likely a spontaneously active ORN. (B) The cluster was stimulated with glutamate (1 mM). Only three cells generated Cai response. (C) Application of taurine (1 mM) elicited just above threshold response in two cells one of which was sensitive to TET and glutamate (white arrow). ORNs demonstrating spontaneous Cai transients were rejected from the analysis. Scale bars shown in (A) are the same for B and C.
Figure 2.
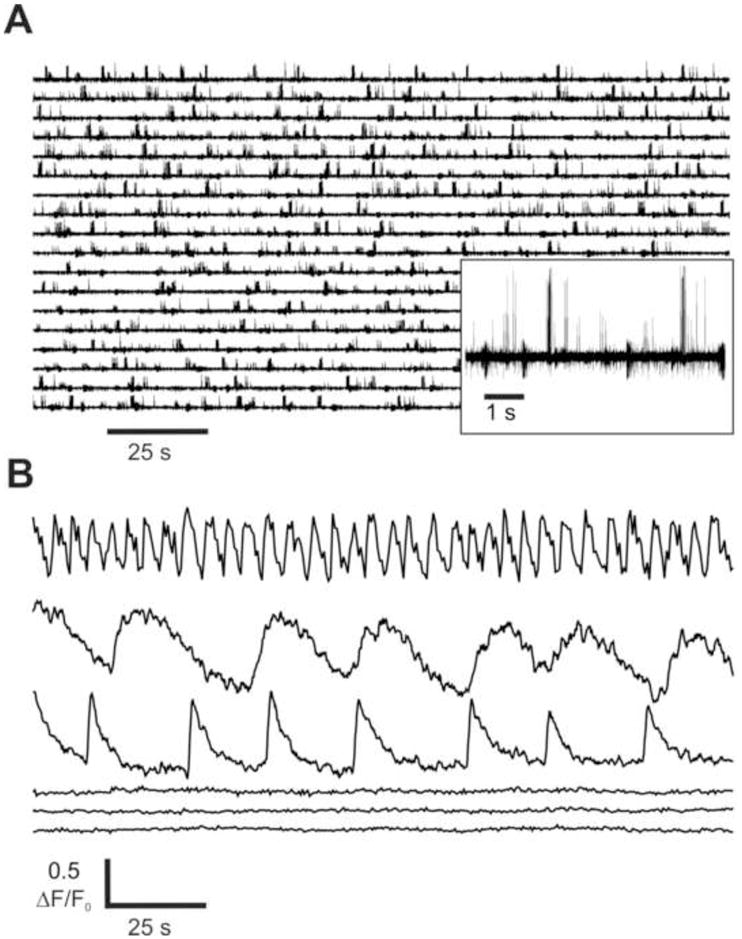
Spontaneous activity of lobster ORNs measured electrophysiologically and using calcium imaging. (A) A representative somatic extracellular spike recording from lobster ORNs. Often a single-electrode recording shows multiunit bursting activity with different burst frequencies generated by several ORNs (inset). (B) Two types of lobster ORNs are confirmed by calcium imaging. Representative recordings measured in 3 cells with no spontaneous oscillating activity and 3 rhythmically active (oscillating) ORNs from the same neuronal cluster.
Odorants generate a Cai transient that correlates with the spike discharge of the ORNs
In a typical experiment (n = 5) illustrated in Figure 3, 23 responsive cells in a cluster of 57 cells responded to application of TET. Increasing the duration of the odor application from 100 to 1200 ms, which effectively increased the concentration of the odorant as described in Methods, increased the number of responsive neurons (Fig. 3A) and the magnitude of the Cai transient (Fig. 3B,C) in a dose-dependent manner. The Hill approximation of the averaged normalized amplitude of the Cai response evoked by different concentrations (duration) of odorant yielded a K1/2 = 680 ms and an h = 5. The responses to saturating stimuli reached a maximum in 6.8 ± 0.2 s (n = 26) and recovered with time constant of 13.6 ± 0.8 s (n = 26).
Figure 3.
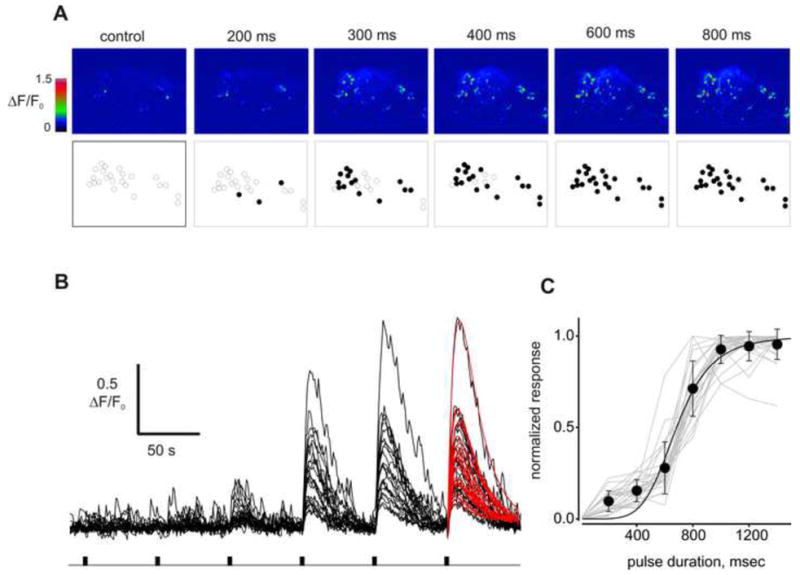
The odorant stimulation elicits dose-dependent Cai elevation in lobster ORNs. (A) Lobster nose preparation was loaded with fluo-4/AM and stimulated with Tetra Marine (TET, 0.5 mg/ml). Each pseudo-color image was acquired at the peak of Cai signal approximately 5 s after the stimulation pulse (pulse duration shown above images). Total 23 cells (empty circles, 2nd row) were analyzed. Activated cells are denoted as filled circles. Note several cells with high Cai already in the control, these were likely spontaneously active ORNs. (B) Cai signals evoked by odor pulses of increasing intensity. Kinetics of the response to a saturated stimulation (800 ms) was analyzed using approximation of the Cai signals with exponential functions (e.g red smooth curves). (C) Dose-dependence of the odor-induced Cai response measured in 23 cells shown individually (gray lines) and as an average. Data were normalized to maximum values and fit by a Hill equation (solid curve) with following parameters, K1/2 = 680 ± 42 ms, h = 5.4 ± 1.6. Data are presented as mean ± SD.
The kinetics of the Cai response correlated with the odor-evoked activity of the ORNs measured electrophysiologically, as shown by patching an ORN after initially identifying it as an odorant responsive cell by calcium imaging (Fig. 4A inset). Only tonically active cells, i.e., those not generating rhythmic Cai transients, were used in these experiments to avoid possible confound by inherent changes in Cai level. Saturating stimulation (TET, 800 ms) consistently evoked robust spike discharge accompanied by Cai elevation in 4 such cells (Fig. 4A, supplemental figure S2). For the cell shown, fitting the rising phase of the responses with a single exponential yielded time constants (tau) of 0.76 s for spikes and 4.7 s for Cai, whereby the maximal spike count matched the rising phase of the Cai transient (Fig. 4B).
Figure 4.

Cai elevation closely follows electrophysiological response recorded from a single lobster ORN. (A) Fluo-4 fluorescence image of the cluster with glass electrode attached to the cell (inset, white arrow). Representative Cai and extracellular spike recording from a cell repetitively stimulated with TET. Only first three responses out of ten recorded are shown. (B) Averaged Cai response (n = 3, solid curve, right ordinate) and spike count histogram (n = 3, gray bars, left ordinate; bin width = 0.5 s) were approximated by the sum of the exponential functions and superimposed. Every 20th point of the data shows SD of the mean. Peak spike count corresponds to the fastest rise of the Cai response: time to peak 1 s (spikes) vs 3.6 s (Cai). Recovery of both the responses was well approximated by an exponential fit with a time constant tau = 8.2 s (spikes) vs 11.3 s (Cai). (C) Single Cai response from the cell shown in (A) shown at a faster time scale. Importantly, a few action potentials generate detectable Cai change. Correlated events marked by asterisks with a number of spikes underlying each event.
Recovery of the response could be approximated with a single exponential with time constants (tau) of 8.2 s for spikes and 11.3 s for Cai (Fig. 4B). Smaller brief Cai transients occurred coincident with spontaneously generated spikes before and after recovery from the odorant-induced Cai transient, as can be seen on an expanded time base (Fig. 4C asterisks). On average as few as 2 spikes were enough to consistently generate a 5% DF/F0 change in Cai. We conclude that bulk somatic changes in Cai correlate well with extracellular spikes generated spontaneously and following odor stimulation.
The Cai response reflects the known odorant specificity of the ORNs
Repetitive saturating stimulation (800 ms) with a complex odorant (TET) consistently elicited Cai transients in many cells, although with different peak magnitudes (Fig. 5A, supplemental movie S2). On average TET activated 57% of the cells (n = 338) in seven different preparations. Among the most sensitive of the cells shown in Fig. 5A (labeled with colored circles), three cells responded to glutamate (Fig. 5B) and two cells responded to taurine (Fig. 5C). One of the cells was more broadly tuned to all three odorants (blue circle). Two other amino acids, arginine and glycine, were tested in the same manner. Collectively, the incidence of activation for all odorants tested was: Tetra Marine - 57% (202/353 cells), glutamate - 4% (4/95 cells), taurine – 1% (3/242 cells), arginine – 0% (0/52 cells) and glycine – 3% (3/89 cells). These findings confirm the known specific nature of the tuning of ORNs in general and lobster ORNs in particular, and prove the feasibility of using calcium imaging to screen for the molecular receptive range of lobster ORNs in situ.
Measuring the concentration of the odorant-induced Cai
We estimated the absolute concentration of Cai in lobster ORNs loaded with fura-2/AM (10 μM) by washing the cells in Ca-free PS containing 10 mM EGTA and permeabilizing them with 10μM ionomycin following an experiment. Following transient elevation of Cai induced by added ionomycin the 340/380 ratio decreased significantly below its resting level in intact cells, which we used as the reference level (supplemental figure S1). Fig. 6 shows the odorant-induced changes in Cai concentration in two representative cells of 26 tested in this manner. The odorant-induced increase in Cai measured with fura-2 was qualitatively very similar to that measured with fluo-4 (Fig. 3B). However, the cells showed variability in terms of the change in the absolute Cai concentration. As illustrated by these two cells, resting Cai could differ by almost 2-fold, as could the peak amplitude of the response to a saturating odorant stimulation (Fig. 6A vs 6B). Under resting conditions the Cai averaged 776 ± 40 nM (n = 26) with the lowest and highest values measuring 373 and 1174 nM, respectively (Fig. 6C). Odorant stimulation increased Cai in a typical dose-dependent manner (Fig. 6D), with the maximal increase in Cai ranging from 139 to 1153 nM (average = 487 ± 47 nM, n = 26). The responses themselves to a saturating odor stimulation, subtracted steady state levels to compare their shape and kinetics, reached a peak within 10 sec (time to peak 6.4 ± 0.2 s, n = 19) and returned to baseline within 50–60 s with a time constant of 13.8 ± 1.6 s (n = 19), essentially the same as the kinetics of the Cai transients measured with fluo-4. We found no correlation between the resting Cai and peak odor-induced Cai response (Fig. 6E).
Figure 6.

Quantitative measurement of the odorant-induced Cai changes in lobster ORNs. (A, B) Ratiometric calcium measurements shown in 2 representative cells loaded with Fura-2/AM. Traces show an increase in Cai concentration induced by application of TET (0.5 mg/ml) pulses of increasing from 100 to 800 ms duration. (C) Distribution histogram of resting Cai concentration in the same ORN population. Bin width – 200 nM Cai concentration (n = 26). (D) Dose-dependent changes of the mean peak amplitude of Cai concentration measured in the cells. Data were fit to a Hill equation with following parameters, K1/2 = 253 ms, h = 3. (E) Individual peak Cai response amplitudes plotted against resting Cai concentration. ORNs demonstrating spontaneous strong sporadic changes in Cai level as well as oscillating Cai signals were excluded from the analysis.
Binding of calcium to Ca-sensitive fluorescent probes can be affected also by changes in pH [18, 19]. To exclude possible interference between change in intracellular pH and the odor-induced Cai response we used a pH-sensitive probe BCECF. Even saturating stimulation of lobster cells with TET (1200 ms pulse) failed to induce a detectable change in cytosolic pH (data not shown). We conclude that changes of fura-2 fluorescence correctly reflect changes of Cai concentration.
Discussion
Several lines of evidence indicate that the Cai dynamic faithfully reflects the specific chemosensory neuron activity in lobster ORNs. All ORNs used in this study showed little if any reaction to sham stimulation. The responses were dose-dependent, as expected for typical ORNs and the population of ORNs reflected the known odorant specificity of the ORNs. Finally, consistent with our earlier findings, at least two ORN subpopulations - tonically and rhythmically active cells - can be identified based on the spontaneous calcium dynamic pattern of the cells.
We showed that odorants induce an increase of Cai in lobster ORNs. Similar increases observed in numerous other animals have been considered to reflect activation of voltage-gated calcium channels in the somatic plasma membrane [20]. Since lobster ORNs express a typical complement of voltage-dependent conductances for neurons, including a voltage-activated calcium conductance [21], we assume the increase in Cai we measured reflect in part the indirect activation of voltage-gated calcium channels. Calcium-induced calcium release from internal stores has also been reported from squid ORNs [22]. We assume lobster ORNs may also have internal calcium stores since bath application of ionomycin during fura-2 calibration induced a significant elevation in Cai under extracellular Ca-free conditions [23, 24]. Lobster ORNs are also known to generate IP3 which targets IP3 receptor channels on the plasma membrane of the olfactory dendrite [25]. However, it is not yet known how accurately changes of somatic Cai reflect remote transduction events occurring in olfactory dendrites which extend as far as several hundred micrometers from cell body in lobster ORN [26]. Thus, the increase in Cai we measured in the soma presumably arises from more than one source.
We never observed a decrease in Cai in response to odorant stimulation. However, we have tested only a limited number of single odorants and it would be interesting to see if any odorants could induce a net decrease in Cai since several odorants were shown to hyperpolarize lobster ORNs [27], which would oppose the membrane depolarization leading to spike generation and Cai elevation. Odorants reportedly reduce Cai in some human ORNs [28] as well as some ORNs in the channel catfish [29].
We have shown that even with wide-field imaging it is possible to detect Cai transients associated with a few spikes in lobster ORN (Fig. 4C). Obviously changes in bulk somatic Cai cannot precisely follow the local membrane gradients of Cai concentration accompanying the generation of a single action potential. Single spike creates relatively slow transient of somatic Cai serving as a low-pass filter that prevent precise temporal tracking of high frequency signals in the dendrites of mammalian neurons [30, 31] and in the extreme case of giant neurons from the abdominal ganglion of Aplysia, single action potentials lasting less than 10 ms are accompanied by a 4-s long somatic Cai transient [32]. In lobster, spontaneously generated Cai events evoked by a several action potentials are on a similar time scale and amplitude, for example, as those recorded with technically much more sophisticated two-photon technology in pyramidal neurons of mouse barrel cortex [33]. Thus we conclude that calcium imaging approach is a valuable tool to monitor neuronal activity in a population of lobster ORNs.
Knowing the absolute concentration of Cai provides valuable insight into ionic homeostasis in the ORNs of marine invertebrates exposed to high salt environment with a composition similar to that of artificial sea water used in this study [34]. Our estimate of Cai concentration, 776 ± 40 nM, is close to that measured in other neurons in marine invertebrates, e.g., 400 and 660 nM in Limulus ventral nerve photoreceptors [16, 35] and 500 nM in Aplysia bag cell neurons [36]. The resting concentration of Cai found in lobster ORNs is several-fold higher than that in vertebrate cells, around 100 nM [37]. This could have serious implications for the regulation of the signal transduction pathway as many enzymes involved in olfactory excitation and adaptation are calcium-dependent [38]. Active calcium transport was described in ORNs of at least one marine invertebrate [39] and therefore may be involved as well in shaping the olfactory output in lobster ORNs, as proposed for vertebrates ORNs [40, 41].
Conclusion
In summary, somatic calcium imaging appears to be a powerful tool to monitor neuronal activity within ensembles of lobster ORNs in situ. The methodology faithfully reflects the dynamics of both spontaneous and odor-evoked activity in the cells, and does so over extended periods of time. The utility of this approach to understanding the functional organization of the olfactory periphery in the lobster would appear to join that in other sensory systems, for example, the zebrafish optic tectum [42], the zebrafish olfactory bulb [43], and the insect olfactory lobe [12], to name a few.
Supplementary Material
Acknowledgments
This research was supported by the National Institute on Deafness and Other Communication Disorders (DC001655).
Footnotes
Publisher's Disclaimer: This is a PDF file of an unedited manuscript that has been accepted for publication. As a service to our customers we are providing this early version of the manuscript. The manuscript will undergo copyediting, typesetting, and review of the resulting proof before it is published in its final citable form. Please note that during the production process errors may be discovered which could affect the content, and all legal disclaimers that apply to the journal pertain.
References
- 1.Breer H, Fleischer J, Strotmann J. The sense of smell: multiple olfactory subsystems. Cell Mol Life Sci. 2006;63:1465–75. doi: 10.1007/s00018-006-6108-5. [DOI] [PMC free article] [PubMed] [Google Scholar]
- 2.Ma M. Encoding olfactory signals via multiple chemosensory systems. Crit Rev Biochem Mol Biol. 2007;42:463–80. doi: 10.1080/10409230701693359. [DOI] [PubMed] [Google Scholar]
- 3.Munger SD, Leinders-Zufall T, Zufall F. Subsystem Organization of the Mammalian Sense of Smell. Annu Rev Physiol. 2008 doi: 10.1146/annurev.physiol.70.113006.100608. [DOI] [PubMed] [Google Scholar]
- 4.Benton R, Vannice KS, Gomez-Diaz C, Vosshall LB. Variant ionotropic glutamate receptors as chemosensory receptors in Drosophila. Cell. 2009;136:149–62. doi: 10.1016/j.cell.2008.12.001. [DOI] [PMC free article] [PubMed] [Google Scholar]
- 5.Sato K, Pellegrino M, Nakagawa T, Vosshall LB, Touhara K. Insect olfactory receptors are heteromeric ligand-gated ion channels. Nature. 2008;452:1002–6. doi: 10.1038/nature06850. [DOI] [PubMed] [Google Scholar]
- 6.Bobkov YV, Ache BW. Intrinsically bursting olfactory receptor neurons. J Neurophysiol. 2007;97:1052–7. doi: 10.1152/jn.01111.2006. [DOI] [PubMed] [Google Scholar]
- 7.Malnic B, Hirono J, Sato T, Buck LB. Combinatorial receptor codes for odors. Cell. 1999;96:713–23. doi: 10.1016/s0092-8674(00)80581-4. [DOI] [PubMed] [Google Scholar]
- 8.Omura M, Sekine H, Shimizu T, Kataoka H, Touhara K. In situ Ca2+ imaging of odor responses in a coronal olfactory epithelium slice. Neuroreport. 2003;14:1123–7. doi: 10.1097/00001756-200306110-00005. [DOI] [PubMed] [Google Scholar]
- 9.Ma M, Shepherd GM. Functional mosaic organization of mouse olfactory receptor neurons. Proc Natl Acad Sci U S A. 2000;97:12869–74. doi: 10.1073/pnas.220301797. [DOI] [PMC free article] [PubMed] [Google Scholar]
- 10.Manzini I, Schild D. Classes and narrowing selectivity of olfactory receptor neurons of Xenopus laevis tadpoles. J Gen Physiol. 2004;123:99–107. doi: 10.1085/jgp.200308970. [DOI] [PMC free article] [PubMed] [Google Scholar]
- 11.Wertz A, Rossler W, Obermayer M, Bickmeyer U. Functional neuroanatomy of the rhinophore of Aplysia punctata. Front Zool. 2006;3:6. doi: 10.1186/1742-9994-3-6. [DOI] [PMC free article] [PubMed] [Google Scholar]
- 12.Galizia CG, Sachse S, Rappert A, Menzel R. The glomerular code for odor representation is species specific in the honeybee Apis mellifera. Nat Neurosci. 1999;2:473–8. doi: 10.1038/8144. [DOI] [PubMed] [Google Scholar]
- 13.Wang JW, Wong AM, Flores J, Vosshall LB, Axel R. Two-photon calcium imaging reveals an odor-evoked map of activity in the fly brain. Cell. 2003;112:271–82. doi: 10.1016/s0092-8674(03)00004-7. [DOI] [PubMed] [Google Scholar]
- 14.Bobkov YV, Ache BW. Pharmacological properties and functional role of a TRP-related ion channel in lobster olfactory receptor neurons. J Neurophysiol. 2005;93:1372–80. doi: 10.1152/jn.00990.2004. [DOI] [PubMed] [Google Scholar]
- 15.Grynkiewicz G, Poenie M, Tsien RY. A new generation of Ca2+ indicators with greatly improved fluorescence properties. J Biol Chem. 1985;260:3440–50. [PubMed] [Google Scholar]
- 16.Ukhanov KY, Flores TM, Hsiao HS, Mohapatra P, Pitts CH, Payne R. Measurement of cytosolic Ca2+ concentration in Limulus ventral photoreceptors using fluorescent dyes. J Gen Physiol. 1995;105:95–116. doi: 10.1085/jgp.105.1.95. [DOI] [PMC free article] [PubMed] [Google Scholar]
- 17.Laverack MS. Antennular Sense Organs of Panulirus Argus. Comparative Biochemistry and Physiology. 1964;13:301. doi: 10.1016/0010-406x(64)90026-x. [DOI] [PubMed] [Google Scholar]
- 18.Lattanzio FA, Jr, Bartschat DK. The effect of pH on rate constants, ion selectivity and thermodynamic properties of fluorescent calcium and magnesium indicators. Biochem Biophys Res Commun. 1991;177:184–91. doi: 10.1016/0006-291x(91)91966-g. [DOI] [PubMed] [Google Scholar]
- 19.Bancel F, Salmon JM, Vigo J, Vo-Dinh T, Viallet P. Investigation of noncalcium interactions of fura-2 by classical and synchronous fluorescence spectroscopy. Anal Biochem. 1992;204:231–8. doi: 10.1016/0003-2697(92)90232-v. [DOI] [PubMed] [Google Scholar]
- 20.Schild D, Restrepo D. Transduction mechanisms in vertebrate olfactory receptor cells. Physiol Rev. 1998;78:429–66. doi: 10.1152/physrev.1998.78.2.429. [DOI] [PubMed] [Google Scholar]
- 21.McClintock TS, Ache BW. Ionic currents and ion channels of lobster olfactory receptor neurons. J Gen Physiol. 1989;94:1085–99. doi: 10.1085/jgp.94.6.1085. [DOI] [PMC free article] [PubMed] [Google Scholar]
- 22.Piper DR, Lucero MT. Calcium signalling in squid olfactory receptor neurons. Biol Signals Recept. 1999;8:329–37. doi: 10.1159/000014606. [DOI] [PubMed] [Google Scholar]
- 23.Berridge MJ. Inositol trisphosphate and calcium signalling. Nature. 1993;361:315–25. doi: 10.1038/361315a0. [DOI] [PubMed] [Google Scholar]
- 24.Benech JC, Lima PA, Sotelo JR, Brown ER. Ca(2+) dynamics in synaptosomes isolated from the squid optic lobe. J Neurosci Res. 2000;62:840–6. doi: 10.1002/1097-4547(20001215)62:6<840::AID-JNR11>3.0.CO;2-8. [DOI] [PubMed] [Google Scholar]
- 25.Fadool DA, Ache BW. Plasma membrane inositol 1,4,5-trisphosphate-activated channels mediate signal transduction in lobster olfactory receptor neurons. Neuron. 1992;9:907–18. doi: 10.1016/0896-6273(92)90243-7. [DOI] [PMC free article] [PubMed] [Google Scholar]
- 26.Grunert U, Ache BW. Ultrastructure of the Aesthetasc (Olfactory) Sensilla of the Spiny Lobster, Panulirus-Argus. Cell and Tissue Research. 1988;251:95–103. [Google Scholar]
- 27.Michel WC, McClintock TS, Ache BW. Inhibition of lobster olfactory receptor cells by an odor-activated potassium conductance. J Neurophysiol. 1991;65:446–53. doi: 10.1152/jn.1991.65.3.446. [DOI] [PubMed] [Google Scholar]
- 28.Rawson NE, Gomez G, Cowart B, Brand JG, Lowry LD, Pribitkin EA, Restrepo D. Selectivity and response characteristics of human olfactory neurons. J Neurophysiol. 1997;77:1606–13. doi: 10.1152/jn.1997.77.3.1606. [DOI] [PubMed] [Google Scholar]
- 29.Restrepo D, Boyle AG. Stimulation of olfactory receptors alters regulation of [Cai] in olfactory neurons of the catfish (Ictalurus punctatus) J Membr Biol. 1991;120:223–32. doi: 10.1007/BF01868533. [DOI] [PubMed] [Google Scholar]
- 30.Smetters D, Majewska A, Yuste R. Detecting action potentials in neuronal populations with calcium imaging. Methods. 1999;18:215–21. doi: 10.1006/meth.1999.0774. [DOI] [PubMed] [Google Scholar]
- 31.Helmchen F, Imoto K, Sakmann B. Ca2+ buffering and action potential-evoked Ca2+ signaling in dendrites of pyramidal neurons. Biophys J. 1996;70:1069–81. doi: 10.1016/S0006-3495(96)79653-4. [DOI] [PMC free article] [PubMed] [Google Scholar]
- 32.Khoutorsky A, Spira ME. Calpain inhibitors alter the excitable membrane properties of cultured aplysia neurons. J Neurophysiol. 2008;100:2784–93. doi: 10.1152/jn.90487.2008. [DOI] [PubMed] [Google Scholar]
- 33.Lutcke H, Murayama M, Hahn T, Margolis DJ, Astori S, Zum Alten Borgloh SM, Gobel W, Yang Y, Tang W, Kugler S, Sprengel R, Nagai T, Miyawaki A, Larkum ME, Helmchen F, Hasan MT. Optical recording of neuronal activity with a genetically-encoded calcium indicator in anesthetized and freely moving mice. Front Neural Circuits. 2010;4:9. doi: 10.3389/fncir.2010.00009. [DOI] [PMC free article] [PubMed] [Google Scholar]
- 34.Gleeson RA, Aldrich HC, White JF, Trapidorosenthal HG, Carr WES. Ionic and Elemental Analyses of Olfactory Sensillar Lymph in the Spiny Lobster, Panulirus-Argus. Comparative Biochemistry and Physiology a-Physiology. 1993;105:29–34. [Google Scholar]
- 35.O'Day PM, Gray-Keller MP. Evidence for electrogenic Na+/Ca2+ exchange in Limulus ventral photoreceptors. J Gen Physiol. 1989;93:473–94. doi: 10.1085/jgp.93.3.473. [DOI] [PMC free article] [PubMed] [Google Scholar]
- 36.Knox RJ, Jonas EA, Kao LS, Smith PJ, Connor JA, Kaczmarek LK. Ca2+ influx and activation of a cation current are coupled to intracellular Ca2+ release in peptidergic neurons of Aplysia californica. J Physiol. 1996;494 ( Pt 3):627–39. doi: 10.1113/jphysiol.1996.sp021520. [DOI] [PMC free article] [PubMed] [Google Scholar]
- 37.Lischka FW, Schild D. Standing calcium gradients in olfactory receptor neurons can be abolished by amiloride or ruthenium red. J Gen Physiol. 1993;102:817–31. doi: 10.1085/jgp.102.5.817. [DOI] [PMC free article] [PubMed] [Google Scholar]
- 38.Kaupp UB. Olfactory signalling in vertebrates and insects: differences and commonalities. Nat Rev Neurosci. 2010;11:188–200. doi: 10.1038/nrn2789. [DOI] [PubMed] [Google Scholar]
- 39.Danaceau JP, Lucero MT. Electrogenic Na(+)/Ca(2+) exchange. A novel amplification step in squid olfactory transduction. J Gen Physiol. 2000;115:759–68. doi: 10.1085/jgp.115.6.759. [DOI] [PMC free article] [PubMed] [Google Scholar]
- 40.Noe J, Tareilus E, Boekhoff I, Breer H. Sodium/calcium exchanger in rat olfactory neurons. Neurochem Int. 1997;30:523–31. doi: 10.1016/s0197-0186(96)00090-3. [DOI] [PubMed] [Google Scholar]
- 41.Reisert J, Matthews HR. Na+-dependent Ca2+ extrusion governs response recovery in frog olfactory receptor cells. J Gen Physiol. 1998;112:529–35. doi: 10.1085/jgp.112.5.529. [DOI] [PMC free article] [PubMed] [Google Scholar]
- 42.Sumbre G, Muto A, Baier H, Poo MM. Entrained rhythmic activities of neuronal ensembles as perceptual memory of time interval. Nature. 2008;456:102–6. doi: 10.1038/nature07351. [DOI] [PMC free article] [PubMed] [Google Scholar]
- 43.Yaksi E, Friedrich RW. Reconstruction of firing rate changes across neuronal populations by temporally deconvolved Ca2+ imaging. Nat Methods. 2006;3:377–83. doi: 10.1038/nmeth874. [DOI] [PubMed] [Google Scholar]
Associated Data
This section collects any data citations, data availability statements, or supplementary materials included in this article.