Abstract
All-trans retinoic acid protects against the development of HIV-associated nephropathy (HIVAN) in HIV-1 transgenic mice (Tg26). In vitro, all-trans retinoic acid inhibits HIV-induced podocyte proliferation and restores podocyte differentiation markers by activating its receptor-α (RARα). Here, we report that Am580, a water-soluble RARα-specific agonist, attenuated proteinuria, glomerosclerosis, and podocyte proliferation, and restored podocyte differentiation markers in kidneys of Tg26 mice. Furthermore, RARα−/− Tg26 mice developed more severe kidney and podocyte injury than did RARα+/− Tg26 mice. Am580 failed to ameliorate kidney injury in RARα−/− Tg26 mice, confirming our hypothesis that Am580 acts through RARα. Although the expression of RARα-target genes was suppressed in the kidneys of Tg26 mice and of patients with HIVAN, the expression of RARα in the kidney was not different between patients with HIVAN and minimal change disease. However, the tissue levels of retinoic acid were reduced in the kidney cortex and isolated glomeruli of Tg26 mice. Consistent with this, the expression of two key enzymes in the retinoic acid synthetic pathway, retinol dehydrogenase type 1 and 9, and the overall enzymatic activity for retinoic acid synthesis were significantly reduced in the glomeruli of Tg26 mice. Thus, a defect in the endogenous synthesis of retinoic acid contributes to loss of the protection by retinoic acid in HIVAN. Hence, RARα agonists may be potential agents for the treatment of HIVAN.
Keywords: HIV, kidney disease, podocytes, proteinuria, retinoic acid receptor
Retinoic acids (RAs) are metabolites of vitamin A that have multiple cellular functions including inhibition of proliferation, induction of cell differentiation, regulation of apoptosis, and inhibition of inflammation.1 Vitamin A (retinol) is converted into retinal by retinol dehydrogenases (RDHs), and retinal is converted into RA by retinal dehydrogenases.2 RA concentration is also regulated by catabolism via Cyp26.3 The kidney is a major organ of RA synthesis.4,5 During kidney development, RA affects tubulogenesis and nephron number.6 In addition to its established benefits for the treatment of acute promyelocytic leukemia, RA has been found to provide protection in multiple experimental models of kidney disease including mesangioproliferative glomerulonephritis, puromycin-induced nephrosis, lupus nephritis, and diabetic nephropathy.5,7–11
Human immunodeficiency virus (HIV)-associated kidney disease (HIVAN) remains a leading cause of end-stage renal disease among young African Americans.12 The unique feature of collapsing focal segmental glomerulosclerosis in HIVAN is characterized by podocyte proliferation and dedifferentiation.13–15 HIV-infected podocytes express increased levels of cyclin A, E, and D, and reduced levels of p27 and p57.15,16 Podocytes also lose differentiation markers including synaptopodin, nephrin, and Wilms tumor 1 (WT-1).13,14 Local HIV-1 infection is responsible for podocyte injury.17 Transgenic mice expressing HIV-1 genes in podocytes develop a kidney disease identical to HIVAN.18,19 HIV infection of cultured podocytes causes proliferation and dedifferentiation via Nef-induced Src–Stat3 (signal transducer and activator of transcription 3) and MAPK (mitogen-activated protein kinase) 1 and 2 pathways.20 Although a combination antiretroviral regimen improves patient survival and ameliorates kidney disease,21 additional treatments for HIVAN are still lacking, particularly for patients who do not respond to antiretroviral treatment.
Recently, we found that all-trans retinoic acid (ATRA) reduces proteinuria and glomerulosclerosis in the HIV-1 transgenic mouse, Tg26, which is the most robust animal model of human HIVAN.22 We also found that ATRA inhibits HIV-induced cell proliferation and restores differentiation markers in HIV-infected podocytes through activation of cyclic adenosine monophosphate production.22 ATRA also inhibits MAPK phosphorylation through activation of MKP1 (MAPK phosphatase 1) in podocytes.23 In addition, we find that Am580, a specific retinoic acid receptor-α (RARα) agonist, stimulates cyclic adenosine monophosphate production, inhibits HIV-induced podocyte proliferation, and promotes podocyte differentiation in vitro, similar to what we had observed with ATRA.22 Furthermore, the effects of ATRA on podocytes are reduced by a specific RARα antagonist (Ro-41-5253). These data suggest that RARα is required for the antiproliferative and differentiation effects of ATRA on HIV-infected podocytes.
As both the animal and in vitro studies strongly suggest a beneficial role of ATRA in kidney disease, a phase II clinical study has been approved for the use of ATRA to treat patients with steroid-resistant minimal change disease, focal segmental glomerulosclerosis, and HIVAN (ClinicalTrials.gov Identifier NCT00098020). ATRA has a significant side-effect profile in patients.24 Previous studies suggest that the side effects of RA are mediated mostly through RARγ. Am580, a specific RARα agonist, causes less side effects than ATRA.25,26 In this study, we found that Am580 protects Tg26 against renal injury, similar to ATRA. Using RARα knockout mice we determined that the Am580 acts through a RARα-dependent pathway to confer protection against podocyte injury and kidney disease. Tissue levels of RA and the expressions of key enzymes in the RA synthetic pathway (RDH1 and RDH9) are reduced in the kidneys of Tg26, suggesting that HIV-associated reduction in RA synthesis contributes to the development of HIVAN.
RESULTS
Am580 reduced proteinuria and glomerulosclerosis in Tg26
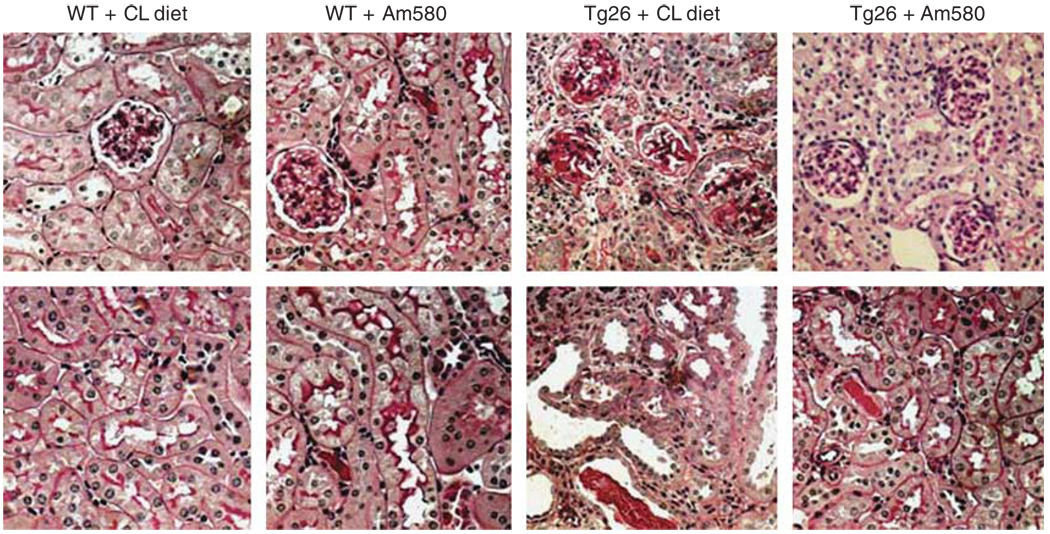
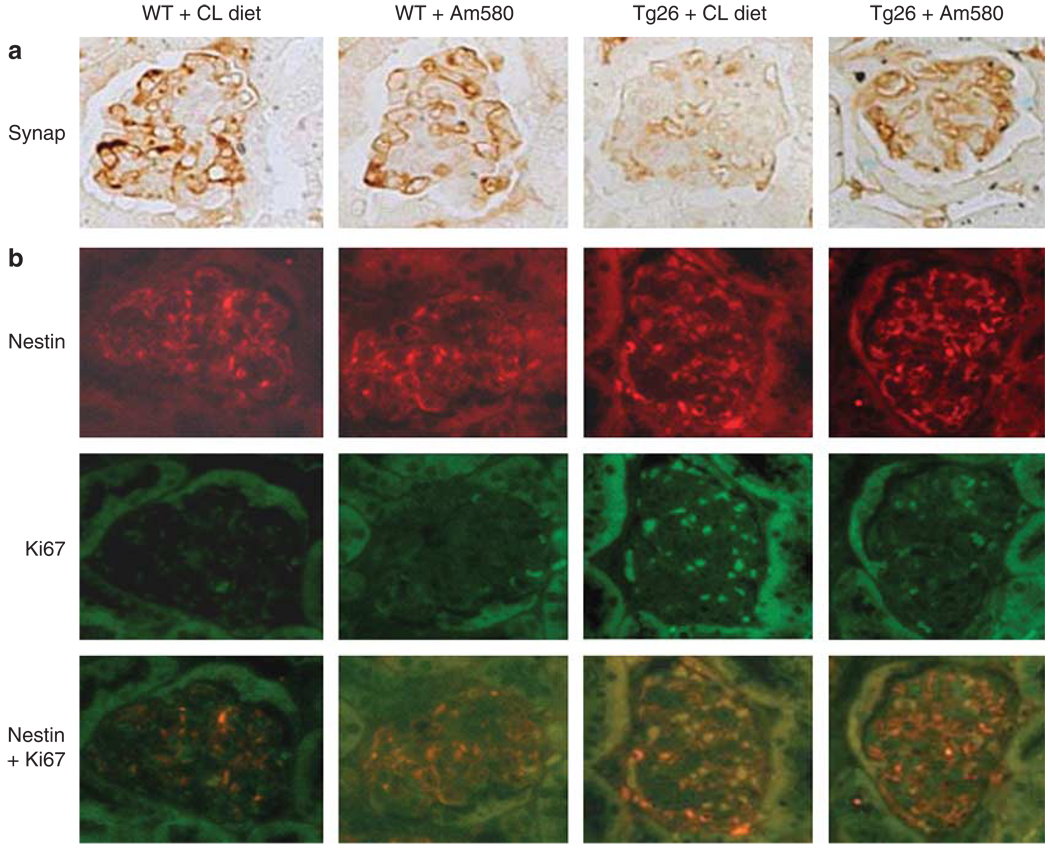
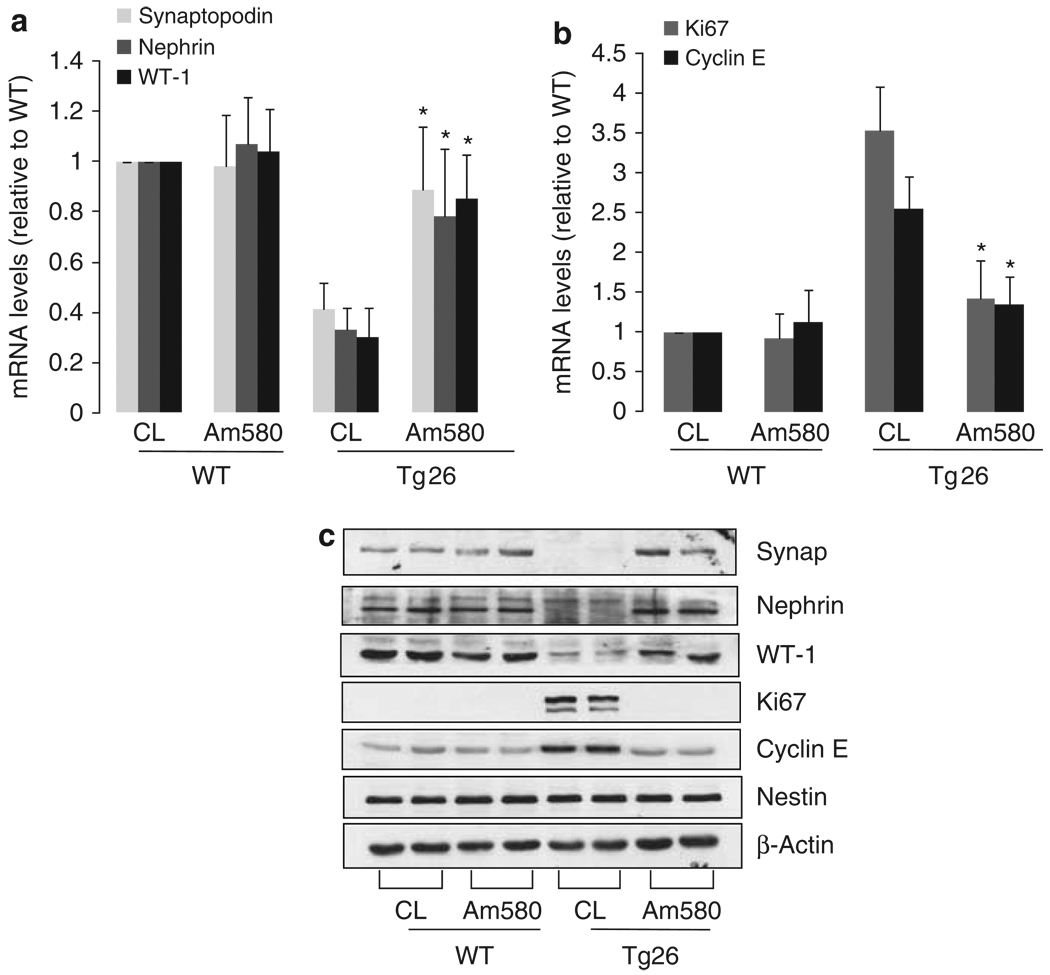
As our previous study suggests that RARα has a key role in mediating the protective effects of RA on podocytes,22 we wanted to determine whether Am580, a specific agonist for RARα, improves kidney disease similar to what we had observed with ATRA. Both Tg26 and their littermates (n = 20) were treated daily with Am580-containing chow (0.3 mg/kg/day) or control chow (prepared similarly without Am580) from the age of 4 weeks, and were killed at the age of 12 weeks. We found that Am580 prevented kidney hypertrophy and preserved renal function in Tg26 compared with mice treated with the control chow (Table 1). Also, Am580 significantly diminished proteinuria and improved glomerulosclerosis, podocyte hypertrophy, and tubular injury in Tg26 compared with the mice treated with the control chow (Table 2 and Figure 1). Our previous in vitro studies suggest that ATRA inhibits cell proliferation and restores differentiation in HIV-infected podocytes through activation of RARα.22 Therefore, we used orally administered Am580 to determine if a RARα agonist would have a similar effect on the renal phenotype in vivo. By immunostaining, we found that Am580 restored the expression of synaptopodin, a podocyte differentiation marker, in the kidneys of Tg26 (Figure 2a). By co-immunostaining for both Ki67 and nestin, we found that Am580 also inhibited HIV-induced podocyte proliferation (Figure 2b). Nestin was used for podocyte colocalization because studies by others and our group have shown that the expression of nestin is preserved in diseased kidneys.27,28 To further confirm these findings, we examined the mRNA levels for synaptopodin, nephrin,WT-1, Ki67, and cyclin E in glomeruli isolated from these mice by real-time PCR. We found that expression of podocyte differentiation markers were preserved in glomeruli isolated from Tg26 that received Am580 (Figure 3a). Also, proliferation markers including Ki67 and cyclin E were suppressed in glomeruli isolated from Tg26 that received Am580 (Figure 3b). Changes in markers of podocyte differentiation and proliferation were also confirmed by western blot analysis (Figure 3c). These findings suggest that Am580 prevents podocyte injury in vivo similar to what we observed previously in vitro using ATRA.22
Table 1.
Am580 prevents kidney hypertrophy and improves renal function in Tg26
| BW (g) | KW (mg) | KW/BW (mg/g) | BUN | Urine Pro/Cr ratio | |
|---|---|---|---|---|---|
| WT+control diet | 25.3±4.0 | 222±51 | 8.7±1.3 | 0.21±2.32 | 0.15±0.12 |
| WT+Am580 | 24.8±3.7 | 220±43 | 8.8±1.4 | 0.22±1.89 | 0.18±0.61 |
| Tg26+control diet | 25.4±4.2 | 235±46 | 9.3±1.0 | 0.76±1.67 | 32.4±6.5 |
| Tg26+Am580 | 25.1±3.4 | 225±63* | 8.8±1.6* | 0.25±0.22* | 3.5±1.5* |
Abbreviations: BUN, blood urea nitrogen; BW, body weight; Cr, creatinine; KW, kidney weight; Pro, protein; WT, wild type.
Tg26 and WT littermates were treated with either control diet or Am580 for a total of 8 weeks as described in the Materials and Methods. When mice were killed at the age of 12 weeks, BW and KW were recorded and their ratio (KW/BW) was calculated. BUN and urinary protein and creatinine levels were measured. Urine Pro/Cr ratio was calculated, n=20.
P<0.01 compared with Tg26+control diet group.
Table 2.
Am580 improves kidney injury in Tg26
| GS index |
Podocyte hypertrophy |
Tubular casts/cysts |
|
|---|---|---|---|
| WT+control diet | 0 | 0 | 0 |
| WT+Am580 | 0 | 0 | 0 |
| Tg26+control diet | 19.5±3.2 | 1.9±0.9 | 10.2±2.5 |
| Tg26+Am580 | 2.7±1.1* | 0* | 1.5±1.2* |
Kidney histological analysis was performed in wild type (WT) and Tg26 treated with either control diet or Am580. Glomerulosclerosis (GS) index, podocyte hypertrophy, and tubular casts/cysts were quantified as described in the Materials and Methods, n=20.
P<0.001 compared with Tg26+control diet.
Figure 1. Kidney histology.
Wild-type (WT) and Tg26 mice were treated with either vehicle or Am580 as described in the Materials and Methods. The representative pictures of kidney histology (hematoxylin and eosin (H&E) staining) of these mice are shown. Top and bottom panels are representative fields showing glomerular and tubulointerstitial area, respectively (original magnification × 200).
Figure 2. Immunostaining.
Kidney sections from mice treated with either vehicle or Am580 were used for immunohistochemistry of (a) synaptopodin (Synap), a podocyte differentiation marker, and for (b) immunofluorescence of Nestin and Ki67. Nestin is a podocyte-specific marker. Ki67 is a marker for proliferating cells. The representative pictures are shown (n = 5).
Figure 3. Real-time PCR.
Glomeruli were isolated from mice treated with either control vehicle (CL) or Am580 as described. Total RNA was isolated from these glomeruli for real-time PCR analysis of genes associated with (a) podocyte differentiation (synaptopodin, nephrin, and WT-1) and (b) podocyte proliferation (Ki67 and cyclin E). The ratio of tested genes to tubulin expression was calculated. The ratio of treated mice to control wild type (WT) is shown, n = 10, *P<0.01. (c) Protein lysates from these glomeruli were used for western blot analysis for the above podocyte differentiation and proliferation markers. The representative blots of at least three independent experiments are shown.
Knockout of RARα in Tg26 aggravated proteinuria, glomerulosclerosis, and podocyte injury
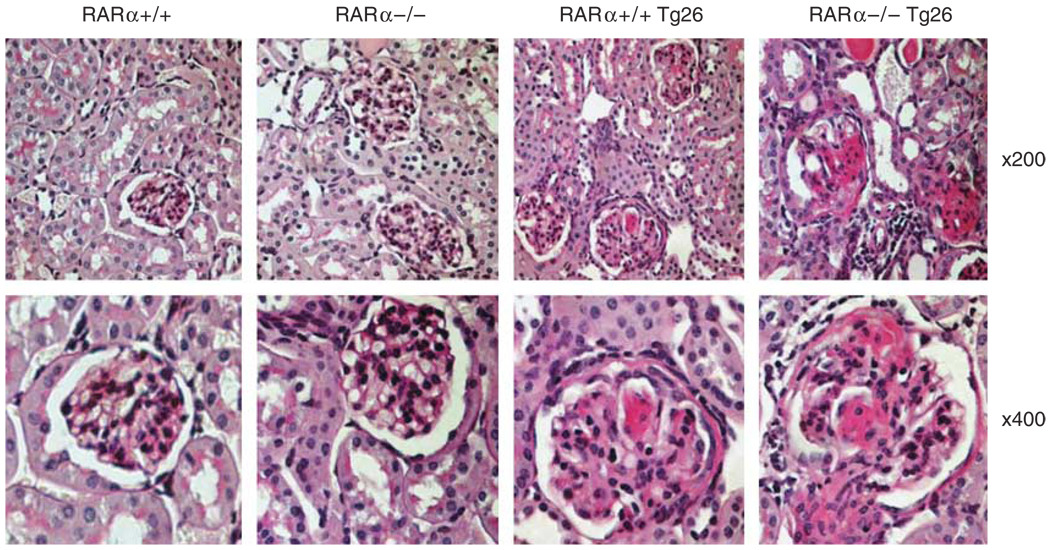
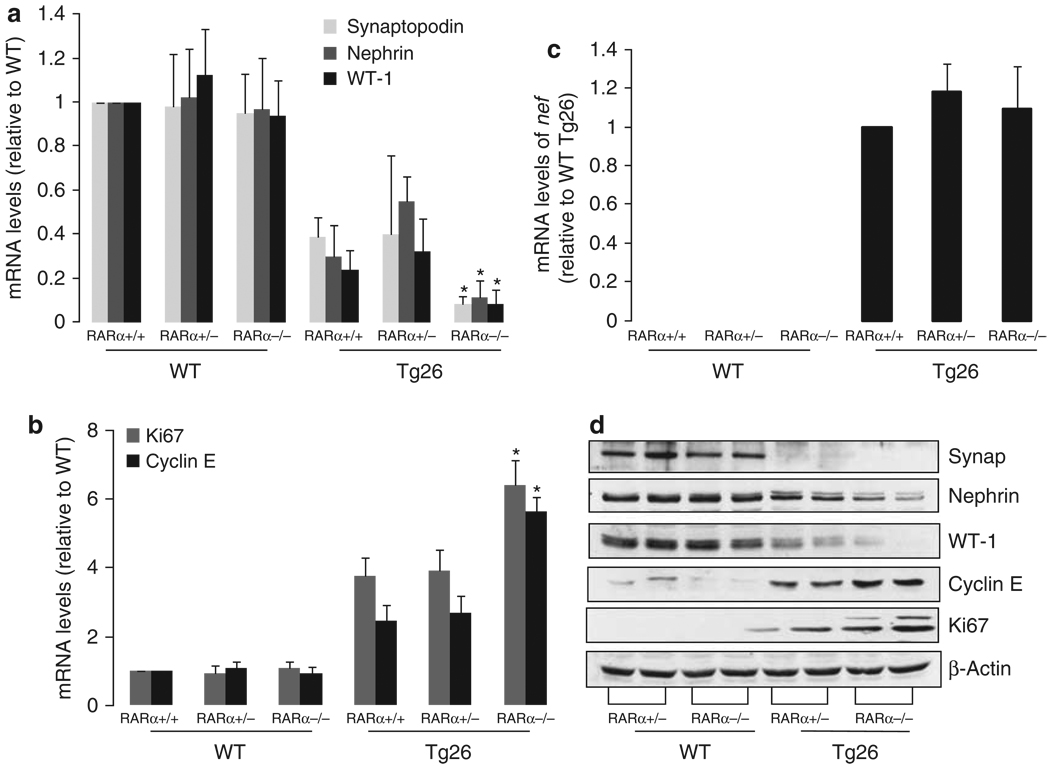
To further assess the critical role of RARα in HIVAN, we hypothesized that knockout of RARα in the Tg26 background would aggravate kidney injury. RARα−/− mice were crossed with Tg26 as described in the Materials and Methods to generate RARα+/+ Tg26, RARα+/− Tg26, RARα−/− Tg26, and their littermates (wild type (WT)) as controls. Mice from the same litter were used for comparison. We found that RARα−/− mice developed more severe proteinuria and kidney damage compared with RARα+/− Tg26 and RARα+/+ Tg26 (Table 3 and Figure 4). By real-time PCR, we found that the expression of podocyte differentiation markers was further suppressed in glomeruli isolated from RARα−/− Tg26 mice compared with RARα+/+ Tg26 and RARα+/− Tg26 (Figure 5a). The expression of proliferation markers (Ki67 and cyclin E) was further increased in glomeruli isolated from RARα−/− Tg26 compared with RARα+/− and RARα−/− mice (Figure 5b). These changes could also be the result of differences in the expression of the HIV transgene. To eliminate this possibility, we measured the expression of nef, one of the important regulatory genes in the pNL4-3 deletion mutant used to generate the transgenic mice. We found that the expression of HIV-1 nef was not different among RARα−/− Tg26, RARα+/+ Tg26, and RARα+/− Tg26 mice (Figure 5c). In addition, the changes in the expression of markers of podocyte proliferation and differentiation were confirmed at protein levels by western blot (Figure 5d). Taken together, these data suggest that knockout of RARα caused more severe podocyte injury and kidney damage in Tg26, and RARα likely acts as an endogenous protective pathway to prevent the development and the progression of kidney disease.
Table 3.
Knockout of RARα aggravates kidney injury in Tg26
| Urine Pro/Cr ratio |
GS index |
Podocyte hypertrophy |
Tubular casts/cysts |
|
|---|---|---|---|---|
| RARα+/+ | 0.12±0.10 | 0 | 0 | 0 |
| RARα+/+ Tg26 | 33.4±15.6 | 18.5±11.1 | 1.2±0.8 | 9.4±5.6 |
| RARα+/− | 0.21±0.22 | 0 | 0 | 0 |
| RARα+/− Tg26 | 35.1±19.5 | 21.7±7.8 | 1.3±0.5 | 8.4±3.9 |
| RARα−/− | 0.29±0.32 | 0 | 0 | 0 |
| RARα−/− Tg26 | 140±89* | 45.5±22.9* | 2.3±0.8* | 23.9±14.5* |
Abbreviations: Cr, creatinine; GS, glomerulosclerosis; Pro, protein; RAR, retinoic acid receptor.
A comparison of proteinuria (urine Pro/Cr ratio), GS index, podocyte hypertrophy, and tubular casts/cysts was performed between RARα+/+, RARα+/+ Tg26, RARα+/−, RARα+/− Tg26, RARα−/−, and RARα−/− Tg26 mice, n=20.
P<0.001 compared with the Tg26 group.
Figure 4. Kidney histology.
RARα+/+, RARα−/−, RARα+/+ Tg26, and RARα−/− Tg26 mice were killed at the age of 12 weeks for histology analysis. The representative fields of hematoxylin and eosin (H&E) staining are shown. Original magnification (top panel) × 200; (low panel) × 400.
Figure 5. Real-time PCR.
Glomeruli were isolated from RARα+/+, RARα−/−, RARα+/+ Tg26, and RARα−/− Tg26 mice at 12 weeks of age. Total RNA was isolated from glomeruli for real-time PCR analysis of genes indicative of (a) podocyte differentiation (synaptopodin, nephrin, and WT-1) and (b) proliferation (Ki67 and cyclin E). The ratio of tested genes to tubulin gene was calculated. The ratio of treated mice to wild type (WT) was shown, n = 10, *P<0.01. (c) Real-time PCR was also performed to verify the expression of HIV-1 nef gene in the glomeruli of these mice. (d) Glomerular lysates were used for western blot analysis of the above podocyte differentiation and proliferation markers. The representative blots of at least three independent experiments are shown.
Am580 failed to improve proteinuria and glomerulosclerosis in Tg26
Next, to establish whether the beneficial effect of Am580 is mediated through agonism of RARα, we evaluated the impact of Am580 on the development of kidney disease in Tg26 mice lacking RARα. RARα−/− Tg26, RARα+/− Tg26, and RARα+/+ Tg26 mice were fed with Am580 or control diet from 4 weeks of age and killed at 12 weeks of age as described in the Materials and Methods. We found that whereas Am580 significantly reduced proteinuria and kidney damage in RARα+/+ Tg26 and RARα+/− Tg26, it failed to improve proteinuria, glomerulosclerosis, and tubular injury in RARα−/− Tg26 (Table 4). These data further confirm a critical role of RARα in mediating the protective effects of Am580 in Tg26.
Table 4.
Am580 failed to improve kidney disease in RARα−/− Tg26
| Urine Pro/Cr ratio |
GS index |
Podocyte hypertrophy |
Tubular casts/cysts |
|
|---|---|---|---|---|
| RARα+/+ Tg26 control diet | 31.2±7.3 | 16.5±3.1 | 1.2±0.8 | 9.4±5.6 |
| RARα+/+ Tg26 Am580 | 2.6±1.6* | 1.7±1.4* | 0* | 2.5±1.4* |
| RARα+/− Tg26 control diet | 33.1±10.5 | 12.7±7.4 | 1.3±0.5 | 6.9±1.3 |
| RARα +/− Tg26 Am 580 | 3.4.1±1.5* | 1.9±1.2* | 0* | 1.9±0.9* |
| RARα−/− Tg26 control diet | 123.2±22.3 | 41.2±12.3 | 3.5±1.2 | 21.6±7.2 |
| RARα−/− Tg26 Am580 | 110±11.2 | 38.3±9.2 | 3.3±0.9 | 19.7±6.4 |
Abbreviations: Cr, creatinine; GS, glomerulosclerosis; Pro, protein; RAR, retinoic acid receptor.
RARα+/+ Tg26, RARα+/− Tg26, and RARα−/− Tg26 mice were treated with either control diet or Am580 from 4 to 12 weeks of age. Then, mice were killed for analysis of proteinuria and histology as summarized here, n=20.
P<0.001 compared with RARα+/+ Tg26 control diet.
Expression of RARα and RARβ in kidneys of Tg26 mice and patients with HIVAN
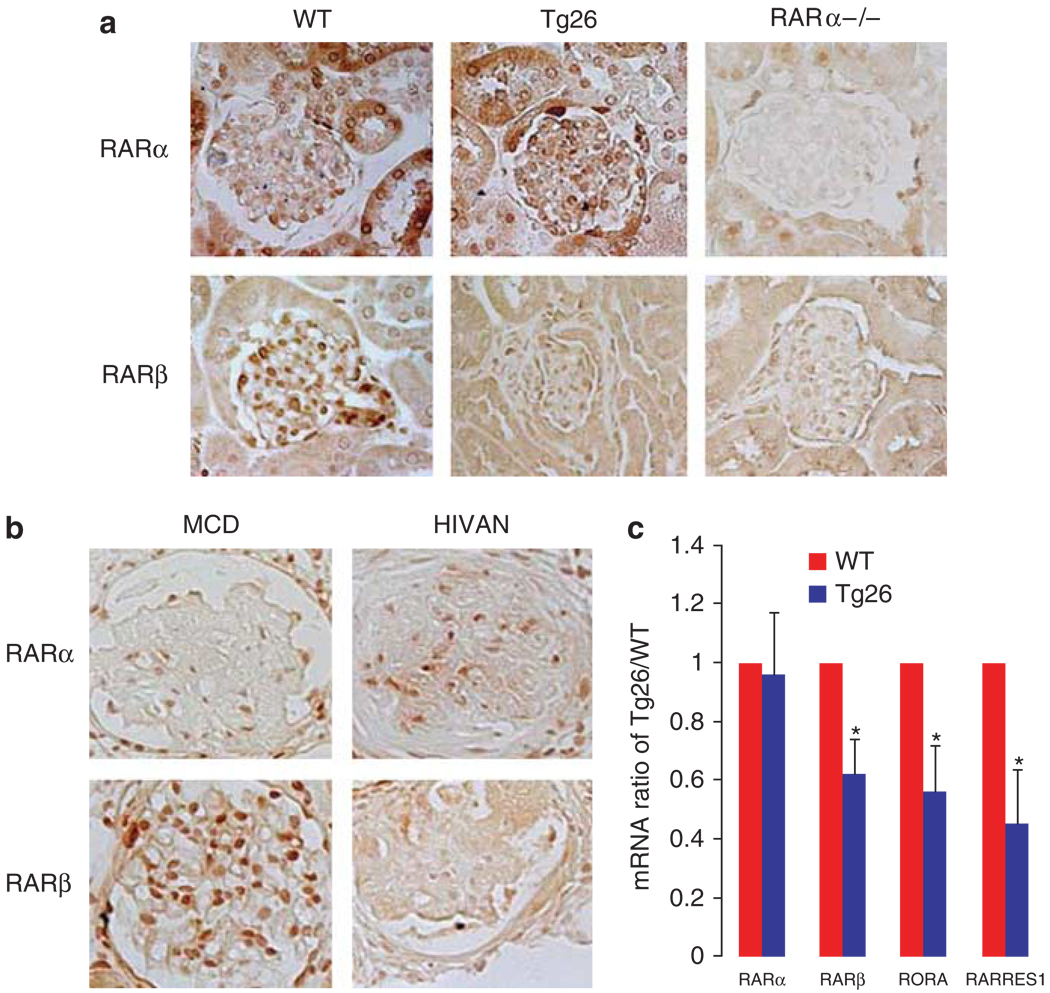
As our studies suggest a critical role of RARα in mediating the protective effects of retinoids in the HIVAN model, we speculated that the basal expression of RARα between Tg26 and WT kidneys could be different. However, the expression of RARα was not different between Tg26 and WT kidneys by immunostaining (Figure 6a). Kidneys from RARα−/− mice were used as the negative control. In contrast, the expression of RARβ, which is a target gene of RARα, was significantly downregulated in kidneys of Tg26 and in kidneys of RARα−/− mice (Figure 6a). Similarly, the expression of RARα was not different between kidneys from patients with HIVAN and patients with minimal change disease, and the expression of RARβ was significantly downregulated in kidneys from patients with HIVAN (Figure 6b). These findings were confirmed by real-time PCR showing that mRNA levels of RARα were not different between Tg26 and WT kidneys, whereas RARα expression was suppressed in Tg26 kidneys (Figure 6c). Furthermore, we found that RARRES1 (retinoic acid receptor responder protein 1) and RORA (retinoid-related orphan receptor-α) were also significantly reduced in glomeruli of Tg26 (Figure 6c).
Figure 6. Immunostaining for retinoic acid receptor (RAR)α and RARβ.
(a) Immunostaining was performed in kidneys of wild-type (WT), Tg26, and RARα−/− mice using anti-RARα and anti-RARα antibodies (Santa Cruz Biotechnology). (b) Immunostaining was also performed in kidneys from patients with human immunodeficiency virus (HIV)-associated kidney disease (HIVAN) and with minimal change disease (MCD) using anti-human RARα and RARβ antibodies (Santa Cruz Biotechnology). The representative pictures are shown here (n = 5). (c) Total RNA was isolated from glomeruli of Tg26 and WT littermates. Real-time PCR was performed for RARα, RARβ, RORA (retinoid-related orphan receptor-α), and RARRES1 (retinoic acid receptor responder protein 1). Fold change of gene expression in Tg26 relative to WT is shown here. *P<0.01, n = 10.
Retinoid synthesis in Tg26 kidneys
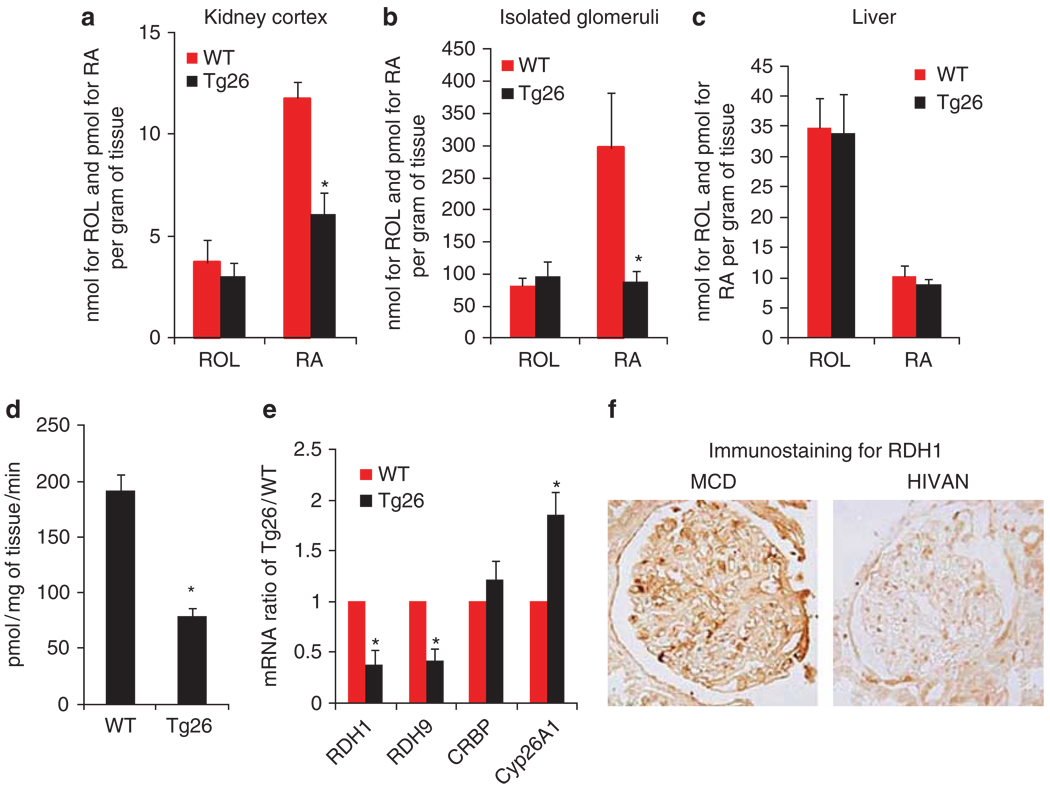
We were surprised to find that RARα expression was not different in Tg26 kidneys, and hence we hypothesized that endogenous RA synthesis might be impaired instead. We measured kidney tissue levels of retinol and RA and found that whereas retinol was not different in kidney cortices between WT and Tg26 mice, RA levels were significantly reduced in Tg26 kidneys compared with WT kidneys (Figure 7a). As we are interested in RA synthesis in podocytes, we also measured retinol and RA levels in isolated glomeruli. Similar to the level of RA in kidney cortices, RA expression is suppressed in isolated glomeruli of Tg26 compared with WT mice, whereas retinol levels did not differ between these animals (Figure 7b). The suppression of RA in isolated glomeruli was more pronounced than in kidney cortices. Interestingly, the amount of RA per gram of tissue was much higher in isolated glomeruli than in kidney cortices. To determine whether the reduction of RA synthesis in Tg26 was tissue specific, we also compared the levels of retinol and RA in the liver of Tg26 and WT mice. We found that both retinol and RA levels were similar in the liver of WT and Tg26 mice (Figure 7c). This suggests that the impairment of RA synthesis in kidneys of Tg26 is tissue specific. In addition, we determined the rate of RA synthesis in isolated glomeruli by measuring the conversion rate of retinol to RA in the presence of glomerular lysates from either Tg26 or WT mice. We confirmed that glomerular lysates of Tg26, when compared with lysates of WT, had a reduced rate of retinol to RA conversion, which suggests that synthesis of RA is lower in Tg26 (Figure 7d). To further investigate which enzyme(s) involved in the synthesis of RA is responsible for the lower RA level in Tg26 glomeruli, we analyzed the expression of genes responsible for RA metabolism. We performed gene expression microarray analysis on glomeruli isolated from Tg26 and WT kidneys and generated an expression profile of genes related to retinoid metabolism. We found that two key enzymes of RA synthesis, RDH1 and RDH9, were significantly downregulated in the kidneys of Tg26, whereas there was a significant increase in the expression of Cyp26A1, which is an enzyme responsible for the degradation of RA. These findings were further confirmed by real-time PCR (Figure 7e). Using immunostaining, we confirmed that RDH1 expression is also suppressed in the kidney of patients with HIVAN (Figure 7f). The expression of cellular retinol binding protein was not different between Tg26 and WT mice (Figure 7e). The expression of other enzymes in the RA synthesis pathway, including retinal dehydrogenase 1, 2, and 4, was not suppressed in Tg26 glomeruli (data not shown). Using real-time PCR, we confirmed that there was no difference in the mRNA level of RDH1, RDH9, and Cyp26A1 in the liver of Tg26 and WT mice (data not shown). Taken together, these data indicate that endogenous synthesis of RA is likely impaired in diseased kidneys, leading to the loss of endogenous protective effects of RAs.
Figure 7. Tissue levels of retinoids.
Retinol (ROL) and retinoic acid (RA) levels were measured in (a) kidneys cortices, (b) isolated glomeruli, and (c) livers of Tg26 and wild-type (WT) mice as described in the Materials and Methods (n = 5, *P<0.01). (d) The enzymatic activity of RA synthesis was also determined in isolated glomeruli by measuring the conversion of retinol to RA, n = 5, *P<0.001. (e) Total RNA was isolated from glomeruli of Tg26 and WT littermates. Real-time PCR were performed for retinol dehydrogenase (RDH)1, RDH9, and Cyp26A1. Fold change of gene expression in Tg26 relative to WT is shown here, *P<0.01, n = 10. (f) Immunostaining of RDH1 was performed in kidneys from patients with human immunodeficiency virus (HIV)-associated kidney disease (HIVAN) and minimal change disease (MCD). The representative pictures of five individual patients are shown here.
DISCUSSION
Although the incidence of HIVAN decreased in the highly active antiretroviral therapy era, its prevalence is increasing because of the aging of patients.21,29 Furthermore, highly active antiretroviral therapy is only partially protective and many patients with HIVAN ultimately progress to end-stage renal disease.30 HIVAN remains the leading cause of end-stage renal disease among young African Americans12 on highly active antiretroviral therapy. Therefore, it is of paramount importance to identify additional treatment options for patients with HIVAN.
A large amount of evidence suggests that RA ameliorates kidney injury in many animal models of kidney disease including HIVAN. Unfortunately, treatment strategies using RA are limited because of significant side effects from ATRA. Our current study suggests that Am580, a RARα agonist, improves kidney disease in an animal model of HIVAN (Tg26) similar to ATRA. Am580 can be given orally. It has significantly less side effects than ATRA because it targets only RARα. In addition, it is believed that the side effects of ATRA are mediated mostly by RARγ.26 Our data suggest that Am580 could be a potentially important drug in the treatment of patients with HIVAN without causing significant side effects. Recent studies suggest that Am580 inhibits tumor oncogenesis in animal models with mammary tumor through inhibition of proliferation and induction of differentiation of tumor cells.31 No significant side effects were reported in these animals treated with Am580.
Our studies using RARα-null mice further confirm the critical role of RARα in kidney disease. Knockout of RARα causes the loss of an endogenous protective pathway and leads to a more aggressive kidney disease. The role of RARα in kidney disease was further supported by the lack of protection by Am580 in RARα−/− Tg26 mice. These studies strongly suggest that RARα is a potential therapeutic target to treat patients with HIVAN. Further drug screening of RARα agonists should be encouraged as an alternative or adjunctive form of therapy for patients with HIVAN.
How RA improves kidney disease remains unclear. It has been shown that RA has both anti-inflammatory and antifibrosis effects.5,32 Recent studies suggest that RA can also induce podocyte differentiation and maintain nephrin expression in cultured podocytes.33 We found that ATRA inhibits HIV-induced podocyte proliferation and restores differentiation markers in HIV-infected podocytes via activation of RARα.22 Our current findings show that activation of RARα in vivo by a specific agonist protects podocytes from injury, whereas knockdown of RARα aggravates podocyte injury and disease severity. Taken together, this indicates that RARα is a key molecule mediating the protective effects of RA in podocytes.
Interestingly, we found that RARα-mediated target genes, including RARβ and RARRES1, were inhibited in kidneys of Tg26. This suggests that the RARα-mediated protection is impaired in Tg26 kidneys. However, the expression of RARα in kidneys did not differ between Tg26 and the WT littermates. The kidney is known to be a major organ for RA acid synthesis. In this study, we measured the level of retinol and RA in the renal cortex, isolated glomeruli, and liver of Tg26 and WT mice. Interestingly, we found that the level of RA was significantly suppressed in the Tg26 kidney cortex and even more suppressed in the isolated glomeruli, whereas the level of retinol remained unchanged. These findings suggest that RA synthesis is severely impaired in the glomeruli of Tg26. The level of retinol and RA in the liver was not different between Tg26 and WT. This suggests that the suppression of RA in Tg26 is likely not a generalized phenomenon. The measurement of key synthetic enzymes involved in RA metabolism in the kidney revealed that both RDH1 and RDH9 are severely suppressed in the kidneys of Tg26, whereas Cy26a, a RA acid catalytic enzyme, is increased in Tg26. Although we showed that the general enzymatic activity of RA synthesis is markedly reduced in Tg26 glomeruli, we were unable to measure the enzymatic activity of RDH1 and RDH9 because of the lack of isoform-specific antibodies. Our findings suggest that the restoration of normal RA synthesis in kidneys could be a potential therapeutic approach. The reasons for the differential regulation of RDH1, RDH9, and Cy26a in Tg26 and WT kidneys remain to be determined. Finally, Am580 might be particularly effective in treating Tg26 mice or individuals with HIVAN because Am580 is resistant to degradation by Cyp26a,34,35 which we have found to be upregulated in HIVAN.
In conclusion, our findings demonstrate that endogenous RA synthesis is impaired in diseased kidneys. RARα-mediated signaling acts as an endogenous protective pathway to slow the progression of kidney disease, and selective activation of the RARα receptor may be a promising treatment option for patients with HIV-related renal diseases.
MATERIALS AND METHODS
Generation of RARα−/− and RARα+/− Tg26 mice
RARα−/− mice were provided by Dr Pierre Chambon, (Strasbourg, France) as described.36 Derivation of a HIV-1 transgenic mouse line (Tg26) that bears a defective HIV-1 provirus lacking gag-pol (Tg26) has been described.37 Both RARα−/− and Tg26 mice are in the same FVB/N background. RARα−/− female mice were crossed with male Tg26+/− (heterozygote) mice to generate RARα+/− Tg26+/− mice. Then, we crossed male RAR+/− Tg26+/− mice with female RAR+/− Tg26+/− mice to generate RAR+/+ Tg26+/−, RAR+/− Tg26+/−, RAR−/− Tg26+/− mice, and their corresponding littermates without the Tg26 gene. Mice generated from the same litter of Tg26 mice were used in the studies. Genotyping by tail prep and PCR were performed at 2 weeks of age as described.28
Treatment of animals with Am580
Tg26, RAR+/− Tg26, RAR−/− Tg26, and their corresponding littermates (n = 20 per group including 10 male and 10 female mice in each group) were fed Am580 at a concentration of 0.3 mg/kg/day, and the control foods, which were prepared similarly without Am580. Am580 was a gift from Dr K Shudo (Research Foundation ITSUU Laboratory, Molecular and Functional Bioscience, Japan). The mice were fed these diets everyday from the age of 4 weeks to 12 weeks. Based on the daily measurement of food intake, the average food intake ranged from 3.5 to 4.5 g/day per mouse. Unrestricted water was provided throughout the duration of the experiment. The mice were killed at 12 weeks of age for blood, urine, and tissue collection by exposure to carbon monoxide. Body and kidney weight were recorded. All animal studies were performed according to the protocols approved by the institutional animal care and use committee at the Mount Sinai School of Medicine.
Measurement of blood urea nitrogen, urine protein, and creatinine
Mouse serum was collected for measurement of blood urea nitrogen in the laboratory of Mount Sinai Hospital, New York using a urease-based assay (Vitros BUN/UREA slides detected using Vitros 5,1 FS Instrument, Ortho-Clinical Diagnostics, Rochester, NY). Urine albumin was quantified by enzyme-linked immunosorbent assay using a kit from Bethyl Laboratory (Houston, TX). Urine creatinine levels were measured in the same samples using QuantiChrom Creatinine Assay Kit (DICT-500; BioAssay Systems, Hayward, CA) according to the manufacturer’s instruction. The urine albumin excretion rate was expressed as the ratio of albumin to creatinine.
Quantitative histopathology
Mice were perfused with phosphate-buffered saline containing 4% paraformaldehyde, and kidneys were further fixed in 4% paraformaldehyde for 2 h. Kidney tissue was embedded in paraffin by American Histolabs (Gaithersberg, MD) and 3 µm thick sections were stained with periodic acid-Schiff. Renal histological abnormalities were scored by a renal pathologist (VD’A) as previously described.31 The three parameters scored included the percentage of glomeruli exhibiting collapse and segmental or global sclerosis, the percentage of total renal parenchyma occupied by tubular casts and/or microcysts, and the severity of podocyte hypertrophy and hyperplasia (graded on a semiquantitative scale (0–3+).38 For the latter parameter, podocyte hypertrophy and hyperplasia was graded as 0 (absent), 1+ (involving 1–25% of all glomeruli sampled), 2+ (involving 26–50% of glomeruli), and 3+ (involving >50% of glomeruli) as described.39 An average of 50 glomeruli was sampled per animal.
Isolation of glomeruli from mice for western blot and real-time PCR
Mouse glomeruli were isolated as described.40 Briefly, animals were perfused with Hank’s buffered salt solution containing 2.5 mg/ml iron oxide and 1% bovine serum albumin. At the end of perfusion, kidneys were removed, decapsulated, minced into 1-mm3 pieces, and digested in Hank’s buffered salt solution containing 1 mg/ml collagenase A and 100 U/ml deoxyribonuclease I. Digested tissue was then passed through 100 µm cell strainer and collected by centrifugation. The pellet was resuspended in 2ml of Hank’s buffered salt solution and glomeruli were collected using a magnet. The purity of glomeruli was verified under microscopy and by western blot analysis for podocyte-specific markers including synaptopodin and WT-1.
Immunohistochemistry
Kidney sections from these mice and from kidney biopsies were prepared as described.20 Human kidney biopsies from patients with HIVAN and non-HIV patients with minimal change disease were collected at Columbia University under a protocol approved by its institutional review board. These biopsy samples were from five patients with HIVAN and five patients with minimal change disease, which was confirmed by a renal pathologist. Immunostaining was performed using anti-synaptopodin (gifts of Dr Peter Mundel), anti-RARα, anti-RARβ, and anti-RDH1 (all retinoid-related antibodies were purchased from Santa Cruz Biotechnology, Santa Cruz, CA), and then followed by biotinylated secondary antibodies (Vector Laboratories, Burlingame, CA) as described. After staining, slides were mounted in Aqua Poly/Mount (Polysciences, Warrington, PA) and photographed under an Olympus BX60 microscope (Olympus Optical, Center Valley, PA) with a digital camera. For colocalization studies, sections were incubated with anti-Ki67 antibodies (Dako, Carpinteria, CA) together with anti-nestin antibody (Santa Cruz Biotechnology) at room temperature for 1 h. After washing, sections were incubated with a fluorophore-linked secondary antibody (Alexa Fluor 488 anti-rabbit IgG and Alexa Fluor 568 anti-mouse IgG from Invitrogen, Carlsbad, CA). After mounting, slides were examined by fluorescence microscopy.
Real-time PCR
Total RNA was isolated from kidney glomeruli of mice using TRIzol (Invitrogen). Real-time PCR was performed with a Roche Light-cycler (Roche Applied Science, Indianapolis, IN) and Qiagen QuantiTect SYBR green PCR kit (Qiagen, Valencia, CA) according to the manufacturer’s instructions. Predesigned primer sets were obtained from Qiagen (GeneGlobe) for synaptopodin, nephrin, WT-1, cyclin E, Ki67, RARα, RARβ, RORE, Cyp26A, RDH1, and RDH9. The following sequences were used for the tubulin primers: 5′-TGCCTTTGTGCACTGGTATG-3′ and 5′-CTGGAGCAGTTTG ACGACAC-3′. Light cycler analysis software was used to determine crossing points using the second derivative method. Data were normalized to housekeeping genes (tubulin) and presented as fold increase compared with RNA isolated from WT animals using the 2−ΔΔCT method.
Western blot analysis
Glomerular lysates were subjected to western blot analysis using the following specific antibodies including: rabbit anti-synaptopodin (a gift from Dr Peter Mundel, University of Miami), rabbit anti-nephrin (a gift from Dr Tomoko Takano, McGill University Health Centre), anti-Ki67 (Abcam, Cambridge, MA), anti-nestin (Santa Cruz Biotechnology), anti-cyclin E (EMD Chemicals, Gibbstown, NJ), anti-WT-1 (Santa Cruz Biotechnology), and anti-β-actin antibodies (Sigma-Aldrich, St Louis, MO).
Measurement of tissue retinoids by mass spectrometry as described
Retinol and ATRA levels were determined as described.41,42 Briefly, kidney tissue was homogenized in 0.9% NaCl. KOH/ethanol (0.025 N) was added to the homogenates, followed by extraction with 10 ml of hexane. The top (hexane) layer containing retinol was removed and evaporated under nitrogen and then resolved by reversed-phase high performance liquid chromatography and quantified by their ultraviolet absorbance at 325 nm. The bottom layer was then extracted with 4N HCl and followed by 10ml of hexane. The resulting top layer containing ATRA was evaporated and resolved by a liquid chromatography/tandem mass spectrometry.
Glomerular enzymatic activity for RA acid synthesis
Glomeruli were isolated from Tg26 and little-matched WT mice (n = 5) by the graded sieving method. The purity of isolated glomeruli was verified under microscope.
Glomeruli were homogenized by motor-driven homogenizer in the presence of a buffer containing 10% sucrose (w/w), 10 mmol/l Tris-HCl, 1 mmol/l EDTA, 1.5 mmol/l dithiothreitol, pH = 7.4, and protease inhibitors. Protein concentration was determined by the bicinchoninic acid method.
The enzymatic activity for RA acid synthesis was determined by measuring the conversion of retinol (10 µm) to RA in the presence of glomerular lysates (30 µg) from either WT or Tg26 mice. The reaction occurred in a buffer containing 50 mmol/l HEPES, pH = 8.0, 150 mmol/l KCl, 1 mmol/l EDTA, 2 mmol/l dithiothreitol, NAD + 4 mmol/l, and NADP + 2 mmol/l at 37 °C for 30 min and was stop by placing assay tubes into liquid nitrogen, and RA acid levels were measured as described above. The enzymatic activity for RA synthesis was expressed as pmol of RA generation per mg of glomerular lysates per min of incubation (pmol/mg/min).
Statistical analysis
Data were expressed as mean±s.d.. The unpaired t-test was used to analyze data between two groups. Statistical significance will be considered when P<0.05.
ACKNOWLEDGMENTS
This work was supported by National Institutes of Health grant R01 DK078897 to JCH. JCH is also supported by a VA Merit Award (1I01BX000345). PYC is a recipient of the NIH career development award (K08DK082760).
Footnotes
DISCLOSURE
All the authors declared no competing interests.
REFERENCES
- 1.Evans TR, Kaye SB. Retinoids: present role and future potential. Br J Cancer. 1999;80:1–8. doi: 10.1038/sj.bjc.6690312. [DOI] [PMC free article] [PubMed] [Google Scholar]
- 2.Napoli JL. Retinoic acid biosynthesis and metabolism. FASEB J. 1996;10:993–1001. doi: 10.1096/fasebj.10.9.8801182. [DOI] [PubMed] [Google Scholar]
- 3.Perlmann T. Retinoid metabolism: a balancing act. Nat Genet. 2002;31:7–8. doi: 10.1038/ng877. [DOI] [PubMed] [Google Scholar]
- 4.Napoli JL, Race KR. The biosynthesis of retinoic acid from retinol by rat tissues in vitro. Arch Biochem Biophys. 1987;255:95–101. doi: 10.1016/0003-9861(87)90298-0. [DOI] [PubMed] [Google Scholar]
- 5.Xu Q, Lucio-Cazana J, Kitamura M, et al. Retinoids in nephrology: promises and pitfalls. Kidney Int. 2004;66:2119–2131. doi: 10.1111/j.1523-1755.2004.66002.x. [DOI] [PubMed] [Google Scholar]
- 6.Merlet-Benichou C, Vilar J, Lelievre-Pegorier M, et al. Role of retinoids in renal development: pathophysiological implication. Curr Opin Nephrol Hypertens. 1999;8:39–43. doi: 10.1097/00041552-199901000-00007. [DOI] [PubMed] [Google Scholar]
- 7.Lehrke I, Schaier M, Schade K, et al. Retinoid receptor-specific agonists alleviate experimental glomerulonephritis. Am J Physiol Renal Physiol. 2002;282:F741–F751. doi: 10.1152/ajprenal.00026.2001. [DOI] [PubMed] [Google Scholar]
- 8.Wagner J, Dechow C, Morath C, et al. Retinoic acid reduces glomerular injury in a rat model of glomerular damage. J Am Soc Nephrol. 2000;11:1479–1487. doi: 10.1681/ASN.V1181479. [DOI] [PubMed] [Google Scholar]
- 9.Suzuki A, Ito T, Imai E, et al. Retinoids regulate the repairing process of the podocytes in puromycin aminonucleoside-induced nephrotic rats. J Am Soc Nephrol. 2003;14:981–991. doi: 10.1097/01.asn.0000057857.66268.8f. [DOI] [PubMed] [Google Scholar]
- 10.Perez de Lema G, Lucio-Cazana FJ, Molina A, et al. Retinoic acid treatment protects MRL/lpr lupus mice from the development of glomerular disease. Kidney Int. 2004;66:1018–1028. doi: 10.1111/j.1523-1755.2004.00850.x. [DOI] [PubMed] [Google Scholar]
- 11.Han SY, So GA, Jee YH, et al. Effect of retinoic acid in experimental diabetic nephropathy. Immunol Cell Biol. 2004;82:568–576. doi: 10.1111/j.1440-1711.2004.01287.x. [DOI] [PubMed] [Google Scholar]
- 12.Wyatt CM, Klotman PE. HIV-1 and HIV-associated nephropathy 25 years later. Clin J Am Soc Nephrol. 2007;2 Suppl 1:S20–S24. doi: 10.2215/CJN.03561006. [DOI] [PubMed] [Google Scholar]
- 13.Barisoni L, Bruggeman LA, Mundel P, et al. HIV-1 induces renal epithelial dedifferentiation in a transgenic model of HIV-associated nephropathy. Kidney Int. 2000;58:173–181. doi: 10.1046/j.1523-1755.2000.00152.x. [DOI] [PubMed] [Google Scholar]
- 14.Barisoni L, Kriz W, Mundel P, et al. The dysregulated podocyte phenotype: a novel concept in the pathogenesis of collapsing idiopathic focal segmental glomerulosclerosis and HIV-associated nephropathy. J Am Soc Nephrol. 1999;10:51–61. doi: 10.1681/ASN.V10151. [DOI] [PubMed] [Google Scholar]
- 15.Nagata M, Nakayama K, Terada Y, et al. Cell cycle regulation and differentiation in the human podocyte lineage. Am J Pathol. 1998;153:1511–1520. doi: 10.1016/s0002-9440(10)65739-2. [DOI] [PMC free article] [PubMed] [Google Scholar]
- 16.Shankland SJ, Eitner F, Hudkins KL, et al. Differential expression of cyclin-dependent kinase inhibitors in human glomerular disease: role in podocyte proliferation and maturation. Kidney Int. 2000;58:674–683. doi: 10.1046/j.1523-1755.2000.00213.x. [DOI] [PubMed] [Google Scholar]
- 17.Bruggeman LA, Ross MD, Tanji N, et al. Renal epithelium is a previously unrecognized site of HIV-1 infection. J Am Soc Nephrol. 2000;11:2079–2087. doi: 10.1681/ASN.V11112079. [DOI] [PubMed] [Google Scholar]
- 18.Zhong J, Zuo Y, Ma J, et al. Expression of HIV-1 genes in podocytes alone can lead to the full spectrum of HIV-1-associated nephropathy. Kidney Int. 2005;68:1048–1060. doi: 10.1111/j.1523-1755.2005.00497.x. [DOI] [PubMed] [Google Scholar]
- 19.Zuo Y, Matsusaka T, Zhong J, et al. HIV-1 genes vpr and nef synergistically damage podocytes, leading to glomerulosclerosis. J Am Soc Nephrol. 2006 doi: 10.1681/ASN.2005080878. [DOI] [PubMed] [Google Scholar]
- 20.He JC, Husain M, Sunamoto M, et al. Nef stimulates proliferation of glomerular podocytes through activation of Src-dependent Stat3 and MAPK1,2 pathways. J Clin Invest. 2004;114:643–651. doi: 10.1172/JCI21004. [DOI] [PMC free article] [PubMed] [Google Scholar]
- 21.Wyatt CM, Klotman PE. HIV-associated nephropathy in the era of antiretroviral therapy. Am J Med. 2007;120:488–492. doi: 10.1016/j.amjmed.2007.01.025. [DOI] [PubMed] [Google Scholar]
- 22.He JC, Lu TC, Fleet M, et al. Retinoic acid inhibits HIV-1-induced podocyte proliferation through the cAMP pathway. J Am Soc Nephrol. 2007;18:93–102. doi: 10.1681/ASN.2006070727. [DOI] [PMC free article] [PubMed] [Google Scholar]
- 23.Lu TC, Wang Z, Feng X, et al. Retinoic acid utilizes CREB and USF-1 in a transcriptional feed-forward loop in order to stimulate MKP1 expression in HIV-infected podocytes. Mol Cell Biol. 2008 doi: 10.1128/MCB.00245-08. [DOI] [PMC free article] [PubMed] [Google Scholar]
- 24.Larson RS, Tallman MS. Retinoic acid syndrome: manifestations, pathogenesis, and treatment. Best Pract Res Clin Haematol. 2003;16:453–461. doi: 10.1016/s1521-6926(03)00043-4. [DOI] [PubMed] [Google Scholar]
- 25.Delescluse C, Cavey MT, Martin B, et al. Selective high affinity retinoic acid receptor alpha or beta-gamma ligands. Mol Pharmacol. 1991;40:556–562. [PubMed] [Google Scholar]
- 26.Look J, Landwehr J, Bauer F, et al. Marked resistance of RAR gamma-deficient mice to the toxic effects of retinoic acid. Am J Physiol. 1995;269:E91–E98. doi: 10.1152/ajpendo.1995.269.1.E91. [DOI] [PubMed] [Google Scholar]
- 27.Thorner PS, Ho M, Eremina V, et al. Podocytes contribute to the formation of glomerular crescents. J Am Soc Nephrol. 2008;19:495–502. doi: 10.1681/ASN.2006101115. [DOI] [PMC free article] [PubMed] [Google Scholar]
- 28.Feng X, Lu TC, Chuang PY, et al. Reduction of Stat3 activity attenuates HIV-induced kidney injury. J Am Soc Nephrol. 2009 doi: 10.1681/ASN.2008080879. [DOI] [PMC free article] [PubMed] [Google Scholar]
- 29.Lucas GM, Mehta SH, Atta MG, et al. End-stage renal disease and chronic kidney disease in a cohort of African-American HIV-infected and at-risk HIV-seronegative participants followed between 1988 and 2004. AIDS. 2007;21:2435–2443. doi: 10.1097/QAD.0b013e32827038ad. [DOI] [PubMed] [Google Scholar]
- 30.Lucas GM, Eustace JA, Sozio S, et al. Highly active antiretroviral therapy and the incidence of HIV-1-associated nephropathy: a 12-year cohort study. AIDS. 2004;18:541–546. doi: 10.1097/00002030-200402200-00022. [DOI] [PubMed] [Google Scholar]
- 31.Lu Y, Bertran S, Samuels TA, et al. Mechanism of inhibition of MMTV-neu and MMTV-wnt1 induced mammary oncogenesis by RARalpha agonist AM580. Oncogene. 2010;29:3665–3676. doi: 10.1038/onc.2010.119. [DOI] [PMC free article] [PubMed] [Google Scholar]
- 32.Dawson HD, Collins G, Pyle R, et al. The retinoic acid receptor-alpha mediates human T-cell activation and Th2 cytokine and chemokine production. BMC Immunol. 2008;9:16. doi: 10.1186/1471-2172-9-16. [DOI] [PMC free article] [PubMed] [Google Scholar]
- 33.Vaughan MR, Pippin JW, Griffin SV, et al. ATRA induces podocyte differentiation and alters nephrin and podocin expression in vitro and in vivo. Kidney Int. 2005;68:133–144. doi: 10.1111/j.1523-1755.2005.00387.x. [DOI] [PubMed] [Google Scholar]
- 34.White JA, Beckett-Jones B, Guo YD, et al. cDNA cloning of human retinoic acid-metabolizing enzyme (hP450RAI) identifies a novel family of cytochromes P450. J Biol Chem. 1997;272:18538–18541. doi: 10.1074/jbc.272.30.18538. [DOI] [PubMed] [Google Scholar]
- 35.Osanai M, Petkovich M. Expression of the retinoic acid-metabolizing enzyme CYP26A1 limits programmed cell death. Mol Pharmacol. 2005;67:1808–1817. doi: 10.1124/mol.104.005769. [DOI] [PubMed] [Google Scholar]
- 36.Kastner P, Mark M, Ghyselinck N, et al. Genetic evidence that the retinoid signal is transduced by heterodimeric RXR/RAR functional units during mouse development. Development. 1997;124:313–326. doi: 10.1242/dev.124.2.313. [DOI] [PubMed] [Google Scholar]
- 37.Dickie P, Felser J, Eckhaus M, et al. HIV-associated nephropathy in transgenic mice expressing HIV-1 genes. Virology. 1991;185:109–119. doi: 10.1016/0042-6822(91)90759-5. [DOI] [PubMed] [Google Scholar]
- 38.D’Agati V. Pathologic classification of focal segmental glomerulosclerosis. Semin Nephrol. 2003;23:117–134. doi: 10.1053/snep.2003.50012. [DOI] [PubMed] [Google Scholar]
- 39.D’Agati VD, Fogo AB, Bruijn JA, et al. Pathologic classification of focal segmental glomerulosclerosis: a working proposal. Am J Kidney Dis. 2004;43:368–382. doi: 10.1053/j.ajkd.2003.10.024. [DOI] [PubMed] [Google Scholar]
- 40.Takemoto M, Asker N, Gerhardt H, et al. A new method for large scale isolation of kidney glomeruli from mice. Am J Pathol. 2002;161:799–805. doi: 10.1016/S0002-9440(10)64239-3. [DOI] [PMC free article] [PubMed] [Google Scholar]
- 41.Kane MA, Folias AE, Napoli JL. HPLC/UV quantitation of retinal, retinol, and retinyl esters in serum and tissues. Anal Biochem. 2008;378:71–79. doi: 10.1016/j.ab.2008.03.038. [DOI] [PMC free article] [PubMed] [Google Scholar]
- 42.Kane MA, Folias AE, Wang C, et al. Quantitative profiling of endogenous retinoic acid in vivo and in vitro by tandem mass spectrometry. Anal Chem. 2008;80:1702–1708. doi: 10.1021/ac702030f. [DOI] [PMC free article] [PubMed] [Google Scholar]


