

Abstract
Healthy individuals show robust functional connectivity during rest, which is stronger in adults than in children. Connectivity occurs between the posterior and anterior portions of the default network, a group of structures active in the absence of a task, including the posterior cingulate cortex and the superior frontal gyrus. Previous studies found weaker posterior-anterior connectivity in the default network in adults and adolescents with autism spectrum disorders (ASD). However, these studies used small a priori regions of interest (“seeds”) to calculate connectivity. Since seed location for all participants was chosen based on controls' brains, these studies' analyses are more tailored to controls than individuals with ASD. An alternative is to use a data-driven approach, such as self-organizing maps (SOM), to create a reference for each participant to calculate connectivity. We used individualized resting-state clusters identified by an SOM algorithm to corroborate previous findings of weaker posterior-anterior connectivity in the ASD group and examine age-related changes in the ASD and control groups. Thirty-nine adolescents with ASD and 41 controls underwent a 10-minute, eyes-open, resting state functional MRI scan. The SOM analysis revealed that adolescents with ASD versus controls have weaker connectivity between the posterior hub of the default network and the right superior frontal gyrus. Additionally, controls have larger increases in connectivity with age compared to the ASD group. These findings indicate that SOM is a complementary method for calculating connectivity in a clinical population. Additionally, adolescents with ASD have a different developmental trajectory of the default network compared to controls.
Keywords: functional MRI, autism, self-organizing map, connectivity, default network, superior frontal gyrus
1. Introduction
Autism spectrum disorders (ASD) are neurodevelopmental conditions characterized by impaired social functioning and communication as well as rigid and repetitive behaviors (APA, 1994). ASD is often described as a disorder of abnormal connectivity among brain structures (Belmonte et al., 2004). Although the vast majority of functional imaging studies investigating connectivity in individuals with ASD have used cognitive tasks (e.g., Hughes, 2007; Kleinhans et al., 2008; Koshino et al., 2008; Monk et al., 2010; Weng et al., in press), some studies have examined the robust “default mode” pattern of activation in the absence of a cognitive task (i.e., at rest) (Cherkassky et al., 2006; Kennedy and Courchesne, 2008; Monk et al., 2009; Weng et al.,2010).
For healthy individuals, “resting” or intrinsic connectivity of the default network routinely increases in the absence of a driving task and decreases when engaged in a cognitively demanding task (Buckner and Vincent, 2007; Fox et al., 2005; Raichle and Snyder, 2007). Structures involved in the default network include the posterior cingulate, precuneus, retrosplenial, inferior parietal lobule, superior temporal gyrus, medial prefrontal cortex, superior frontal gyrus, and the parahippocampal gyrus (Buckner et al., 2008; Fox et al., 2005; Greicius et al., 2003; Shulman et al., 1997). In healthy adults, default network structures are functionally as well as structurally connected (Greicius et al., 2003; Greicius et al., 2009; van den Heuvel et al., 2008). These structures are thought to be organized into several interconnected subsystems (Buckner et al., 2008; Gusnard and Raichle, 2001), including posterior and frontal subsystems which are generally strongly connected but are distinct from one another (Greicius et al., 2008; Horovitz et al., 2009).
Studies on the development of the default network suggest that, in healthy participants, posterior to frontal connectivity becomes stronger with age. Fair and colleagues (2008) found weaker posterior-anterior connections in 7- to 9-year-old children compared to 21- to 31-year-old adults. Similarly, Supekar and colleagues (2010) found weaker connectivity in children versus adults. Using an analysis based on Granger causality, Stevens and colleagues (2009) found weaker effective connectivity in early adolescence versus adulthood.
Default network dysfunction has been linked to an array of nervous system conditions, including autism (e.g., Monk et al., 2009; Weng et al., 2010), Alzheimer's disease (e.g., Greicius et al., 2004), attention-deficit/hyperactivity disorder (e.g., Castellanos et al., 2008), schizophrenia (e.g., Garrity et al., 2007), and depression (Drevets et al., 2008; Greicius et al., 2007). This fundamental network may relate to basic central nervous system functions, such as maintaining balance of excitatory and inhibitory inputs or maintaining and interpreting information from the environment (Raichle and Snyder, 2007). Energy consumption for intrinsic activation is large compared to typical task related responses (Raichle and Mintun, 2006). Additionally, intrinsic activation persists across differing states of consciousness, including light sleep (Horovitz et al., 2008), deep sleep (albeit split into posterior and anterior subsystems, Horovitz et al., 2009), and anesthesia (Vincent et al., 2007). The default network is of interest in ASD research as it may be an indication of overall integrity of brain function.
Multiple studies have found weaker functional connections from posterior to anterior subsystems when comparing the default network in individuals with ASD to controls. First, Cherkassky and colleagues (2006) found widespread weaker correlations between averaged clusters of activation within the default network, including posterior to anterior portions, in ASD individuals during brief rest periods between events. Second, Kennedy and colleagues (2008) had subjects look at a fixation cross for seven minutes to activate the default network and averaged correlation maps from three different seeds for each participant; they found that anterior regions were less connected to posterior hubs in ASD individuals. Third, in a previous study from our laboratory, we found that adults with ASD showed less positive connectivity between the posterior cingulate cortex and the right superior frontal gyrus relative to controls (Monk et al., 2009). Lastly, work with adolescents, also from our laboratory, revealed weaker posterior to right superior frontal gyrus connectivity in adolescents with ASD compared to matched controls (Weng et al., 2010). Significantly, in these adolescents, those with ASD had widespread weaker connectivity within the entire default network, not just long-range posterior to anterior connections (Weng et al., 2010). Both Monk and colleagues (2009) and Weng and colleagues (2010) employed functional connectivity analysis procedures commonly used in default network research to facilitate cross-study comparisons (e.g., Fox et al., 2005; Greicius et al., 2003; Uddin et al., 2010).
However, the references used to calculate connectivity in the previous studies on the default network in ASD were the same for each participant, and in all cases except one (Cherkassky et al., 2006), based solely on controls' brains. The reference, or “seed”, is the average timecourse from a small region of interest (ROI) that is used to correlate with each of the voxels in the rest of the brain. Higher correlation coefficients indicate stronger functional connectivity from the reference ROI to that voxel (Cordes et al., 2000). The previous ASD and default network studies chose their seeds based on anatomical and functional studies of controls. Therefore, it is likely that this a priori seed choice would be more tailored to controls' brains than to those of subjects with ASD. This choice may contribute to the pattern of stronger connectivity seen in the controls versus the ASD group. An alternative approach is to use references tailored to each subject's default network, using a data-driven method of identifying the reference. An individualized, data-driven reference timecourse offers an additional advantage in calculating connectivity for children and adolescents, because their anatomy may not be well matched to a seed based on adult brains.
The goal of the present study was to evaluate one such model-free method of identifying the reference, a self organizing map (SOM) algorithm, for use with resting functional MRI (fMRI) data from individuals with ASD and controls, and to utilize this analysis method to examine the developmental trajectory of the default network in adolescents with ASD compared to controls. SOM is a dimension reduction and data visualization technique, which clusters and organizes data that are alike in nodes on a lower-dimensional display (Kohonen, 1997). Specifically, for functional connectivity analyses, SOM organizes each individual's voxels onto nodes in a two-dimensional matrix, where nodes represent clusters of voxels which are highly correlated. Nodes that are closer together in the matrix represent neural networks, as they are more alike than nodes that are farther away in the matrix (Peltier et al., 2003). We used SOM to locate clusters containing the posterior hubs of the default network for each individual. After the algorithm organized the voxels in every individual's brain into clusters, the cluster containing the posterior cingulate cortex/precuneus, and often including the bilateral inferior parietal lobule was chosen (Buckner et al., 2008; Horovitz et al., 2009).
For this study, the posterior hubs derived from the data-driven SOM analysis for each individual were used as the reference to calculate connectivity. Previous studies on the default network in individuals with ASD have largely included posterior seeds, albeit chosen a priori (e.g., Monk et al., 2009; Weng et al., 2010). Using SOM to identify an individualized posterior reference would make our results more comparable to previous work.
Using the functional connectivity brain maps generated by the SOM analysis, we examined long-range connectivity of the posterior hubs of the default network, identified through the SOM algorithm, with the superior frontal gyrus. Previous studies on the default network in ASD reliably found that posterior to superior frontal connectivity was weaker for individuals with ASD versus controls (Kennedy and Courchesne, 2008; Monk et al., 2009; Weng et al., 2010). Our aim was to demonstrate that when connectivity was calculated with a data-driven reference, the ASD group still had weaker posterior to right superior frontal gyrus connectivity. Also, as previous studies found increased posterior-to-anterior frontal connectivity with age in healthy controls (Fair et al., 2008; Supekar et al., 2010), we sought to examine whether the developmental trajectory of the default network connectivity across childhood and adolescence would be different in an ASD sample versus controls.
First, we hypothesized that the ASD group would have weaker posterior to right superior frontal gyrus default network connectivity when using a data-driven method of calculating connectivity. Second, we hypothesized that age-related changes in connectivity strength in the right superior frontal gyrus would be different in children and adolescents with ASD compared to controls.
2. Results
Both the ASD and control groups show default network connectivity (Table 1). We tested whether the ASD group have weaker posterior to right superior frontal gyrus connectivity. This hypothesis was confirmed. Children and adolescents with ASD show weaker posterior to right superior frontal gyrus connectivity than controls, such that the SOM-identified posterior hub reference is less connected with a cluster in the right superior frontal gyrus (xyz = 22, 58, 12, t78= 3.91, p = .037, small volume corrected for the right superior frontal gyrus; Figure 1). Table 2 contains a full list of default network regions different between groups.
Table 1.
(A) Functional connectivity in the control group between posterior hubs seed identified by the SOM and other default network regions. (B) Functional connectivity in the ASD group between the posterior hub seed identified by the SOM and other major default network regions. To document all possible functional connectivity in the default network, the threshold was set at p < 0.05 uncorrected with a minimum number of contiguous extant voxels at k ≥ 10 in both tables. L = left, R = right.
| (A). | ||||||
|---|---|---|---|---|---|---|
| Region | Brodmann's Area | Cluster size |
t df=78 |
MNI Coordinates | ||
| x | y | z | ||||
| Bilateral retrosplenial | 30 | 35 | 8.18 | 6 | -52 | 20 |
| 30 | 29 | 7.63 | -4 | -52 | 20 | |
| 30 | 57 | 5.46 | 8 | -54 | 6 | |
| 30 | 26 | 5.07 | 16 | -58 | 10 | |
| 30 | 22 | 5.06 | -12 | -54 | 6 | |
| 30 | 62 | 5.00 | -4 | -60 | 10 | |
| 30 | 55 | 4.17 | -10 | -50 | 2 | |
| 30 | 28 | 3.29 | 10 | -46 | 2 | |
| L inferior parietal lobule | 40 | 719 | 7.42 | -44 | -58 | 38 |
| 40 | 100 | 5.26 | -48 | -50 | 24 | |
| R inferior parietal lobule | 40 | 448 | 6.10 | 52 | -58 | 38 |
| 40 | 179 | 5.85 | 44 | -50 | 22 | |
| L medial prefrontal cortex | 32 | 1190 | 6.82 | -2 | 50 | 0 |
| R medial prefrontal cortex | 10 | 1147 | 6.98 | 4 | 52 | 2 |
| L superior frontal gyrus | 9 | 2764 | 6.63 | -4 | 52 | 28 |
| R superior frontal gyrus | 10 | 2515 | 6.49 | 10 | 54 | 2 |
| L temporal lobe | 31 | 1502 | 7.41 | -14 | -60 | 18 |
| 21 | 857 | 3.76 | -64 | -6 | -14 | |
| R temporal lobe | 22 | 2108 | 8.28 | 48 | -58 | 28 |
| 21 | 1023 | 5.68 | 60 | -2 | -24 | |
| 30 | 20 | 2.23 | 18 | -36 | -2 | |
| L parahippocampal gyrus | 30 | 487 | 4.17 | -10 | -50 | 2 |
| R parahippocampal gyrus | 35 | 514 | 4.13 | 22 | -28 | -14 |
| (B). | ||||||
|---|---|---|---|---|---|---|
| Region | Brodmann's Area | Cluster size |
t df=78 |
MNI Coordinates | ||
| x | y | z | ||||
| Bilateral retrosplenial | 30 | 23 | 2.78 | -16 | -60 | 10 |
| 30 | 21 | 2.62 | -4 | -48 | 20 | |
| 30 | 33 | 2.54 | -14 | -46 | -2 | |
| 30 | 11 | 2.40 | 16 | -54 | 6 | |
| 30 | 10 | 2.25 | 2 | -46 | 20 | |
| 30 | 24 | 2.24 | 2 | -46 | 20 | |
| L inferior parietal lobule | 40 | 1175 | 4.17 | -42 | -54 | 38 |
| 40 | 105 | 3.48 | -40 | -50 | 24 | |
| R inferior parietal lobule | 40 | 201 | 2.84 | 54 | -52 | 40 |
| 40 | 56 | 2.67 | 66 | -44 | 28 | |
| 2 | 10 | 1.93 | 36 | -36 | 30 | |
| L medial prefrontal cortex | 10 | 391 | 2.86 | -4 | 66 | 14 |
| 10 | 50 | 2.40 | -8 | 64 | 32 | |
| 10 | 37 | 2.26 | -32 | 54 | -4 | |
| R medial prefrontal cortex | 10 | 181 | 2.82 | 10 | 40 | -10 |
| L superior frontal gyrus | 10 | 150 | 2.67 | -16 | 66 | 12 |
| 10 | 670 | 2.58 | -24 | 60 | 28 | |
| 8 | 49 | 2.38 | -4 | 32 | 48 | |
| 10 | 18 | 2.23 | -30 | 56 | -4 | |
| 10 | 15 | 2.03 | -4 | 64 | -6 | |
| R superior frontal gyrus | 8 | 43 | 2.35 | 24 | 24 | 50 |
| 9 | 164 | 2.15 | 24 | 42 | 42 | |
| 8 | 24 | 1.98 | 4 | 32 | 48 | |
| 10 | 17 | 1.90 | 8 | 66 | -4 | |
| 9 | 12 | 1.81 | 42 | 38 | 36 | |
| L temporal lobe | 30 | 1230 | 3.53 | -26 | -60 | 18 |
| 21 | 45 | 2.53 | -68 | -14 | -12 | |
| 21/37 | 10 | 2.23 | -62 | -64 | -2 | |
| R temporal lobe | 21 | 135 | 2.26 | 64 | -14 | -6 |
| 30 | 70 | 2.54 | -14 | -46 | -2 | |
| L parahippocampal gyrus | 30 | 36 | 2.25 | 18 | -50 | 2 |
| R parahippocampal gyrus | 35 | 17 | 1.95 | 24 | -28 | -18 |
Figure 1.
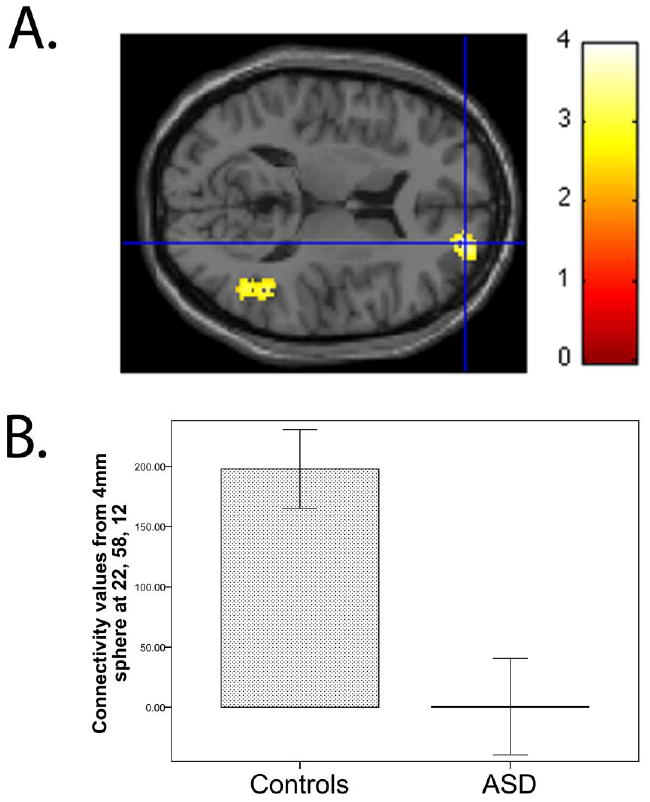
(A) Relative to control group, the ASD group showed weaker connectivity of the posterior hub with the right superior frontal gyrus (cluster size = 584 voxels, peak voxel at xyz = 22, 58, 12, t78 = 3.91, p = .037, small volume corrected for the right superior frontal gyrus). For illustration purposes, the threshold was set at p < 0.01 for the images. (B) To depict connectivity for each subject, z values (scaled by a factor of 100) were extracted from a sphere with a radius of 4 mm around the peak. Means for the control and ASD groups are shown in the bar graph. Error bars indicate the standard error of the mean.
Table 2.
Regions where controls had stronger connectivity with the posterior reference than the ASD group. There were no regions where the ASD group had stronger connectivity than controls. The threshold was set at p < 0.05 (small volume-corrected with FWE for each of the regions in the default network) for both tables. L = left, R = right.
| Region | Brodmann's Area | Cluster size |
t df=78 |
MNI Coordinates | ||
|---|---|---|---|---|---|---|
| x | y | z | ||||
| R superior frontal gyrus | 10 | 584 | 3.91 | 22 | 58 | 12 |
| R inferior parietal lobule | 40 | 32 | 3.55 | 44 | -50 | 22 |
Next, we found that default network connectivity changes with age differently in the children and adolescents with ASD versus controls. There is a significant interaction between age and diagnosis group in the right superior frontal gyrus (xyz = 16, 16, 62, t76= 3.88, p = .041, small volume corrected for the right superior frontal gyrus) such that the control group increases in connectivity with age, but age-related change in connectivity for the ASD group is significantly less than that of the controls (Figure 2). While our hypothesis was limited to the right superior frontal gyrus, other areas in the default network with a significant age by diagnosis interaction are shown in Table 3.
Figure 2.
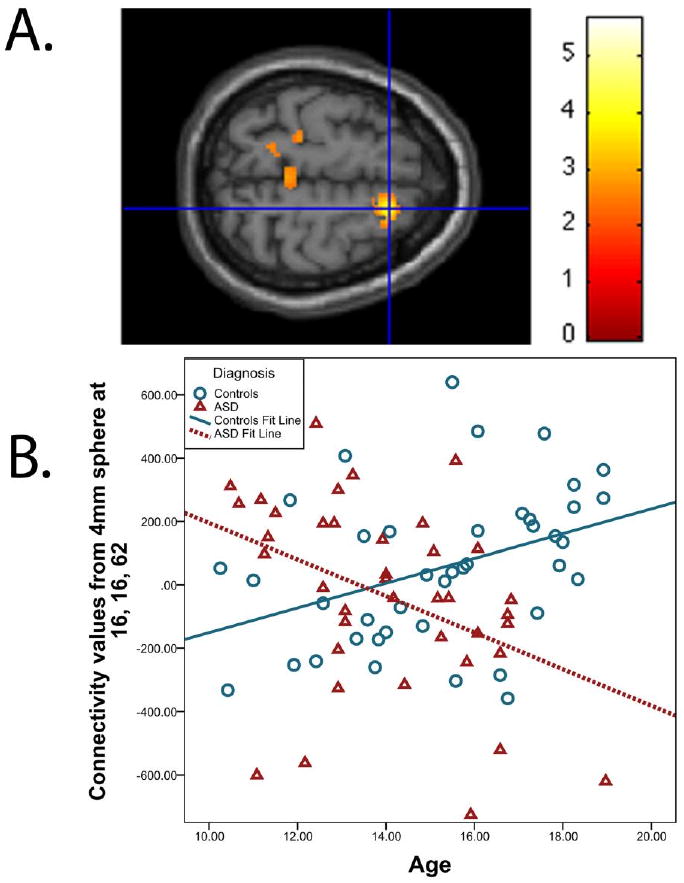
(A) A significant age by diagnosis interaction was detected in the right superior frontal gyrus (cluster size = 402 voxels, peak voxel at xyz = 16, 16, 62, t76 = 3.88, p = .041, small volume corrected for the right superior frontal gyrus). For illustration purposes, the threshold was set at p < 0.01 for the images. (B) To depict connectivity for each subject, z values (scaled by a factor of 100) were extracted from a sphere with a radius of 4 mm around the peak. The scatterplot shows the relationship between age and right superior frontal gyrus connectivity in controls and the ASD group.
Table 3.
(A). Regions in the default network where a significant age by diagnosis interaction was detected, such that increase in connectivity with age was significantly steeper for the controls versus the ASD group. (B). Regions in the default network where increase in connectivity with age was significantly steeper for the ASD group versus the controls. The threshold was set at p < 0.05 (small volume-corrected with FWE for each of the regions in the default network) for both tables. L = left, R= right.
| (A). | ||||||
|---|---|---|---|---|---|---|
| Region | Brodmann's Area | Cluster size |
t df=78 |
MNI Coordirnates | ||
| x | y | z | ||||
| L inferior parietal lobule | 40 | 205 | 3.66 | -68 | -32 | 26 |
| R inferior parietal lobule | 2 | 110 | 3.61 | 36 | -26 | 28 |
| L medial prefrontal cortex | 10 | 129 | 3.93 | -36 | 56 | 26 |
| R superior frontal gyrus | 6 | 402 | 3.88 | 16 | 16 | 62 |
| (B). | ||||||
|---|---|---|---|---|---|---|
| Region | Brodmann's Area | Cluster size |
t df=78 |
MNI Coordinates | ||
| x | y | z | ||||
| L temporal lobe | 37 | 2308 | 4.17 | -38 | -44 | -20 |
| L parahippocampal gyrus | 36 | 410 | 4.04 | -36 | -34 | -18 |
Post-Hoc Analyses
We performed post-hoc analyses to investigate whether our findings were primarily driven by medication, or differences in either non-verbal or verbal cognitive functioning. This approach has been used in the past to address potential confounds (Kennedy and Courchesne, 2008; Monk et al., 2009). A threshold of p < .001 uncorrected was used. As described below in detail, all findings in this study were still significant when taking into account these potential confounds.
Medication Effects
First, we examined whether our findings remained without subjects on medication. Twenty-two of the 39 ASD participants regularly took psychotropic medication and one control took medication for hypothyroidism (levothyroxine) and were excluded from these analyses. The remaining 17 non-medicated ASD participants and 40 controls were used in the analyses. ROIs that had previously yielded significant results were again tested with this new sample excluding those on medication. When those on medication were removed from the SOM analysis, ASD individuals relative to controls still showed weaker connectivity of the posterior reference with the right superior frontal gyrus (xyz = 22, 58, 12, t55= 3.99, p = .000097 uncorrected). Removing individuals on medication from the age by diagnosis model still yielded an interaction in the right superior frontal gyrus (xyz = 18, 14, 62, t53 = 3.57, p = .00039 uncorrected).
Cognitive functioning effects
In our sample, controls had significantly higher verbal cognitive functioning, while those with ASD had marginally higher nonverbal cognitive functioning (Table 4). We conducted the analyses with verbal cognitive functioning score as a nuisance covariate as well as with nonverbal cognitive functioning as a nuisance covariate. When controlling for verbal cognitive functioning score, those with ASD still showed weaker connectivity in the right superior frontal gyrus (xyz = 22, 58, 12, t77 = 3.50, p = .00039 uncorrected). Also, the age by diagnosis interaction was still significant when covarying verbal cognitive functioning (xyz = 16, 16, 62, t75 = 3.84, p = .00013 uncorrected).
Table 4.
Subject characteristics. Note: Three controls were missing non-verbal cognitive functioning scores.
| Control | ASD | t (df) | p value | |
|---|---|---|---|---|
| Number of participants | 41 | 39 | ||
| Gender (M:F) | 33:8 | 32:7 | ||
| Handedness (R:L) | 37:4 | 32:7 | ||
| Age, mean (SD) | 15.3 (2.40) | 14.0 (2.08) | 2.49 (78) | .015 |
| Age range | 10.25 – 18.92 | 10.48 – 18.97 | ||
| Verbal cognitive functioning mean (SD) | 116.5 (13.34) | 108.2 (19.04) | 2.263 (78) | .026 |
| Nonverbal cognitive functioning mean (SD) | 105.4 (11.51) | 111.54 (15.97) | 1.940 (75) | .056 |
Similarly, we controlled for non-verbal cognitive functioning by adding it to the model as a nuisance covariate. Three controls were missing non-verbal cognitive functioning scores; means were imputed for missing data. The right superior frontal gyrus was still weaker in the ASD group compared to controls (xyz = 22, 58, 12, t77 = 3.70, p = .00020 uncorrected). Also, the age by diagnosis interaction was still significant when variance associated with non-verbal cognitive functioning was removed (xyz = 22, 58, 14, t75 = 3.20, p = .0010 uncorrected)
3. Discussion
Our goal in this study was to improve understanding of ASD and the default network by testing an alternative approach to determining connectivity. Our approach involved using a data-driven method, the self-organizing map algorithm, to obtain references for calculating connectivity tailored to each individual's default network. We also used this analysis to extend our understanding of the development of the default network by documenting age-related changes in connectivity in a sample of children and adolescents with ASD compared to controls. For the SOM analysis, we identified the posterior hubs of the default network as a reference timecourse for each individual and then used this reference to calculate connectivity. When using this model-free SOM approach, posterior-anterior connectivity is weaker for ASD individuals versus controls, as traditional seed analyses have found (Cherkassky et al., 2006; Kennedy and Courchesne, 2008; Monk et al., 2009; Weng et al., 2010). Additionally, we found an age by diagnosis interaction such that connectivity increased with age more in controls than in those with ASD.
The present study has implications for the understanding of ASD and the default network. First, our study confirmed that ASD is associated with underconnectivity, as several studies have found, not only during rest (Cherkassky et al., 2006; Kennedy and Courchesne, 2008; Monk et al., 2009; Weng et al., 2010) but also during cognitive tasks (Hughes, 2007; Just et al., 2007; e.g., Kleinhans et al., 2008; Koshino et al., 2008). Additionally, this is the first study, to our knowledge, that has documented a different trajectory of default network connectivity development across childhood and adolescence in an ASD sample versus controls. The finding that controls showed stronger connectivity with age relative to individuals with ASD is in keeping with several ASD studies which have found altered developmental trajectories in brain development (e.g., Schumann et al., 2004; Sparks et al., 2002). This study, together with other developmental studies, indicates that brain abnormalities associated with ASD may be manifested differently at different stages of development. Understanding how and why the default network connectivity fails to strengthen with age in those with ASD versus typically developing individuals will help to elucidate the etiology and maintenance of ASD. At the same time, understanding the failure of the default network to strengthen with age in ASD will also help to clarify the specific functions of the default network, beyond just being a proxy for overall integrity of brain function.
In comparison to Weng and colleagues (2010), who used the traditional a priori seed method, the present study found fewer regions of weaker connectivity in the ASD relative to the control groups. Following the procedures for ROI analyses laid out in Weng and colleagues (2010), an ROI analysis using a conjunction mask of the entire default network did not yield any significant clusters. When performing small volume corrections on each of the regions Weng and colleagues (2010) tested separately, the only other cluster in the default network that was weaker in the ASD group was in the right inferior parietal lobule, extending into the superior temporal gyrus (xyz = 44, -50, 22, t78 = 3.55, p = .043, small volume corrected for the right inferior parietal lobule). There were no regions in the default network that were more connected in the ASD group versus the controls.
Our finding that the SOM approach showed higher specificity compared to the traditional approach on an overlapping sample of adolescents (Weng et al., 2010) suggests that the most highly connected portion of the posterior default network may be in a different location in children and adolescents with ASD versus controls. When Weng and colleagues (2010) used a seed from the same location across individuals to calculate connectivity for every participant, individuals with ASD relative to controls showed widespread weaker connectivity. However, the present study's individualized identification of the reference via SOM found that the ASD group only had weaker connectivity in two locations relative to controls. To examine how altered placement of the default network may be involved in ASD, future studies could create a metric to quantify how differently located the most highly connected posterior portion of the default network is, compared to a “canonical” default network.
Limitations
The present study has several limitations. First, using correlation to measure functional connectivity assumes joint stationarity between the time courses of interest; that is, very low frequency drifts in the data could detrimentally affect our analyses. Factors that could violate the joint stationarity assumption include head motion that is not properly removed. To ensure proper removal of head motion artifact, all functional images were realigned. Additionally, to be included in this study, head motion had to be less than 2.5 mm in the x, y, or z direction; there were no group differences in maximum head motion between the ASD and control participants used for this study. Another potential source of artifacts in fMRI data are cardiac and respiratory rhythms. As such, correction for physiological noise was performed based on cardiac and respiratory recordings for each individual.
Second, we used cross-sectional, not longitudinal, data to examine age-related changes in both the ASD group and the control group. It is possible that cohort differences across the 10-18 year old span may be driving our effects. Repeated scans on individuals through this age range will be necessary to confirm our finding.
Third, 22 of 39 individuals in our ASD group received psychotropic medication and one control received medication for hypothyroidism. Rates of medication use in ASD are very high (Oswald and Sonenklar, 2007). As a consequence, excluding these participants would result in an unrepresentative sample of individuals with ASD, who might be qualitatively different in symptom presentation. However, previous studies have not found medication to be a factor in default network connectivity (Kennedy and Courchesne, 2008; Monk et al., 2009; Weng et al., 2010). Additionally, post-hoc analyses in the present study indicated that medication usage did not drive our effects.
Future Directions
This study helps to establish a basis for future lines of research on the default network and ASD. First, beyond just being a proxy for overall integrity of brain function, the default network may specifically be related to self-projection/theory of mind and mind wandering, as some studies and theoretical reviews posit (e.g., Buckner et al., 2008). Future studies may wish to examine the default network in relation to a range of theory of mind abilities in ASD as well as typically developing controls using the self-organizing map algorithm. Also, if the default network primarily reflects mind wandering, our findings imply that abnormal thought processes in ASD may be of interest. The experience sampling method, in which participants periodically report on their thought processes (Christoff et al., 2009), is a promising way for future default network studies to obtain data on the content of spontaneous thought processes in ASD participants. Second, because resting connectivity procedures do not require participant's response, as cognitive tasks do, they can be replicated on a sample of low functioning individuals with ASD. This will allow researchers to examine default network connectivity in relation to level of adaptive functioning. Third, future studies could examine possible anatomical differences in default network structures within the ASD group that might give rise to differences in default network functional patterns. A multi-method study combining structural and functional MRI would be necessary for this. Fourth, future studies may find it useful to examine genetic influences on brain function in ASD. Polymorphisms in ASD-relevant candidate genes may be linked to differences in default network connectivity. Brain abnormalities in ASD have been linked to specific genes in ASD; for example, Wassink and colleagues (2007) found that gray matter overgrowth in ASD was associated with a functional variant of the serotonin transporter gene. This approach linking genetics and imaging has been fruitful in tracing the link from genes to brain activation to symptoms in other psychological disorders (Dannlowski et al., 2007; Domschke et al., 2006; Furmark et al., 2004; Hariri et al., 2005) and may be useful in ASD research as well.
4. Experimental Procedures
Participants
Thirty-nine children and adolescents with ASD and 41 controls were included in this study. Of a total 59 participants with ASD and 49 controls recruited, 20 participants with ASD and 8 controls were excluded from the analyses due to movement greater than 2.5 mm or discomfort in the MRI resulting in a partial scan. Participants with ASD were recruited for the study through the University of Michigan Autism and Communication Disorders Center. An ASD diagnosis (autism, Asperger's disorder, or pervasive developmental disorder not otherwise specified) was determined based on the Autism Diagnostic Observation Schedule (Lord et al., 2000), the Autism Diagnostic Interview-Revised (Lord et al., 1994), and clinical consensus (Lord et al., 2006). Controls were recruited through flyers posted at local community organizations. The University of Michigan Institutional Review Board approved the procedures, and all participants signed consents. All participants age 18 gave written consent; all minor participants gave assent and their parents gave written consent. Control participants were given the Peabody Picture Vocabulary Test (PPVT; Dunn and Dunn, 1997) and the Ravens Progressive Matrices (Raven, 1960) to evaluate cognitive functioning. ASD participants were given the following cognitive measures: the Differential Ability Scales II – School Age (Elliott, 2005), the Stanford-Binet Intelligence Scales (Roid, 2003), the Wechsler Intelligence Scale for Children IV (Wechsler, 2003), or the Wechsler Abbreviated Scale of Intelligence (Wechsler, 1999). Inclusion criteria consisted of having a score of 84 or higher on either verbal or non-verbal cognitive functioning tests, absence of orthodontic braces, and age between 10 and 18 years old. One ASD participant was diagnosed with epilepsy as a young child, but she was included because results were very similar with and without this individual. ASD participants were on average less than a year younger than controls. Additionally, whereas the control group had significantly higher verbal cognitive functioning, the ASD group had slightly higher nonverbal cognitive functioning, though not significantly so. ASD and control participants were comparable in handedness and gender. Details on these subject characteristics are in Table 4. Forty-five participants from Weng and colleagues' (2010) study with traditional seed analysis were included in our study.
fMRI Data Acquisition
Participants were scanned on a 3 Tesla GE Signa MRI scanner at the University of Michigan. For each participant, 300 T2*-weighted blood oxygen level dependent (BOLD) images were collected using a reverse spiral sequence (Glover and Law, 2001; TR=2000 ms, TE=30 ms, flip angle=90°, FOV=22 cm, 64×64 matrix, 40 contiguous axial 3 mm slices). Slices were acquired parallel to the AC-PC line. For the structural images, a high-resolution 3D T1 axial overlay (TR=8.9, TE=1.8, flip angle=15°, FOV=26 cm, slice thickness=1.4 mm, 124 slices; matrix=256 ×160) was acquired for anatomical localization. Additionally, a high-resolution SPGR image acquired sagittally (flip angle=15°, FOV=26cm, 1.4mm slice thickness, 110 slices) was used for coregistration of the functional images.
FMRI Procedures
Participant Instructions
A visual fixation cross (“plus” symbol) was presented to the participant in the MRI scanner while functional data were collected for 10 minutes. Participants were instructed to let their minds wander and to not think about anything in particular while they looked at the cross.
Correction for Physiological Noise
To collect physiological data for subsequent noise correction, an abdominal pressure belt monitored each participant's respiration, and a pulse oximeter on the participant's left middle finger monitored cardiac signal. The physiological data were collected using the GE scanner, synchronized to the fMRI data.
FMRI Data Analysis
Data Preprocessing
The acquired fMRI data were preprocessed as part of the standard processing stream at the University of Michigan. First, outliers in the raw k-space data lying more than two standard deviations from the mean, or “white pixel” artifacts, were removed and replaced with the average of the neighboring time-points. Second, the k-space data were reconstructed to image space by using a custom reconstruction program for gridding and inverse 2D Fourier transform. A field map correction was applied to reduce artifacts from susceptibility regions. Third, RETROICOR was applied to the data to remove noise associated with cardiac and respiratory rhythms (Glover et al., 2000). Fourth, images were corrected for differences in slice timing by phase-shifting and re-sampling the signal (Oppenheim et al., 1999). The middle slice was used as the temporal reference point. Finally, the MCFLIRT program in FMRIB Software Library (Jenkinson et al., 2002) corrected for head motion by realigning all images to the 10th functional image.
Additional pre-processing of the data was accomplished in-house using the SPM5 Matlab toolbox (Wellcome Department of Cognitive Neurology, London, UK; http://www.fil.ion.ucl.ac.uk). High-resolution T1 anatomical images were co-registered to the functional images. The images were then smoothed using an isotropic 8 mm full width at half maximum (FWHM) Gaussian kernel. To exclude higher frequency sources of noise and to isolate the frequency band in which resting state connectivity has previously been observed in fMRI data, the time courses from each voxel were low-pass filtered with a 0.08 Hz cutoff frequency (Biswal et al., 1995; Cordes et al., 2000).
Calculating Connectivity Using a Self-Organizing Map Algorithm
A self-organizing map algorithm was used to identify a data-driven seed for each individual to cross-correlate with the low-frequency timecourses from every other voxel in the individual's brain (Peltier et al., 2003). One hundred timecourses of randomly generated white noise over 300 time points filled a 10 × 10 matrix and served as exemplars, or initial conditions, at every node in the matrix. In an iterative process, each voxel was compared with every one of the exemplars. The exemplar which was most like a given voxel was identified using a least squares metric, which calculated the minimum distance between the voxel and exemplar. This exemplar was then updated to more closely represent the given voxel's timecourse by adding the difference between the voxel and the exemplar at each time point to the exemplar. Additionally, neighboring exemplars were updated to a lesser degree. This was given by:
| (1) |
where x is the timecourse of the voxel in question, mi is the timecourse of the exemplar i, t is the current iteration number, and hci (t) is the “neighborhood function” which dictated to what degree neighboring exemplars were updated in addition to the exemplar i. The extent to which neighboring exemplars were updated was based on a Gaussian kernel that shrank as the number of iterations increased until only individual nodes were updated near the end of the procedure. The neighborhood function was given by:
| (2) |
where α is the learning rate that regulates how quickly exemplars are updated, set to 0.1, ri and rc are the coordinates of the neighboring and closest exemplars, and σ(t) is the full width at half maximum of the Gaussian function, set initially to 5 nodes but decreasing by 25% at every iteration. These parameters were chosen based on Peltier and colleagues' (2003) recommendations for resting state fMRI data. This process was repeated with every voxel until convergence was achieved; that is, further iterations did not produce new updates to the exemplar at any node. Convergence occurred within a hundred iterations for all subjects.
The one hundred nodes in the 10 × 10 matrix were then distilled into 16 superclusters by calculating the minimum distance between the exemplar at each node and its neighboring exemplars using the least squares metric. The nodes which were most alike were placed into the same supercluster. This process was repeated until every node had been placed into one of sixteen superclusters.
Each of the superclusters for the participants was examined by an experienced investigator blind to condition (ASD versus control). The superclusters were visually compared to a map of the posterior hubs of the default network, with activation in the posterior cingulate cortex/precuneus and the bilateral angular gyrus/inferior parietal lobule, generated by Wake Forest University PickAtlas (Maldjian et al., 2002). The supercluster which most resembled the map of the posterior hubs of the default network was identified for each participant (Figure 3; Buckner et al., 2008; Horovitz et al., 2009). All the low-pass filtered BOLD timecourses from the voxels in this supercluster were then extracted and averaged to form a reference timecourse. Next, this reference timecourse was correlated with all of the low-pass filtered voxels in the brain to form functional connectivity maps for each subject. Lastly, images were normalized to Montreal Neurological Image (MNI) space by estimating the transformation matrix for the SPGR anatomical image to an MNI template image in SPM5, then applying this transformation to the functional images. The Pearson's r values at each voxel were converted to z values, via Fisher's r to z transformation. These connectivity images were then ready to use in random effects analyses.
Figure 3.
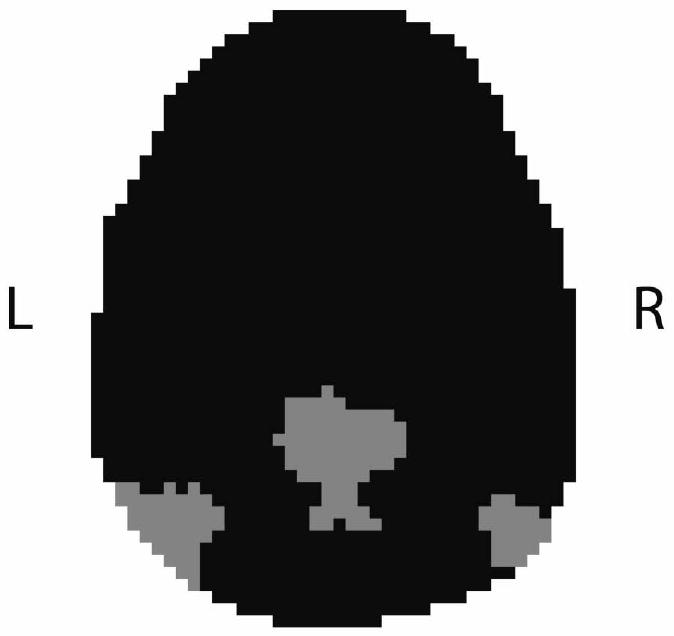
An example of a supercluster which an investigator blind to condition identified as containing the posterior hubs of the default network (posterior cingulate and angular gyri/inferior parietal lobule). Data are from a single 64 × 64 slice in the transverse plane. Gray indicates that a voxel is a member of this supercluster; black indicates that the voxel does not belong in this supercluster.
Second-Level Analyses
We conducted three types of second-level analyses on the images generated by the SOM analysis. First, we confirmed that default network connectivity was present in the ASD participants as a group as well as in the controls. To facilitate cross-study comparisons, we created masks for use as described in Weng and colleagues (2010). The mask defining the entire default network included the following regions: bilateral retrosplenial/Brodmann Area (BA) 30, left and right inferior parietal lobule, left and right medial prefrontal/BA 32 and 10 combined, left and right superior frontal gyri, left and right temporal lobes, and left and right parahippocampal gyri (Buckner et al., 2008; Gusnard and Raichle, 2001; Weng et al., 2010). Each separate structure was also utilized as a mask. Region of interest masks were defined using the Wake Forest University PickAtlas (Maldjian et al., 2002). A region of interest (ROI) analysis was performed for each of the regions, using p < 0.05 uncorrected threshold. Significant clusters in these ROIs for the ASD and control groups separately are found in Table 1.
Second, a group-level random effects analysis was performed in SPM5 to compare ASD versus control participants' connectivity within the default network. An ROI analysis was performed to examine long-range functional connections between the posterior hubs of the default network and the right superior frontal gyrus. Additionally, the entire default network mask and the individual region masks were used to examine group differences within the default network. For these analyses, significance thresholds were small volume-corrected for multiple comparisons within each ROI using family wise error (FWE) correction (Worsley et al., 1996). Significant clusters in these masks comparing ASD and control groups are found in Table 2.
Third, a regression equation with an age by diagnosis interaction term in SPM5 was utilized to examine age-related differences in connectivity within the ASD group versus the controls. An ROI analysis of the right superior frontal gyrus was performed to examine whether changes in connectivity strength with age were different for the ASD group compared to the controls. Additionally, the entire default network mask and the individual region masks were used to check for clusters with a significant age by diagnosis interaction within the default network. As with the group differences model, significance thresholds were small volume-corrected for multiple comparisons within each ROI using family wise error (FWE) correction (Worsley et al., 1996). Significant clusters for this analysis are listed in Table 3.
Acknowledgments
This research was supported in part by an Autism Speaks Predoctoral Fellowship to J.L.W., an Autism Speaks grant to C.S.M., a National Institutes of Health grant to S.J.P. (MH079871), and National Institutes of Health grants to C.L. (U19 HD35482 and MH066496). We thank the families who participated. We also thank Dr. Douglas Noll for methodological advice, and Nikhil Kurapati and Keith Newnham for technical support.
Dr. Lord receives royalties from a publisher of diagnostic instruments described in this paper. She gives all profits generated by the University of Michigan Autism and Communication Disorders Center (UMACC) in regards to this paper and all other UMACC projects to a charity.
Footnotes
Publisher's Disclaimer: This is a PDF file of an unedited manuscript that has been accepted for publication. As a service to our customers we are providing this early version of the manuscript. The manuscript will undergo copyediting, typesetting, and review of the resulting proof before it is published in its final citable form. Please note that during the production process errors may be discovered which could affect the content, and all legal disclaimers that apply to the journal pertain.
References
- APA. Diagnostic and Statistical Manual of Mental Disorders. American Psychiatric Association; Washington, DC: 1994. [Google Scholar]
- Belmonte MK, Allen G, Beckel-Mitchener A, Boulanger LM, Carper RA, Webb SJ. Autism and abnormal development of brain connectivity. J Neurosci. 2004;24:9228–31. doi: 10.1523/JNEUROSCI.3340-04.2004. [DOI] [PMC free article] [PubMed] [Google Scholar]
- Biswal B, Yetkin FZ, Haughton VM, Hyde JS. Functional connectivity in the motor cortex of resting human brain using echo-planar MRI. Magn Reson Med. 1995;34:537–41. doi: 10.1002/mrm.1910340409. [DOI] [PubMed] [Google Scholar]
- Buckner RL, Vincent JL. Unrest at rest: default activity and spontaneous network correlations. Neuroimage. 2007;37:1091–6. doi: 10.1016/j.neuroimage.2007.01.010. discussion 1097-9. [DOI] [PubMed] [Google Scholar]
- Buckner RL, Andrews-Hanna JR, Schacter DL. The brain's default network: anatomy, function, and relevance to disease. Ann N Y Acad Sci. 2008;1124:1–38. doi: 10.1196/annals.1440.011. [DOI] [PubMed] [Google Scholar]
- Castellanos FX, Margulies DS, Kelly C, Uddin LQ, Ghaffari M, Kirsch A, Shaw D, Shehzad Z, Di Martino A, Biswal B, Sonuga-Barke EJ, Rotrosen J, Adler LA, Milham MP. Cingulate-precuneus interactions: a new locus of dysfunction in adult attention-deficit/hyperactivity disorder. Biol Psychiatry. 2008;63:332–7. doi: 10.1016/j.biopsych.2007.06.025. [DOI] [PMC free article] [PubMed] [Google Scholar]
- Cherkassky VL, Kana RK, Keller TA, Just MA. Functional connectivity in a baseline resting-state network in autism. Neuroreport. 2006;17:1687–90. doi: 10.1097/01.wnr.0000239956.45448.4c. [DOI] [PubMed] [Google Scholar]
- Christoff K, Gordon AM, Smallwood J, Smith R, Schooler JW. Experience sampling during fMRI reveals default network and executive system contributions to mind wandering. Proc Natl Acad Sci U S A. 2009;106:8719–24. doi: 10.1073/pnas.0900234106. [DOI] [PMC free article] [PubMed] [Google Scholar]
- Cordes D, Haughton VM, Arfanakis K, Wendt GJ, Turski PA, Moritz CH, Quigley MA, Meyerand ME. Mapping functionally related regions of brain with functional connectivity MR imaging. AJNR Am J Neuroradiol. 2000;21:1636–44. [PMC free article] [PubMed] [Google Scholar]
- Dannlowski U, Ohrmann P, Bauer J, Kugel H, Baune BT, Hohoff C, Kersting A, Arolt V, Heindel W, Deckert J, Suslow T. Serotonergic genes modulate amygdala activity in major depression. Genes Brain Behav. 2007;6:672–6. doi: 10.1111/j.1601-183X.2006.00297.x. [DOI] [PubMed] [Google Scholar]
- Domschke K, Braun M, Ohrmann P, Suslow T, Kugel H, Bauer J, Hohoff C, Kersting A, Engelien A, Arolt V, Heindel W, Deckert J. Association of the functional - 1019C/G 5-HT1A polymorphism with prefrontal cortex and amygdala activation measured with 3 T fMRI in panic disorder. Int J Neuropsychopharmacol. 2006;9:349–55. doi: 10.1017/S1461145705005869. [DOI] [PubMed] [Google Scholar]
- Drevets WC, Price JL, Furey ML. Brain structural and functional abnormalities in mood disorders: implications for neurocircuitry models of depression. Brain Struct Funct. 2008;213:93–118. doi: 10.1007/s00429-008-0189-x. [DOI] [PMC free article] [PubMed] [Google Scholar]
- Dunn LM, Dunn LM. Peabody Picture Vocabulary Test. American Guidance Services; Circle Pines, MN: 1997. [Google Scholar]
- Elliott CD. The differential ability scales. In: Flanagan DP, Harrison PL, editors. Contemporary Intellectual Assessment: Theories, Tests, and Issues. Guilford Press; New York: 2005. pp. 402–424. [Google Scholar]
- Fair DA, Cohen AL, Dosenbach NU, Church JA, Miezin FM, Barch DM, Raichle ME, Petersen SE, Schlaggar BL. The maturing architecture of the brain's default network. Proc Natl Acad Sci U S A. 2008;105:4028–32. doi: 10.1073/pnas.0800376105. [DOI] [PMC free article] [PubMed] [Google Scholar]
- Fox MD, Snyder AZ, Vincent JL, Corbetta M, Van Essen DC, Raichle ME. The human brain is intrinsically organized into dynamic, anticorrelated functional networks. Proc Natl Acad Sci U S A. 2005;102:9673–8. doi: 10.1073/pnas.0504136102. [DOI] [PMC free article] [PubMed] [Google Scholar]
- Furmark T, Tillfors M, Garpenstrand H, Marteinsdottir I, Langstrom B, Oreland L, Fredrikson M. Serotonin transporter polymorphism related to amygdala excitability and symptom severity in patients with social phobia. Neurosci Lett. 2004;362:189–92. doi: 10.1016/j.neulet.2004.02.070. [DOI] [PubMed] [Google Scholar]
- Garrity AG, Pearlson GD, McKiernan K, Lloyd D, Kiehl KA, Calhoun VD. Aberrant “default mode” functional connectivity in schizophrenia. Am J Psychiatry. 2007;164:450–7. doi: 10.1176/ajp.2007.164.3.450. [DOI] [PubMed] [Google Scholar]
- Glover GH, Li TQ, Ress D. Image-based method for retrospective correction of physiological motion effects in fMRI: RETROICOR. Magn Reson Med. 2000;44:162–7. doi: 10.1002/1522-2594(200007)44:1<162::aid-mrm23>3.0.co;2-e. [DOI] [PubMed] [Google Scholar]
- Glover GH, Law CS. Spiral-in/out BOLD fMRI for increased SNR and reduced susceptibility artifacts. Magn Reson Med. 2001;46:515–22. doi: 10.1002/mrm.1222. [DOI] [PubMed] [Google Scholar]
- Greicius MD, Krasnow B, Reiss AL, Menon V. Functional connectivity in the resting brain: a network analysis of the default mode hypothesis. Proc Natl Acad Sci U S A. 2003;100:253–8. doi: 10.1073/pnas.0135058100. [DOI] [PMC free article] [PubMed] [Google Scholar]
- Greicius MD, Srivastava G, Reiss AL, Menon V. Default-mode network activity distinguishes Alzheimer's disease from healthy aging: evidence from functional MRI. Proc Natl Acad Sci U S A. 2004;101:4637–42. doi: 10.1073/pnas.0308627101. [DOI] [PMC free article] [PubMed] [Google Scholar]
- Greicius MD, Flores BH, Menon V, Glover GH, Solvason HB, Kenna H, Reiss AL, Schatzberg AF. Resting-state functional connectivity in major depression: abnormally increased contributions from subgenual cingulate cortex and thalamus. Biol Psychiatry. 2007;62:429–37. doi: 10.1016/j.biopsych.2006.09.020. [DOI] [PMC free article] [PubMed] [Google Scholar]
- Greicius MD, Kiviniemi V, Tervonen O, Vainionpaa V, Alahuhta S, Reiss AL, Menon V. Persistent default-mode network connectivity during light sedation. Hum Brain Mapp. 2008;29:839–47. doi: 10.1002/hbm.20537. [DOI] [PMC free article] [PubMed] [Google Scholar]
- Greicius MD, Supekar K, Menon V, Dougherty RF. Resting-state functional connectivity reflects structural connectivity in the default mode network. Cereb Cortex. 2009;19:72–8. doi: 10.1093/cercor/bhn059. [DOI] [PMC free article] [PubMed] [Google Scholar]
- Gusnard DA, Raichle ME. Searching for a baseline: functional imaging and the resting human brain. Nat Rev Neurosci. 2001;2:685–94. doi: 10.1038/35094500. [DOI] [PubMed] [Google Scholar]
- Hariri AR, Drabant EM, Munoz KE, Kolachana BS, Mattay VS, Egan MF, Weinberger DR. A susceptibility gene for affective disorders and the response of the human amygdala. Arch Gen Psychiatry. 2005;62:146–52. doi: 10.1001/archpsyc.62.2.146. [DOI] [PubMed] [Google Scholar]
- Horovitz SG, Fukunaga M, de Zwart JA, van Gelderen P, Fulton SC, Balkin TJ, Duyn JH. Low frequency BOLD fluctuations during resting wakefulness and light sleep: a simultaneous EEG-fMRI study. Hum Brain Mapp. 2008;29:671–82. doi: 10.1002/hbm.20428. [DOI] [PMC free article] [PubMed] [Google Scholar]
- Horovitz SG, Braun AR, Carr WS, Picchioni D, Balkin TJ, Fukunaga M, Duyn JH. Decoupling of the brain's default mode network during deep sleep. Proc Natl Acad Sci U S A. 2009;106:11376–81. doi: 10.1073/pnas.0901435106. [DOI] [PMC free article] [PubMed] [Google Scholar]
- Hughes JR. Autism: the first firm finding = underconnectivity? Epilepsy Behav. 2007;11:20–4. doi: 10.1016/j.yebeh.2007.03.010. [DOI] [PubMed] [Google Scholar]
- Jenkinson M, Bannister P, Brady M, Smith S. Improved optimization for the robust and accurate linear registration and motion correction of brain images. Neuroimage. 2002;17:825–41. doi: 10.1016/s1053-8119(02)91132-8. [DOI] [PubMed] [Google Scholar]
- Just MA, Cherkassky VL, Keller TA, Kana RK, Minshew NJ. Functional and anatomical cortical underconnectivity in autism: evidence from an FMRI study of an executive function task and corpus callosum morphometry. Cereb Cortex. 2007;17:951–61. doi: 10.1093/cercor/bhl006. [DOI] [PMC free article] [PubMed] [Google Scholar]
- Kennedy DP, Courchesne E. The intrinsic functional organization of the brain is altered in autism. Neuroimage. 2008;39:1877–85. doi: 10.1016/j.neuroimage.2007.10.052. [DOI] [PubMed] [Google Scholar]
- Kleinhans NM, Richards T, Sterling L, Stegbauer KC, Mahurin R, Johnson LC, Greenson J, Dawson G, Aylward E. Abnormal functional connectivity in autism spectrum disorders during face processing. Brain. 2008;131:1000–12. doi: 10.1093/brain/awm334. [DOI] [PubMed] [Google Scholar]
- Kohonen T. Self-organizing maps. Vol. 30. Springer; Heidelberg: 1997. [Google Scholar]
- Koshino H, Kana RK, Keller TA, Cherkassky VL, Minshew NJ, Just MA. fMRI investigation of working memory for faces in autism: visual coding and underconnectivity with frontal areas. Cereb Cortex. 2008;18:289–300. doi: 10.1093/cercor/bhm054. [DOI] [PMC free article] [PubMed] [Google Scholar]
- Lord C, Rutter M, Le Couteur A. Autism Diagnostic Interview-Revised: a revised version of a diagnostic interview for caregivers of individuals with possible pervasive developmental disorders. J Autism Dev Disord. 1994;24:659–85. doi: 10.1007/BF02172145. [DOI] [PubMed] [Google Scholar]
- Lord C, Risi S, Lambrecht L, Cook EH, Jr, Leventhal BL, DiLavore PC, Pickles A, Rutter M. The autism diagnostic observation schedule-generic: a standard measure of social and communication deficits associated with the spectrum of autism. J Autism Dev Disord. 2000;30:205–23. [PubMed] [Google Scholar]
- Lord C, Risi S, DiLavore PS, Shulman C, Thurm A, Pickles A. Autism from 2 to 9 years of age. Arch Gen Psychiatry. 2006;63:694–701. doi: 10.1001/archpsyc.63.6.694. [DOI] [PubMed] [Google Scholar]
- Maldjian J, Laurienti P, Burdette J, Kraft R. An Automated Method for Neuroanatomic and Cytoarchitectonic Atlas-based Interrogation of fMRI Data Sets. Neuroimage. 2002;19:1233–1239. doi: 10.1016/s1053-8119(03)00169-1. [DOI] [PubMed] [Google Scholar]
- Monk CS, Peltier SJ, Wiggins JL, Weng SJ, Carrasco M, Risi S, Lord C. Abnormalities of intrinsic functional connectivity in autism spectrum disorders. Neuroimage. 2009;47:764–72. doi: 10.1016/j.neuroimage.2009.04.069. [DOI] [PMC free article] [PubMed] [Google Scholar]
- Monk CS, Weng SJ, Wiggins JL, Kurapati N, Louro HM, Carrasco M, Maslowsky J, Risi S, Lord C. Neural circuitry of emotional face processing in autism spectrum disorders. J Psychiatry Neurosci. 2010;35:105–14. doi: 10.1503/jpn.090085. [DOI] [PMC free article] [PubMed] [Google Scholar]
- Oppenheim A, Schafer R, Buck J. Discrete-time signal processing. Prentice Hall; Upper Saddle River, NJ: 1999. [Google Scholar]
- Oswald DP, Sonenklar NA. Medication use among children with autism spectrum disorders. J Child Adolesc Psychopharmacol. 2007;17:348–55. doi: 10.1089/cap.2006.17303. [DOI] [PubMed] [Google Scholar]
- Peltier SJ, Polk TA, Noll DC. Detecting low-frequency functional connectivity in fMRI using a self-organizing map (SOM) algorithm. Hum Brain Mapp. 2003;20:220–6. doi: 10.1002/hbm.10144. [DOI] [PMC free article] [PubMed] [Google Scholar]
- Raichle ME, Mintun MA. Brain work and brain imaging. Annu Rev Neurosci. 2006;29:449–76. doi: 10.1146/annurev.neuro.29.051605.112819. [DOI] [PubMed] [Google Scholar]
- Raichle ME, Snyder AZ. A default mode of brain function: a brief history of an evolving idea. Neuroimage. 2007;37:1083–90. doi: 10.1016/j.neuroimage.2007.02.041. discussion 1097-9. [DOI] [PubMed] [Google Scholar]
- Raven JC. Guide to using the Standard Progressive Matrices. Lewis; London, UK: 1960. [Google Scholar]
- Roid GH. Stanford-Binet Intelligence Scales, 5th edition: Examiner's Manual. Riverside Publishing; Itasca, IL: 2003. [Google Scholar]
- Schumann CM, Hamstra J, Goodlin-Jones BL, Lotspeich LJ, Kwon H, Buonocore MH, Lammers CR, Reiss AL, Amaral DG. The amygdala is enlarged in children but not adolescents with autism; the hippocampus is enlarged at all ages. J Neurosci. 2004;24:6392–401. doi: 10.1523/JNEUROSCI.1297-04.2004. [DOI] [PMC free article] [PubMed] [Google Scholar]
- Shulman GL, Fiez JA, Corbetta M, Buckner RL, Miezin FM, Raichle ME, Petersen SE. Common blood flow changes across visual tasks: II. Decreases in cerebral cortex. Journal of Cognitive Neuroscience. 1997;9:648–663. doi: 10.1162/jocn.1997.9.5.648. [DOI] [PubMed] [Google Scholar]
- Sparks BF, Friedman SD, Shaw DW, Aylward EH, Echelard D, Artru AA, Maravilla KR, Giedd JN, Munson J, Dawson G, Dager SR. Brain structural abnormalities in young children with autism spectrum disorder. Neurology. 2002;59:184–92. doi: 10.1212/wnl.59.2.184. [DOI] [PubMed] [Google Scholar]
- Stevens MC, Pearlson GD, Calhoun VD. Changes in the interaction of resting-state neural networks from adolescence to adulthood. Hum Brain Mapp. 2009;30:2356–66. doi: 10.1002/hbm.20673. [DOI] [PMC free article] [PubMed] [Google Scholar]
- Supekar K, Uddin LQ, Prater K, Amin H, Greicius MD, Menon V. Development of functional and structural connectivity within the default mode network in young children. Neuroimage. 2010 doi: 10.1016/j.neuroimage.2010.04.009. [DOI] [PMC free article] [PubMed] [Google Scholar]
- Uddin LQ, Supekar K, Amin H, Rykhlevskaia E, Nguyen DA, Greicius MD, Menon V. Dissociable Connectivity within Human Angular Gyrus and Intraparietal Sulcus: Evidence from Functional and Structural Connectivity. Cereb Cortex. 2010 doi: 10.1093/cercor/bhq011. [DOI] [PMC free article] [PubMed] [Google Scholar]
- van den Heuvel M, Mandl R, Luigjes J, Hulshoff Pol H. Microstructural organization of the cingulum tract and the level of default mode functional connectivity. J Neurosci. 2008;28:10844–51. doi: 10.1523/JNEUROSCI.2964-08.2008. [DOI] [PMC free article] [PubMed] [Google Scholar]
- Vincent JL, Patel GH, Fox MD, Snyder AZ, Baker JT, Van Essen DC, Zempel JM, Snyder LH, Corbetta M, Raichle ME. Intrinsic functional architecture in the anaesthetized monkey brain. Nature. 2007;447:83–6. doi: 10.1038/nature05758. [DOI] [PubMed] [Google Scholar]
- Wassink TH, Hazlett HC, Epping EA, Arndt S, Dager SR, Schellenberg GD, Dawson G, Piven J. Cerebral cortical gray matter overgrowth and functional variation of the serotonin transporter gene in autism. Arch Gen Psychiatry. 2007;64:709–17. doi: 10.1001/archpsyc.64.6.709. [DOI] [PubMed] [Google Scholar]
- Wechsler D. Wechsler Abbreviated Scale of Intelligence (WASI) Harcourt Assessment; San Antonio, TX: 1999. [Google Scholar]
- Wechsler D. Wechsler Intelligence Scale for Children - 4th edition (WISC-IV) Harcourt Assessment; San Antonio, TX: 2003. [Google Scholar]
- Weng SJ, Wiggins JL, Peltier SJ, Carrasco M, Risi S, Lord C, Monk CS. Alterations of resting state functional connectivity in the default network in adolescents with autism spectrum disorders. Brain Res. 2010;1313:202–14. doi: 10.1016/j.brainres.2009.11.057. [DOI] [PMC free article] [PubMed] [Google Scholar]
- Weng SJ, Carrasco M, Swartz JR, Wiggins JL, Kurapati N, Liberzon I, Risi S, Lord C, Monk CS. Neural activation to emotional faces in adolescents with autism spectrum disorders. Journal of Child Psychology and Psychiatry. doi: 10.1111/j.1469-7610.2010.02317.x. in press. [DOI] [PMC free article] [PubMed] [Google Scholar]
- Worsley KJ, Marrett S, Neelin P, Vandal AC, Friston KJ, Evans AC. A unified statistical approach for determining significant signals in images of cerebral activation. Hum Brain Mapp. 1996;4:58–73. doi: 10.1002/(SICI)1097-0193(1996)4:1<58::AID-HBM4>3.0.CO;2-O. [DOI] [PubMed] [Google Scholar]