
Figure 1.
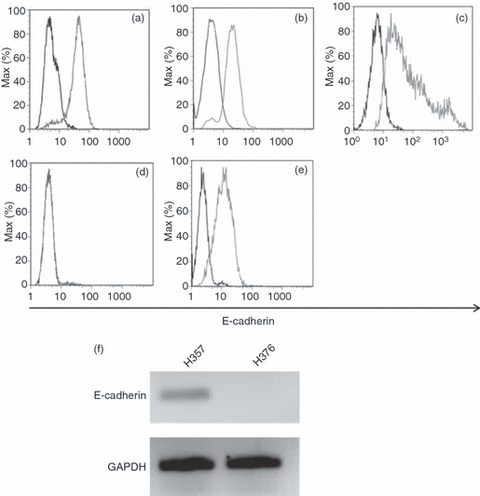
E-cadherin expression by epithelial cells. Cell-surface expression of E-cadherin, as determined by flow cytometry with mAb E4.6 (HECD-1 staining not shown), on (a) MCF-7, (b) H357, (c) normal oral keratinocytes (NOK), (d) H376 and (e) UP cells. In each case the dark histogram shows control cells and the light histogram shows cells stained for E-cadherin. (f) Expression of E-cadherin messenger RNA by H357 and H376 cells. Representative results n = 3. GAPDH, glyceraldehyde-3-phosphate dehydrogenase.