

Abstract
Although osteoblasts (OB) play a key role in the hematopoietic stem cell (HSC) niche, little is known as to which specific OB lineage cells are critical for the enhancement of stem and progenitor cell function. Unlike hematopoietic cells, OB cell surface phenotypic definitions are not well developed. Therefore, to determine which OB lineage cells are most important for hematopoietic progenitor cell (HPC) function, we characterized OB differentiation by gene expression and OB function, and determined whether associations existed between OB and HPC properties. OB were harvested from murine calvariae, used immediately (fresh OB) or cultured for 1, 2, or 3 weeks prior to their co-culture with Lin-Sca1+c-kit+ (LSK) cells for 1 week. OB gene expression, alkaline phosphatase activity, calcium deposition, hematopoietic cell number fold increase, CFU fold increase, and fold increase of Lin-Sca1+ cells were determined. As expected, HPC properties were enhanced when LSK cells were cultured with OB compared to being cultured alone. Initial alkaline phosphatase and calcium deposition levels were significantly and inversely associated with an increase in the number of LSK progeny. Final calcium deposition levels and OB culture duration were inversely associated with all HPC parameters, while Runx2 levels were positively associated with all HPC properties. Since calcium deposition is associated with OB maturation and high levels of Runx2 are associated with less mature OB lineage cells, these results suggest that less mature OB better promote HPC proliferation and function than do more mature OB.
Keywords: osteoblasts, hematopoietic stem cell niche, calcium, alkaline phosphatase, Runx2, hematopoietic progenitor cells
Hematopoietic stem cells (HSC) are multipotent cells that give rise to all blood cells. Located within the bone marrow, it is generally believed that HSC reside in more specialized and restricted areas of the bone marrow microenvironment called the hematopoietic niche. The concept of the hematopoietic niche was first introduced by Schofield (Schofield,1978). Since then, a more detailed picture of the hematopoietic microenvironment emerged in which two niches, the endosteal, and the vascular niche are now distinguished (Kopp et al., 2005). It is generally accepted that quiescent HSC reside in the endosteal region in close proximity to osteoblasts (OB), while more active HSC reside in the vascular niche (Wilson et al., 2007). Further, many studies provide evidence in support of the physical (Nilsson et al., 2001) and molecular (Calvi et al., 2003; Adams et al., 2006; Nilsson et al., 2005; Stier et al., 2005; Zhang et al., 2003) interactions between HSC and OB and demonstrate the ability of OB to support in vitro hematopoiesis (Taichman and Emerson, 1994) and survival of stem cells and hematopoietic progenitor cells (HPC) (Jung et al., 2005).
Although it has been shown that OB are a key player in the HSC niche (Taichman, 2005), very little is known as to which OB lineage cells are critical for the enhancement of HSC properties. Unlike hematopoietic lineage cells where cell surface markers are well established and can allow cells to be separated by specific stages of differentiation, knowledge of the cell surface markers expressed on OB lineage cells is much more limited. As a result, the term OB has been loosely used when describing the hematopoietic niche to refer to any cell of the OB lineage. This issue was recently reviewed by Kiel and Morrison (Kiel and Morrison, 2008), where they suggested that most investigators term endosteal lining cells as OB while in fact these cells are heterogeneous and include OB lineage cells at many stages of maturation as well as other cells including osteoclasts. In this study we investigated a well defined population of immature OB and used proven culture methodologies and standard markers of osteoblastic differentiation to examine the effect of OB at various stages of maturation on fundamental HPC functional properties. Like was previously posited by Zhu and Emerson (Zhu and Emerson, 2004), we believe that clarification of the population of cells responsible for enhancing stem and progenitor cell proliferation and function is of importance as the application of this knowledge would allow for better understanding of how OB contribute to stem cell fate decisions and be used to possibly optimize culture systems to manipulate or expand HSC for clinical applications. We therefore attempted to dissect whether early or late stage OB are better at promoting several hematopoietic stem and progenitor cell properties. Our data illustrate that early or less mature OB have a higher hematopoiesis enhancing potential than their more mature counterparts.
Materials and Methods
Animals
C57BL/6 mice (2day pups) and B6.SJL-PtγcqPep3b/BoyJ (BoyJ) mice (6-8wk old) were originally obtained from Jackson Laboratories. Both C57BL/6 and BoyJ mice were subsequently bred, housed, and used to generate F1 progeny at our animal facilities at Indiana University. For transplantation, recipient mice received 1000 Rad, split dose. Cells were infused via the tail vein. All procedures followed protocols approved by the Laboratory Animal Research Facility of the Indiana University School of Medicine and followed NIH guidelines.
Preparation and Culture of Calvarial OB
Neonatal murine calvarial cells were prepared following a modification of published basic methods (Ciovacco et al., 2009; Horowitz et al., 1994; Wong and Cohn, 1975). Briefly, calvariae from C57BL/6 mice less than 48 hours old were dissected out, pretreated with EDTA in PBS for 30 min, then subjected to sequential collagenase digestions (200 U/ml). Fractions 3-5 (digestions 20-35 minutes, 35-50 minutes, and 50-65 minutes) were collected and used as OB. These cells are > 95% OB or OB precursors as previously demonstrated by a variety of criteria (Horowitz et al., 1994; Jilka and Cohn, 1981; Simmons et al., 1982). Freshly prepared OB (0 weeks culture duration) or OB that were cultured for 1, 2 or 3 weeks were used for all studies.
OB cultured for 1, 2, or 3 weeks were maintained in αMEM supplemented with 10% FBS and were further supplemented with ascorbic acid (50μg/ml added on day 0 and at all feedings) and β-glycerophosphate (5mM added starting on day 7 and all subsequent feedings). Cells were fed 2×/week.
LSK Preparation and Cell Sorting
Low density cells were prepared from BM flushed from the long-bones of BoyJ (CD45.1) mice. These cells were washed once with stain wash (PBS, 1% bovine calf serum, and 1% Penicillin-streptomycin) and then stained with antibodies as indicated below for 15 minutes on ice. Briefly, low density BM cells from BoyJ (CD45.1) mice were stained with phycoerythrin (PE)–conjugated lineage markers including monoclonal antibodies (Ab) for CD3, CD4, CD45R, Ter119, and Gr1; allophycocyanin (APC)–conjugated cKit (CD117); fluorescein isothiocyanate (FITC)- conjugated Sca1 (BD Biosciences). Lin- Sca1+ cKit+ (LSK) cells were identified and sorted on a BD FACS Aria.
OB-LSK Co-Culture Set-Up
Freshly prepared OB or cultured OB from C57Bl/6 mice (CD45.2) were plated at a frequency of 40,000 cells per well in a 12 well plate; freshly sorted 1000 LSK cells from BoyJ mice (CD45.1) were seeded after 24 hours. Figure 1 is a representative micrograph showing similar OB morphology and confluence following 4 days of culture in the presence or absence of LSK cells and cytokines. It should be noted that by day 7 cultures containing LSK cells and cytokines have numerous hematopoietic cells making visualization of OB difficult unless hematopoietic cells are removed. Importantly, OB morphology and confluence (∼100% confluent) is still virtually identical between cultures (data not shown). All the cultures were supplemented with a cocktail of cytokines containing recombinant murine SCF & IL3 (10ng/mL), IGF1 & TPO (20ng/mL), IL6 & Flt3 (25ng/mL) and OPN (50ng/mL). Cultures were maintained for one week in medium consisting of 1:1 mix of IMDM and αMEM supplemented with 10% FBS, 1% Pen/Strep, and 1% L-Glutamine. Cells were harvested on day 7 and counted. Fold increase in the number of cells derived from LSK cells was calculated relative to d0 count of 1,000. It should be noted that in each experiment LSK cells were also seeded in wells containing no OB as a control.
Figure 1.

Micrographs of OB cultured for 4 days in the presence or absence of LSK cells and cytokines. No significant differences were observed in OB morphology or confluence when cultured with LSK cells and cytokines. The hematopoietic cells are the smaller, more spherical cells which refract the light differently than the OB and appear more white in the image.
LSK Phenotyping
For the analysis of cultured LSK cells, the entire well of co-cultured cells was harvested and stained with the above Ab combinations except CD117. In addition, cells were also stained with pacific blue (PB)- conjugated CD45.1 and phycoerythrin-Cy7 (PE-Cy7)- conjugated CD45.2. CD45.1+ cells were gated and phenotypically analyzed for the presence of Lin- Sca1+ cells. Since c-kit expression (CD117) is quickly downregulated via the internalization of the receptor in cultures supplemented with exogenous SCF (Danet et al., 2001; Eto et al., 2005; Yee et al., 1994), we did not use CD117 to track the phenotypic makeup of cultured cells on day 7. Flow cytometric analysis was performed on a BD LSRII.
Clonogenic Assays
Cultured cells or freshly sorted cells were plated in duplicate in 3cm Petri dishes containing 1mL methyl cellulose with cytokines (MethoCult GF M3434, Stem Cell Technologies). Cultures were maintained at 37°C in a humidified incubator at 5% CO2 and colonies were counted on an inverted microscope after 7-days. CFU fold increase among cultured cells was calculated relative to the number of colonies obtained from the plating of 250 fresh LSK cells on d0 under identical conditions.
Alkaline Phosphatase Activity
Alkaline phosphatase activity was determined by the colorimetric conversion of p-nitrophenol phosphate to p-nitrophenol (Sigma) and normalized to total protein (BCA, Pierce) (Hughes and Aubin, 1998). Briefly, cells were washed 2× with PBS, subsequently lysed with 0.1% (vol/vol) Triton X-100 supplemented with a cocktail of broad-range protease inhibitors (Pierce), subjected to two freeze-thaw cycles, and cleared via centrifugation. Lysates were incubated with 3 mg/ml p-nitrophenol phosphate in an alkaline buffer, pH 8.0, (Sigma) for 30 min at 37°C. The reaction was stopped by the addition of 20 mM NaOH and read at 405 nM (GENios Plus, Tecan). The enzymatic activity of alkaline phosphatase was determined by comparison with known p-nitrophenol standards (Sigma). It should be noted that initial alkaline phosphatase refers to levels in OB cultures at the initiation of the experiment (just prior to LSK cells being added) and final alkaline phosphatase refers to levels in OB cultures 7 days later (when HPC cells are removed and hematopoietic properties are tested).
Quantitative Analysis of Calcium Deposition
Calcium deposition was assessed by eluting Alizarin Red S from cell monolayers as previously described (Stanford et al., 1995). Briefly, monolayers were washed 2× with PBS, subsequently fixed in ice cold 70% (v/v) ethanol for 1 hr, then washed 2× with water. Monolayers were stained with 40mM Alizarin Red S (pH 4.2) for 10 min (room temperature, shaking), unbound dye was removed by washing with water (5×) and with PBS (1× for 15 minutes, room temperature, shaking). Bound Alizarin Red was eluted by incubating monolayers with 1% (v/v) cetylpyridinium chloride in 10mM sodium phosphate (pH 7.0) for 15 min (room temperature, shaking). Absorbance from aliquots was measured at 562 nm (GENios Plus, Tecan), and Alizarin Red concentrations were calculated from measured standards (Ca/mol of dye in solution). Like alkaline phosphatase, initial calcium deposition refers to levels in OB cultures at the initiation of the experiment (just prior to LSK cells being added) and final calcium deposition refers to levels in OB cultures 7 days later (when HPC cells are removed and hematopoietic properties are tested).
Quantitative Real-Time RT PCR
Total RNA was isolated using RNAeasy kit (Quiagen). DNAse (Quiagen)-treated RNA was used to generate cDNAs by reverse transcription according to the manufacturer's instructions (SuperScript II kit; Invitrogen). PCR reactions were performed in an MX3000 detection system using SYBR green PCR reagents following the manufacturer's instructions (Stratagene). For each gene analyzed, a calibration curve was performed and all the oligonucleotides were tested to ensure specificity and sensitivity. For each sample, arbitrary units obtained using the standard curve and the expression of GAPDH was used to normalize the amount of the investigated transcript. The following primer sequences were used:
| Runx2 forward primer: | 5′ CGACAGTCCCAACTTCCTGT |
| Runx2 reverse primer: | 5′ CGGTAACCACAGTCCCATCT |
| Alkaline phosphatase forward primer: | 5′ GCTGATCATTCCCACGTTTT |
| Alkaline phosphatase reverse primer: | 5′ CTGGGCCTGGTAGTTGTTGT |
| Osteocalcin forward primer: | 5′ AAGCAGGAGGGCAATAAGGT |
| Osteocalcin reverse primer: | 5′ TTTGTAGGCGGTCTTCAAGC |
| Osteopontin forward primer: | 5′ ACTCCAATCGTCCCTACAGTCG |
| Osteopontin reverse primer: | 5′ TGAGGTCCTCATCTGTGGCAT |
| Type I collagen forward primer: | 5′ CAGGGAAGCCTCTTTCTCCT |
| Type I collagen reverse primer: | 5′ ACGTCCTGGTGAAGTTGGTC |
| GAPDH forward primer: | 5′ CGTGGGGCTGCCCAGAACAT |
| GAPDH reverse primer: | 5′ TCTCCAGGCGGCACGTCAGA |
Statistical Analyses
Pearson's correlation coefficients (bivariate correlation) were used to determine R2 values. Linear regressions using analysis of variance model were performed to compare groups. All analyses were performed with the Statistical Package for Social Sciences (SPSS 16; Norusis/SPSS Inc., Chicago, IL) software and were two tailed with a level of significance set at 0.05.
Results
OB Enhance HPC Proliferation and Function
In preliminary experiments, we predetermined the numbers of OB and LSK cells required for the initiation and maintenance of co-cultures for 7 days without the need to remove any of the LSK progeny prior to day 7 because of excessive proliferation or the rapid expansion of OB that may result in the sloughing of these cells and loss of integrity of the co-cultures. Cell numbers reported in our studies were determined to be ideal for this mix of cells over 7 days. The 7-day period was chosen based on our historical work with cultured HSC (Ladd et al., 1997; Srour et al., 2005). Multiple mixes of media at different ratios were also examined and these experiments indicated that a 1:1 mix of media provided ample support for both cell types.
Although it is well known that OB lineage cells are important in the HSC niche, it remains unclear as to which OB lineage cells are critical for the maintenance of HSC properties. In this study, we worked to dissect whether early or late stage OB are better at promoting several functions of immature hematopoietic cells. To accomplish this, we first had to confirm that in our in vitro experimental model, OB were able to enhance cell function. The HPC properties examined in this study were hematopoietic cell proliferation (defined as the fold increase in cell number from the original 1000 LSK cells seeded after 1 week of culture), CFU fold increase (defined as the total CFU number after 1 week of culture / total number of colonies derived from freshly sorted LSK cells), and the fold increase of Lin-Sca1+ cells (defined as the percentage of Lin-Sca1+ cells among progeny of LSK cells following 1 week of culture multiplied by the total LSK progeny cell number). In 8 separate experiments, we have consistently observed enhanced HPC properties when LSK cells were cultured with OB as compared to being cultured alone (on tissue culture grade plastic). Figure 2 illustrates this enhancement in HPC properties for LSKs cultured with OB (n=7-9) as compared to those cultured without OB (n=6-8). Cell number fold increase was significantly elevated (p=0.05) when LSK cells were cultured with OB (1500±500) as compared to being cultured alone (1000±400). Likewise, CFU fold increase was significantly elevated (p<0.001) when LSK cells were cultured with OB (150±43) as compared to being cultured alone (52±36). Similarly, the fold increase of Lin-Sca1+ cells was significantly elevated (p=0.004) when LSK cells were cultured with OB (420±120) as compared to being cultured alone (160±140). We have previously demonstrated that these changes are associated with the maintenance of repopulating potential of cultured HSC (Chitteti et al., in press) in that LSK cells harvested from OB co-cultures after 10 days repopulated the hematopoietic system of lethally irradiated recipients at levels comparable to those obtained with freshly isolated LSK cells (when expansion equivalent numbers of cells were used) and sustained high levels of chimerism in secondary recipients (Chitteti et al., in press).
Figure 2.
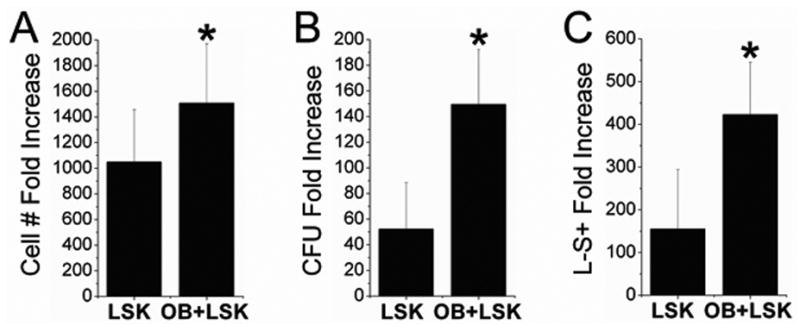
LSK cells were cultured alone or in the presence of freshly prepared OB for 7 days and the following parameters were measured: A) Hematopoietic cell number fold increase; B) CFU fold increase; and C) Percentage of Lin-Sca1+ cell fold increase. Co-culture of LSK cells with OB significantly increased all hematopoietic parameters analyzed as compared to LSK cells cultured alone. Error bars represent the standard deviations associated with the mean. *Indicates, statistically significant differences (p<0.05) compared to LSK cells alone for identical HSC measurements.
Associations between Functional OB Measures and HPC Properties
The major goal of this study was to determine whether less mature or more mature OB lineage cells were important in the HSC promoting properties observed above (Figure 2). To do this, we examined two well accepted measures of OB function and determined whether associations existed between OB function and HPC properties tested. Specifically, we measured alkaline phosphatase (major enzymatic activity of OB) and calcium deposition (as a marker for mineralization). In parallel cultures, we measured these levels at the initiation of the experiment (when LSK cells were added) and at the termination of the experiment (7 days after initiation, when cells were removed and HSC properties were tested) for fresh OB (assessed only after 7d culture, final levels) and for OB maintained in culture for 1, 2, or 3 weeks. The other set of cultures was used to measure HPC function after 7d as described above for Figure 2. Data from these cultures were analyzed by linear regression using analysis of variance model (ANOVA) to determine whether significant associations were found between independent and dependent variables. Pearson's correlation coefficient was used to determine R2 values. Data from these studies are summarized in Table 1. Rows 1 and 2 in Table 1 demonstrate that initial alkaline phosphatase and initial calcium deposition levels are both significantly associated with cell number fold increase. These data are shown in scatter plot form in Figure 3. It should be noted that the alkaline phosphatase and calcium deposition measurements were normalized to the 1 week OB time point. While it would be more typical to normalize to the fresh OB time point, the calculation could not be determined for fresh OB at the experiment initiation because cells must be adherent and growing in order to complete the functional assays measuring alkaline phosphatase and calcium deposition. Fresh OB would not be adherent at time 0, so we normalized to the next time point (1 week OB). These data demonstrate that the association is an inverse relationship where the higher LSK progeny cell number is associated with lower levels of alkaline phosphatase and lower calcium deposition levels. Rows 3-5 in Table 1 show that final calcium deposition levels are associated with all three HPC parameters measured. As depicted in Figure 4, like the initial levels, final calcium deposition levels are inversely associated with the HPC parameters, with higher fold increase in LSK progeny cell number, CFU fold increase, and fold increase of Lin-Sca1+ cells being associated with lower final levels of calcium deposition. Because higher calcium deposition or mineralization generally occurs in more mature OB cultures, these data suggest that less mature or early stage OB lineage cells better promote HPC properties as compared to more differentiated/mature OB lineage cells.
Table 1. Significant associations observed between OB culture properties (dependent) and HPC properties (independent).
| Dependent Variable | n | Independent Variable | n | R2 | p-value | |
|---|---|---|---|---|---|---|
| 1 | AP Initial | 6 | Cell # Fold Increase | 15 | 0.781 | 0.019 |
| 2 | Ca Initial | 6 | Cell # Fold Increase | 15 | 0.650 | 0.05 |
| 3 | Ca Final | 10 | Cell # Fold Increase | 15 | 0.682 | 0.003 |
| 4 | Ca Final | 10 | CFU Fold Increase | 15 | 0.738 | 0.001 |
| 5 | Ca Final | 9 | %Lin-Sca1+ Fold Increase | 13 | 0.624 | 0.01 |
| 6 | Culture Duration | 14 | Cell # Fold Increase | 15 | 0.588 | 0.001 |
| 7 | Culture Duration | 14 | CFU Fold Increase | 15 | 0.696 | <0.001 |
| 8 | Culture Duration | 13 | %Lin-Sca1+ Fold Increase | 13 | 0.679 | 0.001 |
| 9 | Culture Duration – Trypsin | 29 | Cell # Fold Increase | 24 | 0.212 | 0.02 |
| 10 | Culture Duration – Trypsin | 29 | CFU Fold Increase | 24 | 0.542 | <0.001 |
| 11 | Culture Duration - Trypsin | 29 | %Lin-Sca1+ Fold Increase | 22 | 0.383 | 0.002 |
| 12 | Runx2 | 8 | Cell # Fold Increase | 15 | 0.845 | 0.03 |
| 13 | Runx2 | 8 | CFU Fold Increase | 15 | 0.790 | 0.04 |
| 14 | Runx2 | 8 | %Lin-Sca1+ Fold Increase | 13 | 0.874 | 0.02 |
AP – alkaline phosphatase activity, Ca – calcium deposition
Figure 3.

A: Scatter plot with initial alkaline phosphatase (AP) levels on the x-axis and cell number fold increase on the y-axis. With an R2 value of 0.781 coupled with ANOVA results (p=0.02) it appears that a relationship exists (inverse association) between these variables and that the relationship may be exponential as an R2 value greater than 0.8 was not achieved (generally thought of as linear). B: Scatter plot with initial calcium (Ca) levels on the x-axis and cell number fold increase on the y-axis. With an R2 value of 0.650 coupled with ANOVA results (p=0.05) it appears that an exponential relationship exists (inverse association). Initial levels of AP and Ca refer to levels measured in OB cultures prior to seeding of LSK cells. Results are reported as a percentage of “1 week OB cultures” (e.g. 1 week OB AP level =100%). It is important to understand that “1 week OB cultures” have been cultured for 1 week in osteogenic medium prior to co-culture for 1 week with LSK cells and cytokines. Significant relationships were not identified between either initial AP or Ca levels and the other HSC properties tested.
Figure 4.

Scatter plots with final Ca levels on x-axis and cell number fold increase (A), CFU fold increase (B), and percentage of Lin-Sca1+ cell fold increase (C) on the y-axes, respectively. In all cases the R2 value coupled with the ANOVA results are suggestive of a significant relationship between the variables tested. Likewise, in all comparisons the relationship was an inverse association, where the HSC parameter tested increased with lower levels of Ca. Further, for all comparisons it appears that the relationship is more exponential in nature as compared to linear. Final Ca levels refer to levels measured in OB cultures 1 week after initial Ca levels were measured (duration of LSK cell co-culture). Results are reported as a percentage of “1 week OB cultures” (e.g. 1 week OB Ca level =100%). It should be noted that “1 week OB cultures” have been cultured for 1 week alone prior to co-culture for 1 week with LSK cells and cytokines, thus total OB culture duration is 2 weeks.
Associations between OB Culture Duration and HPC Properties
To further test the idea that less mature OB lineage cells are better at enhancing HPC properties, we examined the ability of freshly prepared OB as well as those cultured for 1, 2, and 3 weeks prior to experiment initiation to enhance HPC properties. In general, OB mature with culture duration (Gerstenfeld et al., 1987). Therefore, the more mature cells should be found in 3 week cultures. Rows 6-8 in Table 1 show that significant associations were detected between culture duration and all of the HPC properties analyzed. Again, as illustrated in Figure 5 an inverse relationship was observed. As culture duration increased, the ability to promote HPC properties was reduced. Like the calcium deposition data, these data suggest that as OB lineage cells mature, their ability to enhance HPC properties decreases. To further confirm these data, we co-cultured LSK cells with freshly prepared OB or OB that had been cultured for 1, 2, or 3 weeks prior to experimental initiation as before with one difference: In these studies, pre-cultured OB were trypsinized and then seeded at identical cell concentrations as those used for freshly prepared OB. This manipulation assures that the increased cell number in 1, 2, and 3 week OB cultures was not responsible for inhibiting LSK expansion and function. Rows 9-11 in Table 1 show that as was seen with non-trypsinized OB, trypsinized OB culture duration is associated with all three LSK parameters studied. Again, similar to the results from non-trypsinized cultures, as the initial culture duration of trypsinized OB cultures increased, HPC enhancement declined. These data further suggest that OB culture duration and by extension, OB maturation, is inversely related to hematopoietic enhancing properties. This inverse relationship is illustrated in Figure 6.
Figure 5.

Scatter plots with final OB culture duration on the x-axis and cell number fold increase (A), CFU fold increase (B), and percentage of Lin-Sca1+ cell fold increase (C) on the y-axes, respectively. In all cases the R2 value coupled with the ANOVA results are suggestive of a significant relationship between the variables tested. For all comparisons the relationship was an inverse association and the association appears to be exponential.
Figure 6.

Scatter plots with final OB culture duration (cumulative duration for trypsinized OB) on the x-axis and cell number fold increase (A), CFU fold increase (B), and percentage of Lin-Sca1+ cell fold increase (C) on the y-axes, respectively. Although in all cases significance was achieved (p<0.05), the R2 values were lower than those obtained when OB were not trypsinized (0.212, 0.542, and 0.383 for A, B, and C, respectively).
As detailed in Figure 7, our real-time PCR data is consistent with the notion that as OB culture duration increases so does OB maturation. Specifically we show that 1) Runx2 expression is highest in fresh OB cultures and decreases with increases in OB culture duration (Runx2 is a transcription factor which is critical for differentiation of early stage OB lineage cells) (Krause et al., 2008; Lian et al., 2004; Stein and Lian, 1993; Otto et al., 1997; Mundlos,1999; Schroeder et al., 2005); 2) Alkaline phosphatase expression increases with OB culture duration up to 2 weeks (3 weeks cumulative OB culture duration) and then stabilizes; and 3) All of the OB specific bone matrix proteins tested showed an increase in expression with an increase in culture duration (type I collagen, osteopontin (OPN), and osteocalcin) suggesting that cells in the latter culture durations are mature OB producing osteoid while fresh OB are early stage OB lineage cells.
Figure 7.
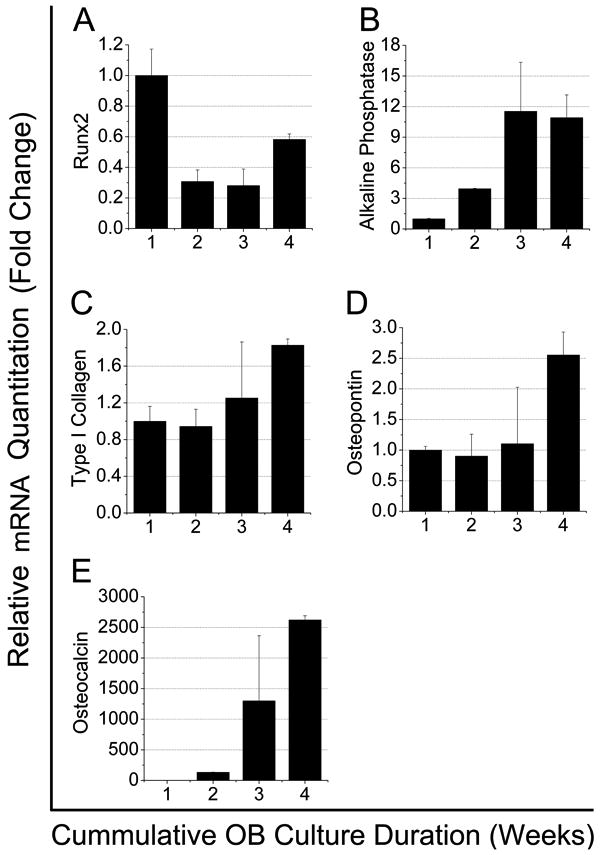
mRNA expression in freshly prepared OB or OB cultured for 1, 2, or 3 weeks prior to LSK seeding (x-axis shows cumulative OB culture duration, e.g. freshly prepared =1, 1 week=2, 2 week=3, and 3 week= 4). Error bars represent the standard deviations associated with the mean. Runx2 expression was highest in freshly isolated OB and declined with culture duration. Alkaline phosphatase expression increased with culture duration, peaking at week 2 and this level was maintained in week 3 cultures. As expected, expression of type I collagen, OPN, and osteocalcin increased as OB culture duration increased.
Finally, we confirmed our in vitro findings by performing in vivo reconstitution studies. LSK cells were co-cultured with either fresh or 3 week OB for 7 days prior to transplantation into lethally irradiated recipients and chimerism in the blood was measured monthly for 4 months post transplantation. While LSK cells from both co-cultures were able to repopulate the hematopoietic system, the levels of chimerism were significantly higher in recipients receiving LSK cells harvested from fresh OB as compared to those harvested from 3 week OB (average 7.4 fold increase, p=0.01, n=5/group).
Associations between OB Gene Expression and HPC Properties
To further confirm that less mature OB lineage cells are better at enhancing HPC properties, we examined Runx2 expression (high in early stage OB lineage cells and declines with differentiation) in freshly prepared OB as well as those cultured for 1, 2, or 3 weeks prior to experiment initiation and examined associations with HPC properties. Rows 12-14 in Table 1 show that significant associations were detected between Runx2 mRNA expression and all of the HPC properties analyzed. As illustrated in Figure 8 as Runx2 expression decreased, the ability of OB to promote HPC properties was also reduced. Like the calcium deposition and the OB culture duration data, results from Runx2 analysis suggest that as OB lineage cells mature, their ability to enhance HPC properties decreases.
Figure 8.

Scatter plots with Runx2 mRNA expression on the x-axis and cell number fold increase (A), CFU fold increase (B), and percentage of Lin-Sca1+ cell fold increase (C) on the y-axes, respectively. In all cases the R2 value coupled with the ANOVA results are suggestive of a significant linear relationship between the variables tested.
Discussion
Although recent work has focused on the role of OB in the HSC niche, little progress has been made in delineating which specific OB lineage cells are important for HSC maintenance and function. In a series of experiments presented here, we provided substantial evidence suggesting that early stage OB expressing high levels of Runx2 better promote HPC proliferation and function than do more mature OB. Given that unlike hematopoietic cells, cell surface markers for OB are not well defined, we could not proceed with our investigations using prospectively isolated populations of early stage versus later stage OB. Limited consensus is that OB lineage cells are CD45-CD31- Ter119-Sca1- cells (Arai et al., 2008; Mayack and Wagers, 2008; Semerad et al., 2005). Some work has been completed to further separate OB lineage populations using cell surface markers such as ALCAM (Arai et al., 2008) and OPN (Mayack and Wagers, 2008). Arai and coworkers (Arai et al., 2008) recently defined ALCAM as a marker capable of distinguishing between mature and immature OB from long bones of adult mice when combined with Sca1 and a CD45, CD31, and Ter119 lineage (Lin) cocktail. In their definition, Lin-Sca1-ALCAM- cells were immature OB while Lin-Sca1-ALCAM+ cells were mature OB (Arai et al., 2008). Of importance, many investigators use ALCAM as a marker of multipotential mesenchymal stem cells as compared to OB lineage cells (McCarty et al., 2009; Brooke et al., 2008). Kalajzic et al. (Kalajzic et al., 2003) indicated that ALCAM is not an OB specific marker, although it can be used to assess the proportion of undifferentiated mesenchymal stem cells in culture. On the other hand, OPN is commonly used in conjunction with the expression of other bone secreted proteins to identify OB cells and even stages of differentiation (Krause et al., 2008). However, by itself, OPN would be expressed on many stages of OB cells including pre-OB, immature OB, and mature OB, albeit at different levels of expression (Krause et al., 2008). Our real-time data in Figure 7 concur that OB cultured for various durations all expressed OPN with 3 week culture expressing the highest levels. Therefore, while OPN may serve as a marker for determining whether a cell is in the OB lineage, by itself, it does not provide insight as to the specific stage of differentiation of an OB lineage cell. Our group used a cocktail of these markers to prospectively isolate phenotypically defined populations of OB but were unable to segregate the hematopoiesis enhancing activity of OB into a specific group of cells (Chitteti et al., in press). These data suggest that, at present, the hematopoiesis enhancing activity of OB cannot be separated even among OB within a single maturational stage.
Because of the limited knowledge of cell surface markers able to characterize specific stages of OB lineage, we approached determining which OB lineage cells are most important for maintenance and expansion of hematopoietic cells from a different standpoint: by analyzing the functional behavior of OB. Here, we measured alkaline phosphatase activity and calcium deposition as a marker for mineralization. As detailed above, the initial alkaline phosphatase and calcium deposition levels were both significantly and inversely associated with hematopoietic cell number fold increase. Likewise, final calcium deposition levels were inversely associated with all of the HPC parameters tested. As calcium deposition generally increases with OB maturation (Gerstenfeld et al., 1987), and since higher calcium deposition was associated with lower hematopoietic proliferation and function, our data seem to suggest that less mature, or early stage OB lineage cells, better promote HPC properties compared to more differentiated/mature OB lineage cells. Our real-time PCR data corroborated our calcium deposition data illustrating the 3 week OB cultures (4 weeks cumulative OB culture duration) contain more mature OB in comparison to freshly isolated OB cultures.
It should be noted that our measurement of calcium deposition is a marker for the mineralization occurring in newly formed osteoid bone matrix. Calcium and phosphate form hydroxyapatite crystals which is the mineral content of bone. Our data are not inconsistent with those presented by Adams et al (Adams et al., 2006). They suggest that preferential localization of stem cells in the endosteal region of the bone marrow microenvironment is likely due to the high concentration of calcium in this niche as HSC express a calcium sensing receptor (Adams et al., 2006). Indeed, it is well understood that one of the functions of the skeleton is to provide a reservoir of minerals such as calcium and phosphate (COPP and SHIM, 1963), and through bone remodeling, osteoclasts release these minerals under the control of various stimuli to maintain homeostasis (Raisz,1999). The calcium that is freed by bone resorption through osteoclastic activity is bioavailable; however, the calcium we measured in these studies is not free calcium such as that described by Adams et al (Adams et al., 2006) and is therefore not bioavailable but is rather a component of the mineral matrix of bone. These levels of calcium are more reflective of the OB stage of differentiation.
We also tested whether less mature or early stage OB lineage cells are better at enhancing HPC properties by examining the effects of culture duration. Because OB generally mature with culture duration (Gerstenfeld et al., 1987), more mature cells would typically be present in older cultures. Similar to the calcium deposition data, we saw an inverse relationship where the higher hematopoietic and clonogenic cell number and function were associated with shorter culture durations. In these experiments, OB maintained in long-term cultures would have undergone multiple cell doublings as well as matured. Therefore, to determine whether the cell number could explain the observed relationships (i.e. whether due to large numbers of OB cells, LSK cells were deprived of nutrients and thus unable to proliferate and function as well), we maintained, in parallel cultures, OB for 1, 2, or 3 weeks, trypsinized these cells and then reseeded them at the same starting concentrations as was used for freshly prepared OB. Results from these experiments demonstrated that as culture duration increased (cumulative culture duration pre and post trypsin), HPC proliferation and function decreased. Since in these experiments the number of plated OB was identical, the main difference is in the maturation of the OB cells themselves. Thus, these data are suggestive that early stage OB lineage cells are better at enhancing HPC properties than are later stage OB lineage cells.
To further demonstrate that stage of OB maturation is associated with hematopoietic cell expansion and function, we characterized the expression of several OB-related genes: Runx2, alkaline phosphatase, type I collagen, OPN, and osteocalcin and compared expression levels to hematopoietic parameters. As detailed in Figure 7, our real-time PCR data supports the idea that OB maturation increases with culture duration. With regard to OPN, it is important to note that our data are consistent with previous work demonstrating that OPN inhibits HSC differentiation (Nilsson et al., 2005; Stier et al., 2005) as we see that OB expressing the highest levels of OPN (3 week cultures or 4 weeks cumulative OB culture duration) least support hematopoietic properties. Further, our data also demonstrate that OB cultures expressing high levels of Runx2 (early stage OB lineage cells) better promote hematopoietic proliferation and function than do cultures expressing lower levels of Runx2 (more mature OB lineage cells).
Finally, these in vitro data were supported by in vivo bone marrow repopulation studies. As differences in the in vitro hematopoietic properties were highest between fresh and 3 week OB, we chose these culture durations for our in vivo studies and found that fresh OB supported an average 7.4 fold higher level of chimerism than did 3 week OB. Of importance, these in vivo data provide strong support of our assertion that early stage OB better support hematopoietic function than do more mature OB.
Although it is generally taken for granted that hematopoiesis in the adult takes place in long bones, flat bones are also hematopoietically active in the adult. This leaves the question as to whether our results obtained with OB collected from neonatal calvariae can be replicated with OB from long bones. While all of our data presented here are generated using neonatal calvarial OB, we previously demonstrated that OB derived from both long bones and calvariae of neonatal and young adult mice resulted in enhancement of the same hematopoietic properties studied here (Chitteti et al., in press). That being said, the question of whether OB from different sites can support hematopoiesis is relevant especially in view of the recent publication by Chan et al. (Chan et al., 2009) in which fetal 14.5 d.p.c. CD105+Thy1- cells from long bones but not from mandibular and calvarial bones gave rise to marrow-containing niche when transplanted under the kidney capsula of adult recipient mice. The authors argued that niche progenitors from bones that cannot undergo endochodral ossification (e.g. calvarial bones) fail to develop into a marrow-containing niche. While these results await further confirmation, it is important to point out that calvariae and other flat bones are indeed active sites of hematopoiesis. In fact, harvesting of donor BM-derived HSC for clinical transplantation is performed from the iliac crest demonstrating that the hematopoietic niche in these bones can sustain and produce functionally active long-term repopulating stem cells.
Additional support for the notion that OB from both long bones as well as calvariae are functionally similar and critical for the formation of the hematopoietic niche was also recently demonstrated by two similar in vivo studies (Xie et al., 2009; Lo Celso et al., 2009). In their studies they highlighted the intimate interactions between HSC and OB in the transplantation setting (Xie et al., 2009) as well as in response to physiological challenges (Lo Celso et al., 2009). Furthermore, a “hierarchical” order of interaction between OB and hematopoietic cells depending on their stage of differentiation as was also demonstrated by Kohler et al (Kohler et al., 2009) for aged versus young early HPC.
In summary, our study demonstrated that calvarial OB support hematopoietic progenitor proliferation and function and has begun to narrow which OB lineage cells are best at enhancing HPC proliferation and function; early stage or less mature OB. The knowledge gained from these experiments can be used to enhance in vitro expansion of HSC for possible clinical applications. Future studies can focus on identifying cell markers specific to early stage or less mature OB, as compared to all OB lineage cells, for the optimization of HSC culture systems and for a more detailed understanding of the molecular interaction between OB and HSC in the hematopoietic niche.
Acknowledgments
This work was sponsored in part by the Department of Orthopaedic Surgery at Indiana University School of Medicine and by NIH grant R01 HL55716 (EFS). The authors wish to thank Dr. Andre van Wijnen for providing Runx2 and OPN primers. The authors wish to also thank the personnel of the Flow Cytometry Resource Facility of the Indiana University Melvin and Bren Simon Cancer Center (NCI P30 CA082709).
References
- Adams GB, Chabner KT, Alley IR, Olson DP, Szczepiorkowski ZM, Poznansky MC, Kos CH, Pollak MR, Brown EM, Scadden DT. Stem cell engraftment at the endosteal niche is specified by the calcium-sensing receptor. Nature. 2006;439:599–603. doi: 10.1038/nature04247. [DOI] [PubMed] [Google Scholar]
- Arai F, Nakamura Y, Gomei Y, Suda T. Characterization of the niche complex molecules in bone marrow. Exp Hematol. 2008;36:S25. [Google Scholar]
- Brooke G, Tong H, Levesque JP, Atkinson K. Molecular trafficking mechanisms of multipotent mesenchymal stem cells derived from human bone marrow and placenta. Stem Cells Dev. 2008;17:929–940. doi: 10.1089/scd.2007.0156. [DOI] [PubMed] [Google Scholar]
- Calvi LM, Adams GB, Weibrecht KW, Weber JM, Olson DP, Knight MC, Martin RP, Schipani E, Divieti P, Bringhurst FR, Milner LA, Kronenberg HM, Scadden DT. Osteoblastic cells regulate the haematopoietic stem cell niche. Nature. 2003;425:841–846. doi: 10.1038/nature02040. [DOI] [PubMed] [Google Scholar]
- Chan CK, Chen CC, Luppen CA, Kim JB, DeBoer AT, Wei K, Helms JA, Kuo CJ, Kraft DL, Weissman IL. Endochondral ossification is required for haematopoietic stem-cell niche formation. Nature. 2009;457:490–494. doi: 10.1038/nature07547. [DOI] [PMC free article] [PubMed] [Google Scholar]
- Chitteti BR, Cheng YH, Poteat B, Rodriguez-Rodriguez S, Goebel S, Carlesso N, Kacena MA, Srour EF. Impact of interactions of cellular components of the bone marrow microenvironment on hematopoietic stem and progenitor cell function. doi: 10.1182/blood-2009-09-246173. in press. [DOI] [PMC free article] [PubMed] [Google Scholar]
- Ciovacco WA, Goldberg CG, Taylor AF, Lemieux JM, Horowitz MC, Donahue HJ, Kacena MA. The role of gap junctions in megakaryocyte-mediated osteoblast proliferation and differentiation. Bone. 2009;44:80–86. doi: 10.1016/j.bone.2008.08.117. [DOI] [PMC free article] [PubMed] [Google Scholar]
- Copp DH, Shim SS. The homeostatic function of bone as a mineral reservoir. Oral Surg Oral Med Oral Pathol. 1963;16:738–744. doi: 10.1016/0030-4220(63)90081-1. [DOI] [PubMed] [Google Scholar]
- Danet GH, Lee HW, Luongo JL, Simon MC, Bonnet DA. Dissociation between stem cell phenotype and NOD/SCID repopulating activity in human peripheral blood CD34(+) cells after ex vivo expansion. Exp Hematol. 2001;29:1465–1473. doi: 10.1016/s0301-472x(01)00750-0. [DOI] [PubMed] [Google Scholar]
- Eto T, Winkler I, Purton LE, Levesque JP. Contrasting effects of P-selectin and E-selectin on the differentiation of murine hematopoietic progenitor cells. Exp Hematol. 2005;33:232–242. doi: 10.1016/j.exphem.2004.10.018. [DOI] [PubMed] [Google Scholar]
- Gerstenfeld LC, Chipman SD, Glowacki J, Lian JB. Expression of differentiated function by mineralizing cultures of chicken osteoblasts. Dev Biol. 1987;122:49–60. doi: 10.1016/0012-1606(87)90331-9. [DOI] [PubMed] [Google Scholar]
- Horowitz MC, Fields A, DeMeo D, Qian HY, Bothwell AL, Trepman E. Expression and regulation of Ly-6 differentiation antigens by murine osteoblasts. Endocrinology. 1994;135:1032–1043. doi: 10.1210/endo.135.3.7520861. [DOI] [PubMed] [Google Scholar]
- Hughes FJ, Aubin JE. Culture of Cells of the Osteoblast Lineage. 1998. pp. 1–49. [Google Scholar]
- Jilka RL, Cohn DV. Role of phosphodiesterase in the parathormone-stimulated adenosine 3′,5′-monophosphate response in bone cell populations enriched in osteoclasts and osteoblasts. Endocrinology. 1981;109:743–747. doi: 10.1210/endo-109-3-743. [DOI] [PubMed] [Google Scholar]
- Jung Y, Wang J, Havens A, Sun Y, Wang J, Jin T, Taichman RS. Cell-to-cell contact is critical for the survival of hematopoietic progenitor cells on osteoblasts. Cytokine. 2005;32:155–162. doi: 10.1016/j.cyto.2005.09.001. [DOI] [PubMed] [Google Scholar]
- Kalajzic I, Kalajzic Z, Hurley MM, Lichtler AC, Rowe DW. Stage specific inhibition of osteoblast lineage differentiation by FGF2 and noggin. J Cell Biochem. 2003;88:1168–1176. doi: 10.1002/jcb.10459. [DOI] [PubMed] [Google Scholar]
- Kiel MJ, Morrison SJ. Uncertainty in the niches that maintain haematopoietic stem cells. Nat Rev Immunol. 2008;8:290–301. doi: 10.1038/nri2279. [DOI] [PubMed] [Google Scholar]
- Kohler A, Schmithorst V, Filippi MD, Ryan MA, Daria D, Gunzer M, Geiger H. Altered cellular dynamics and endosteal location of aged early hematopoietic progenitor cells revealed by time-lapse intravital imaging in long bones. Blood. 2009;114:290–298. doi: 10.1182/blood-2008-12-195644. [DOI] [PMC free article] [PubMed] [Google Scholar]
- Kopp HG, Avecilla ST, Hooper AT, Rafii S. The bone marrow vascular niche: home of HSC differentiation and mobilization. Physiology (Bethesda) 2005;20:349–356. doi: 10.1152/physiol.00025.2005. [DOI] [PubMed] [Google Scholar]
- Krause C, de Gorter DJJ, Karperien M, ten Dijke P. Chapter 2. Signal Transduction Cascades Controlling Osteoblast Differentiation. 2008. pp. 10–16. [Google Scholar]
- Ladd AC, Pyatt R, Gothot A, Rice S, McMahel J, Traycoff CM, Srour EF. Orderly process of sequential cytokine stimulation is required for activation and maximal proliferation of primitive human bone marrow CD34+ hematopoietic progenitor cells residing in G0. Blood. 1997;90:658–668. [PubMed] [Google Scholar]
- Lian JB, Javed A, Zaidi SK, Lengner C, Montecino M, van Wijnen AJ, Stein JL, Stein GS. Regulatory controls for osteoblast growth and differentiation: role of Runx/Cbfa/AML factors. Crit Rev Eukaryot Gene Expr. 2004;14:1–41. [PubMed] [Google Scholar]
- Lo Celso C, Fleming HE, Wu JW, Zhao CX, Miake-Lye S, Fujisaki J, Cote D, Rowe DW, Lin CP, Scadden DT. Live-animal tracking of individual haematopoietic stem/progenitor cells in their niche. Nature. 2009;457:92–96. doi: 10.1038/nature07434. [DOI] [PMC free article] [PubMed] [Google Scholar]
- Mayack SR, Wagers AJ. Osteolineage niche cells initiate hematopoietic stem cell mobilization. Blood. 2008;112:519–531. doi: 10.1182/blood-2008-01-133710. [DOI] [PMC free article] [PubMed] [Google Scholar] [Retracted]
- McCarty RC, Gronthos S, Zannettino AC, Foster BK, Xian CJ. Characterisation and developmental potential of ovine bone marrow derived mesenchymal stem cells. J Cell Physiol. 2009;219:324–333. doi: 10.1002/jcp.21670. [DOI] [PubMed] [Google Scholar]
- Mundlos S. Cleidocranial dysplasia: clinical and molecular genetics. J Med Genet. 1999;36:177–182. [PMC free article] [PubMed] [Google Scholar]
- Nilsson SK, Johnston HM, Coverdale JA. Spatial localization of transplanted hemopoietic stem cells: inferences for the localization of stem cell niches. Blood. 2001;97:2293–2299. doi: 10.1182/blood.v97.8.2293. [DOI] [PubMed] [Google Scholar]
- Nilsson SK, Johnston HM, Whitty GA, Williams B, Webb RJ, Denhardt DT, Bertoncello I, Bendall LJ, Simmons PJ, Haylock DN. Osteopontin, a key component of the hematopoietic stem cell niche and regulator of primitive hematopoietic progenitor cells. Blood. 2005;106:1232–1239. doi: 10.1182/blood-2004-11-4422. [DOI] [PubMed] [Google Scholar]
- Otto F, Thornell AP, Crompton T, Denzel A, Gilmour KC, Rosewell IR, Stamp GW, Beddington RS, Mundlos S, Olsen BR, Selby PB, Owen MJ. Cbfa1, a candidate gene for cleidocranial dysplasia syndrome, is essential for osteoblast differentiation and bone development. Cell. 1997;89:765–771. doi: 10.1016/s0092-8674(00)80259-7. [DOI] [PubMed] [Google Scholar]
- Raisz LG. Physiology and pathophysiology of bone remodeling. Clin Chem. 1999;45:1353–1358. [PubMed] [Google Scholar]
- Schofield R. The relationship between the spleen colony-forming cell and the haemopoietic stem cell. Blood Cells. 1978;4:7–25. [PubMed] [Google Scholar]
- Schroeder TM, Jensen ED, Westendorf JJ. Runx2: a master organizer of gene transcription in developing and maturing osteoblasts. Birth Defects Res C Embryo Today. 2005;75:213–225. doi: 10.1002/bdrc.20043. [DOI] [PubMed] [Google Scholar]
- Semerad CL, Christopher MJ, Liu F, Short B, Simmons PJ, Winkler I, Levesque JP, Chappel J, Ross FP, Link DC. G-CSF potently inhibits osteoblast activity and CXCL12 mRNA expression in the bone marrow. Blood. 2005;106:3020–3027. doi: 10.1182/blood-2004-01-0272. [DOI] [PMC free article] [PubMed] [Google Scholar]
- Simmons DJ, Kent GN, Jilka RL, Scott DM, Fallon M, Cohn DV. Formation of bone by isolated, cultured osteoblasts in millipore diffusion chambers. Calcif Tissue Int. 1982;34:291–294. doi: 10.1007/BF02411253. [DOI] [PubMed] [Google Scholar]
- Srour EF, Tong X, Sung KW, Plett PA, Rice S, Daggy J, Yiannoutsos CT, Abonour R, Orschell CM. Modulation of in vitro proliferation kinetics and primitive hematopoietic potential of individual human CD34+CD38-/lo cells in G0. Blood. 2005;105:3109–3116. doi: 10.1182/blood-2004-05-1773. [DOI] [PubMed] [Google Scholar]
- Stanford CM, Jacobson PA, Eanes ED, Lembke LA, Midura RJ. Rapidly forming apatitic mineral in an osteoblastic cell line (UMR 106-01 BSP) J Biol Chem. 1995;270:9420–9428. doi: 10.1074/jbc.270.16.9420. [DOI] [PubMed] [Google Scholar]
- Stein GS, Lian JB. Molecular mechanisms mediating proliferation/differentiation interrelationships during progressive development of the osteoblast phenotype. Endocr Rev. 1993;14:424–442. doi: 10.1210/edrv-14-4-424. [DOI] [PubMed] [Google Scholar]
- Stier S, Ko Y, Forkert R, Lutz C, Neuhaus T, Grunewald E, Cheng T, Dombkowski D, Calvi LM, Rittling SR, Scadden DT. Osteopontin is a hematopoietic stem cell niche component that negatively regulates stem cell pool size. J Exp Med. 2005;201:1781–1791. doi: 10.1084/jem.20041992. [DOI] [PMC free article] [PubMed] [Google Scholar]
- Taichman RS. Blood and bone: two tissues whose fates are intertwined to create the hematopoietic stem-cell niche. Blood. 2005;105:2631–2639. doi: 10.1182/blood-2004-06-2480. [DOI] [PubMed] [Google Scholar]
- Taichman RS, Emerson SG. Human osteoblasts support hematopoiesis through the production of granulocyte colony-stimulating factor. J Exp Med. 1994;179:1677–1682. doi: 10.1084/jem.179.5.1677. [DOI] [PMC free article] [PubMed] [Google Scholar]
- Wilson A, Oser GM, Jaworski M, Blanco-Bose WE, Laurenti E, Adolphe C, Essers MA, Macdonald HR, Trumpp A. Dormant and self-renewing hematopoietic stem cells and their niches. Ann N Y Acad Sci. 2007;1106:64–75. doi: 10.1196/annals.1392.021. [DOI] [PubMed] [Google Scholar]
- Wong GL, Cohn DV. Target cells in bone for parathormone and calcitonin are different: enrichment for each cell type by sequential digestion of mouse calvaria and selective adhesion to polymeric surfaces. Proc Natl Acad Sci U S A. 1975;72:3167–3171. doi: 10.1073/pnas.72.8.3167. [DOI] [PMC free article] [PubMed] [Google Scholar]
- Xie Y, Yin T, Wiegraebe W, He XC, Miller D, Stark D, Perko K, Alexander R, Schwartz J, Grindley JC, Park J, Haug JS, Wunderlich JP, Li H, Zhang S, Johnson T, Feldman RA, Li L. Detection of functional haematopoietic stem cell niche using real-time imaging. Nature. 2009;457:97–101. doi: 10.1038/nature07639. [DOI] [PubMed] [Google Scholar]
- Yee NS, Hsiau CW, Serve H, Vosseller K, Besmer P. Mechanism of down-regulation of c-kit receptor. Roles of receptor tyrosine kinase, phosphatidylinositol 3′-kinase, and protein kinase C. J Biol Chem. 1994;269:31991–31998. [PubMed] [Google Scholar]
- Zhang J, Niu C, Ye L, Huang H, He X, Tong WG, Ross J, Haug J, Johnson T, Feng JQ, Harris S, Wiedemann LM, Mishina Y, Li L. Identification of the haematopoietic stem cell niche and control of the niche size. Nature. 2003;425:836–841. doi: 10.1038/nature02041. [DOI] [PubMed] [Google Scholar]
- Zhu J, Emerson SG. A new bone to pick: osteoblasts and the haematopoietic stem-cell niche. Bioessays. 2004;26:595–599. doi: 10.1002/bies.20052. [DOI] [PubMed] [Google Scholar]