Abstract
A simulation is presented here that serves the dual functions of generating a nanoporous membrane replica and executing the Brownian motion of nanoparticles through the virtual membrane. Specifically, the concentration profile of a dilute solution of fluorescent particles in a stochastic and SiO2-coated carbon nanofiber (oxCNF), nanoporous membrane was simulated. The quality of the simulated profile was determined by comparing the results with experimental concentration profiles. The experimental concentration profiles were collected adjacent to the oxCNF membrane surface from time-lapse fluorescence microscopy images. The simulation proved ideal as an accurate predictor of particle diffusion—the simulated concentration profile merged with the experimental profiles at the inlet/exit surfaces of the oxCNF membrane. In particular, the oxCNF barrier was found to hinder the transport of 50 and 100 nm particles and transmembrane trajectories were indicative of anomalous subdiffusion; the diffusion coefficient was found to be a function of time and space.
1. Introduction
Understanding and controlling the transport of particles and molecules in solution becomes increasingly difficult as the scale of the confinement system decreases. For example, tailoring nanoscale transport in microfluidic devices requires accurate feature deposition, precisely etched fluidic pathways, and emphasis on reducing the number of defects in order to achieve the requisite control. In addition, the effects of solute–surface interactions and imperfections are amplified at the nanoscale forcing account for such features in design. The multiple length scale integration of microcomponents and nanocomponents further complicates the fabrication scheme. Moreover, the number of characterization techniques available for evaluating performance at the nanoscale is reduced. These challenges emphasize the importance of alternative approaches, designs, and diagnostics for preparation of the next generation of practical nanoscale components and devices for fluidic applications.
The combination of synthetic membrane structures and microfluidic elements can provide size-selective transport and controlled particle/molecule release rates. These structures are critical to the development of devices for controlled drug release, small volume (nL–pL) reaction containment, and nanofluidics applications. Some modern approaches to integrating synthetic membrane materials with microfluidic structures include the use of carbon nanotubes [1–9], polymer gels [10, 11], porous alumina [12] and polycarbonate membranes [13]. Self-assembled monolayers of alkanethiols on gold coated porous polycarbonate track-etched membranes have produced sub-10 nm nanopores where the flux of biologically relevant amino acids was controlled via charged nanopores [14]. Control over the flow of neutral species has also been demonstrated by implementing electrostatically driven chemical switching to render nanopores hydrophobic, thus selectively transmitting hydrophobic species [15]. The precise control of nanopore geometry has also been recently demonstrated [16]. We have explored carbon nanofiber (CNF) structures as a potential synthetic membrane material. CNF morphology varies from curved graphene layers to stacked nanocones depending on growth conditions. The internal nanofiber structure may be characterized according to the angle (α) between the graphene sheet and longitudinal fiber axis [17]. CNFs are not to be confused with carbon nanotubes (CNTs, α = 0) which are physically as well as chemically distinct from CNFs [17]. CNFs have demonstrated specific membrane functional aspects including size-selective permeability and sorting [18–20] as well as chemical compatibility [21] while exhibiting the required mechanical robustness to integrate with microfabrication processes.
CNF membranes are fabricated by growing a stochastic array of CNFs in desired locations on a silicon wafer. The nanofibers grow orthogonal to the substrate surface and are distributed spatially in the form of a randomly distributed forest. The space between individual CNFs acts as a porous network for affecting transport of molecules or particles in a direction perpendicular to the CNF axes. The CNF growth process and the various uses of CNFs have been reviewed [22]. Alternatively, individual CNFs can be patterned using advanced lithography techniques. Control over nanofiber diameter, shape, growth velocity, and internal structure have been demonstrated, making the nanofibers an ideal platform for tailoring membrane properties [23–29]. Further, the permeability of CNF membranes has been successfully reduced by constricting the interCNF space through coating CNF surfaces with a conformal coating of SiO2 [20]. Dynamic physical modulation of CNF membrane permeability has also been demonstrated using an electrically addressable, conformal and actuatable polymer, polypyrolle [30]. The ability to control the sorting properties of the membrane is essential for adapting these membranes for various applications.
A random walk, Monte Carlo based simulation has been written and tested for characterizing passive transport across CNF membranes. Here, the details of this program are presented and simulation results are compared with experimental results. Aspects of the simulation have been introduced previously [31] such as the emulation of fluorescence recovery after photobleaching (FRAP) experiments of fluorescent dyes and particles within CNF membranes. The program contains two central components: a main program that simulates diffusion and a subprogram for virtual CNF generation. The specific case examined here is the diffusion of small (50 nm) solute particles across a nanoporous oxCNF membrane. The ability to simulate such experiments is especially useful for guiding the design and fabrication of nanoscale membranes of specified performance and for reducing experimental iteration. Further, the simulation provides virtual access to the opaque, nanoscale interior of CNF membranes. Here, the performance of simulation experiments is evaluated by examining its ability to predict the experimentally observed flux of particles across the oxCNF membrane. The simulation results reveal the anomalous sub-diffusion [32–40] in the volume crowded oxCNF membrane while satisfying the criteria of matching the solute concentration at the exit surface of the membrane within experimental error.
2. Background
2.1. Simulation details
2.1.1. The type of random walk
A random walk model was chosen to simulate the thermally driven, random motion exhibited by suspended, solute particles in a continuous, liquid solvent. The program was written and compiled in the Matlab® (The Mathworks, Inc., Natick, MA) computing environment. A collection of virtual particles execute a non-self-avoiding random walk in a finite, discretized simulation domain. Virtual particles have no memory of their previous positions as an adjacent vacant lattice site is a probable jump site even if it has been previously occupied by the particle. This is the main assumption of the non-self-avoiding random walk and is a central feature of the random walk method as discrete movements are unbiased.
2.1.2. The random walk simulation domain
The simulation domain that supports the walk process consists of a 3D cubic lattice on which virtual particles execute random walk motion a total distance of Δs, the spacing between adjacent lattice points, per time increment Δt. A jump is executed by selecting at random a nearest neighbor site, and then moving the particle to the new site based on the random selection. The particle reflects back to its current position in the event that the randomly chosen voxel is occupied. The time increment per jump is calculated using the random walk equation
| (1) |
where Do is the molecular diffusion coefficient and is the link between the spatial and temporal components of the simulation. Do is either obtained from the literature or calculated using the Stokes–Einstein relation and is the value that represents the diffusion of the solute of interest under dilute conditions. The solvent is represented in the simulation as the cubic lattice domain ‘continuum’ where solute–solvent interactions are neglected. It is assumed that the interaction of solvent and solute is negligible for dilute, uncharged solutions when the solute size ≫ solvent size. The jump increment Δs is selected by the user and should be chosen such that Δt is significantly less than the estimated time between steric interactions. In other words, if a collection of obstacles resides in the simulation domain then Δt must be significantly less than the time required to diffuse a distance equal to the average spacing between obstacles. However, simulation runs must also be time efficient; therefore an accurate, yet computationally economical value of Δt must be selected.
2.1.3. Solute–obstacle interactions
A distribution of obstacles that mimics the morphology and density of CNFs is placed in the simulation domain to determine their effect on solute diffusion. This requires that solute–obstacle interactions be incorporated in the simulation considering that the occupied volume of CNF obstacles in the simulation domain reached 70–80% for some real experiments. A diffusing particle encounters a surface when a nearest neighbor, potential jump site is occupied by a CNF voxel. Diffusing particles may either reflect off CNF sites or bind to them. In both cases, if an adjacent lattice site is occupied by a CNF voxel that site is registered. Subsequently, if that voxel is selected as the jump site for the diffusing particle an additional test, for the case of binding, is performed to determine whether the particle binds to the surface. No evidence of particle binding was detected when fitting, by simulation, results derived from time-lapse fluorescence microscopy experiments (however, an interaction was resolved when photobleaching experiments were conducted).
2.1.4. CNF obstacle generation
Real, stochastic CNF forests are grown by a metal catalyst-assisted, PECVD process [22]. Catalyst nanocrystals are formed by the ion-assisted, thermal dewetting of a thin (<50 nm) metal film into a random distribution of nanocrystals. The simulation generates a random distribution of surface pixels to position CNFs according to the experimentally observed CNF surface density determined from SEM images.
Virtual CNFs are generated by random sampling from statistical distributions of CNF structural properties. CNF physical property data including diameter, tilt, surface density, and height are assessed and collected by SEM analysis. A histogram is generated for each of these variables.
CNF shape is handled differently than the other physical properties listed above. CNF shape is also evaluated by SEM analysis but a 2D mathematical function is used to define the shape as opposed to a distribution. Once a function is selected it is then modulated for each CNF according to the diameter and height selected from the aforementioned distributions. The 2D function is then rotated about the CNF tilt axis to form a 3D nanofiber replica. The CNF is added to the simulation domain by centering the base of the virtual CNF at a surface catalyst site (surface pixel) and then inserting the CNF into the domain. The conformal SiO2 coating is applied to the virtual CNF by a simple dilation that also accounts for the merging of closely spaced CNFs for the condition of thick oxide coatings.
2.1.5. Mean-square displacement (MSD) calculation
The MSD is calculated only for particles that diffuse across the CNF membrane. This ensures that the accumulated MSD data represents transmembrane diffusion in and across the interCNF space only. Central to the calculation is storing in memory the displacement of each particle as a function of time. This data is stored either for each individual particle jump, or in the instance where a large number of particles are being simultaneously tracked, at some multiple (Δn) of the time step (Δt), Δn × Δt. The MSD data is calculated from the stored displacement coordinates using the following expression, e.g., for the transmembrane, x-direction,
| (2) |
where rx (t) is the distance from the origin to the particle’s current position in the x-direction, ΔnΔt is the increment selected to sample the MSD for memory storage (Δn is an integer), and where m runs over the following range:
| (3) |
The apparent diffusion coefficient for the transmembrane direction Da(x, t) may then be calculated from the MSD
| (4) |
and for the case of anomalous subdiffusion where Do > Da (x, t > 0) the diffusive mobility is reduced due to a significant concentration of obstacles in the diffusive volume [37, 38].
3. Experiments and simulations
3.1. Simulation procedure
3.1.1. Illustrative description of the simulation procedure
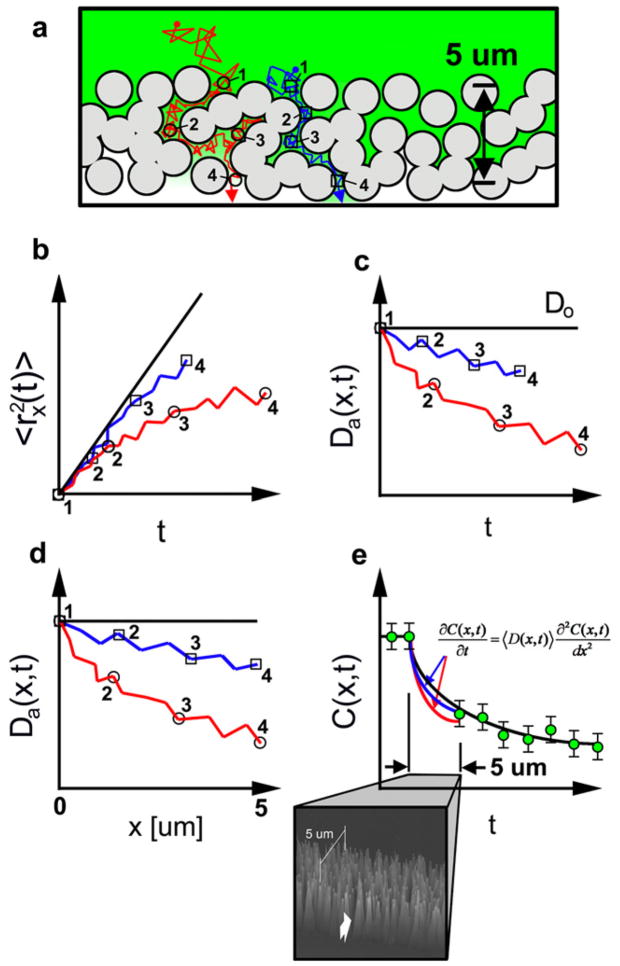
Anomalous subdiffusion and the simulation procedure are best understood by considering an illustrative example. Figure 1(a) shows two sample trajectories through an oxCNF membrane. The trajectories differ significantly due to their transport through different membrane pores. The red particle traverses a more tortuous pathway through the membrane and hence spends a longer time in the oxCNF membrane relative to the blue trajectory. The Monte Carlo simulation tracks the value of 〈rx (t)2〉 per particle while the virtual particles are traversing the oxCNF membrane. The MSD trajectories are presented in a cumulative plot when the simulation is completed. Multiple particles walk concurrently in the simulation domain; however, they enter the oxCNF membrane at different, random times. In order to compare trajectories each 〈rx (t)2〉 versus t trajectory is shifted in the time coordinate such that t = 0 s corresponds to the instant that a particle enters the membrane. Figure 1(b) illustrates this methodology when applied to the two trajectories displayed in figure 1(a). A Fickian trajectory characteristic of particle diffusion in an obstacle-free environment is superimposed on figure 1(b) (solid black line).
Figure 1.
A schematic illustration of the procedure used to simulate transport in the CNF membrane. (a) The 5 μm thick CNF membrane (viewed down the nanofiber axis) consists of CNFs of d ~ 200 nm coated with ~750 nm of SiO2 to increase the average nanofiber diameter to d = 1.7 μm and these are represented as the circular structures in the image. Two individual Monte Carlo simulated diffusion trajectories through the membrane are shown: a tortuous one (grey (red)) and a less tortuous one (black (blue)). A Monte Carlo simulation is also used to generate the position, taper, tilt, and morphology of each CNF constituting the membrane. (b) The anomalous, mean-square displacement (MSD) of each trajectory through the CNF membrane. The superimposed black trajectory shows the average MSD for such particles in an unhindered domain. (c) The apparent diffusion coefficient 〈Da(x, t) 〉 of each trajectory as a function of time while in the membrane. (d) 〈Da(x, t) 〉 of each trajectory as a function of transmembrane axis. (e) The concentration profile through the CNF membrane is simulated by solving the Smoluchowski equation with 〈Da(x) 〉 in the CNF membrane using the finite difference approximation. The concentration profile of both red and blue trajectories in the CNF membrane merge with experimental data on the other side of the membrane, the required characteristic of an accurate simulation. Moreover, the black fit of unhindered diffusion in the cell interior, when extrapolated back into the CNF membrane, overestimates diffusion in the CNF membrane. This should be expected as the CNFs hinder transport through particle–CNF interactions.
Anomalous subdiffusion is observed for both the red and blue trajectories. The steric hindrance imposed by the oxCNF membrane coupled with the local clustering of oxCNFs collectively act to induce the anomalous trajectories via particle collisions with the oxCNF surfaces. As a consequence of this hindered transport, a time-dependent diffusion coefficient results and this is shown in figure 1(c). These curves are calculated from the 〈r2〉 data using equation (4). In contrast, time-independent mobility is characteristic of the Fickian trajectory (solid black line, figure 1(c)). The reduced value of 〈Da(x, t) 〉 for the red trajectory reveals the more tortuous path encountered by this particle in its respective pore relative to the blue trajectory.
Figure 1(d) shows a plot of 〈Da(x, t) 〉 versus rx (t) for the trajectories—both terminate at 5 μm reflecting the thickness of the oxCNF membrane. The result is a reduced value of 〈Da(x, t) 〉 for the red trajectory, relative to the more direct route explored by the blue trajectory, reflecting the extended and multidimensional path explored by the red particle. The concentration profile in the oxCNF membrane is determined by using a 1D finite difference simulation to solve the Smoluchowski equation where Do is replaced by the more accurate 〈Da(x, t) 〉.
3.1.2. Correlating experiments with simulations
Time-lapse fluorescence microscopy measurements collected at the entry and exit surfaces of an oxCNF membrane provide experimental measures (figure 1(e), green data points) to correlate with simulations of diffusion across oxCNF membranes. A typical experiment maintains a constant concentration of dilute, fluorescent solute on the exterior surface of the oxCNF membrane (green data points left of oxCNF membrane, figure 1(e)) while the solute diffusion from across the membrane is recorded at various positions, orthogonal to the other membrane surface, over a series of time points (green data points right of oxCNF membrane, figure 1(e)). Nanoparticles diffuse to the exterior membrane surface to initiate experiments via a microchannel that is first wet and filled prior to nanoparticle introduction. Pressure driven fluid transport to the membrane was avoided in order to prevent convoluting the diffusion-based experiment with a convective component. After completion of the experiment, a 1D finite difference simulation program is executed using the 〈Da(x, t) 〉 versus rx (t) data collected from the random walk computer experiments. The simulated concentration is deemed valid if the simulated concentration profiles fit the experimental traces at the CNF membrane exit at all times.
It is important to note that the experimental concentration profile, collected at various times on the exit side of the membrane, is also fit to the analytical solution of spherical diffusion from a point source as an experimental control. Accurate fits in this region confirm the efficacy of the simulations as diffusion is not hindered in this region. Also, extrapolations of these solutions into the oxCNF membrane should overestimate the concentration there relative to the simulated concentration profile in the membrane (otherwise, for example, if the two profiles overlapped, they would indicate that the oxCNF membrane did not hinder transport).
3.2. Simulation parameters
3.2.1. Random walk parameters
Simulation parameters were selected to emulate experimental conditions. A diffusion coefficient of 3.0 × 10⁻¹⁰ cm2 s−1 was calculated for the 50 nm beads in 25%/V glycerol using the Stokes–Einstein equation. A time increment of Δt = 13.9 ms was used to simulate 1 × 10⁶ random walk jumps per trajectory. Fifty trajectories were simulated per experiment where the beads simultaneously impinged along 64 μm of membrane wall.
Ten such experiments were repeated per 64 μm segment of oxCNF membrane wall to reduce noise in the collected data. Collectively, a total of 1.92 mm of oxCNF membrane was explored for the entire computer experiment. Only trajectories that traversed the oxCNF membrane were stored in memory as 〈r(x, t)2〉 versus t data. The stored data was then converted into 〈Da(x, y, z)〉 versus t plots and ultimately 〈Da(x, t)〉 versus x data as described above.
3.2.2. Finite difference approximation
The concentration profile in the oxCNF membrane is determined by using a 1D explicit-type, marching process finite difference simulation to solve the Smoluchowski equation
| (5) |
where Do is replaced by 〈Da(x, t)〉 generated using the Monte Carlo, random walk simulation. The finite difference simulation domain was discretized into a Δx = 100 nm grid size with a temporal node size of Δt = 75 ms. The simulation was carried out to the maximum experimental time node.
3.3. Experimental diffusion measurements
3.3.1. Carbon nanofiber characteristics
Stochastic CNF forests were grown using a DC PECVD growth process from a patterned, square Ni catalyst grid supported in a Si wafer, cell mimic [19] microchannel. The grid had an edge dimension of 250 μm and line width of 5 μm. The CNFs were grown to an average height of 14.0 μm to protrude above the edge of the 12.0 μm Si microchannel. A conformal coating of SiO2 was then deposited, using the PECVD thin film growth process, on all surfaces of the chip producing a smooth, 750 nm coating. This increased the average nanofiber diameter from 200 nm to 1.7 μm. Conversely, the interCNF space was reduced to a network of sub-100 nm gaps with the SiO2 coating.
3.3.2. Fluorescence microscopy experiments
Fluorescence microscopy was used to characterize the rate of transport of fluorescently labeled latex nanoparticles across oxCNF membranes. A Carl Zeiss MicroImaging Axioskop 2 FS Plus microscope configured with a Fluoarc HBO-100 Hg arc lamp for fluorescent excitation and a Quantitative Imaging Corporation Qimaging Retiga EX CCD for image acquisition were used for fluorescence microscopy experiments. Fluoresbrite carboxylate microsphere solutions of homogeneous sizes (0.0459 ± 0.005 μm, 0.106 ± 0.013 μm, and 0.321 ± 0.008 μm) were acquired from Polysciences, Inc., and used as dilute, fluorescent probes for diffusion experiments. A series of images was captured as a function of time to monitor the diffusion of the fluorescently labeled latex beads from microchannel sources, across linear oxCNF membranes, into a separate microfluidic reservoir. Time-dependent concentration profiles were derived from the acquired data across the oxCNF membrane barrier. Special attention was paid to ensure that (1) the oxCNF membrane structure was properly sealed (the sealing process as well as the microfluidic device are described below), (2) the PBS buffer solution wet the entire structure homogeneously (i.e., to ensure that no air voids were present in the structure), and that (3) background subtractions and photobleaching corrections were applied to unsaturated, fluorescence data. The subtracted background fell within the range of 1.6–2.0% of the (1–255) full-scale, 8 bit range over all the experiments reported. An average photobleach rate of 0.5% per minute was observed for the 2 nM, 100 nm latex bead solution and photobleaching was undetected for the diluted 0.75 nM solution of 50 nm latex beads. Glycerol (25%/V) was present in the 50 nm bead solution to reduce the diffusion rate for improved resolution during fluorescence microscopy experiments. The PBS or PBS/glycerol solution rapidly filled the microfluidic device completely within t = 10–15 s. Proper priming of the microfluidic device with the PBS solution was determined by observing the motion of the air–PBS meniscus out of the device. The dissolved latex beads diffuse through the unrestricted microchannels to the exterior oxCNF membrane surface. Improper sealing of the oxCNF membrane was easily evaluated during the course of the time-lapse fluorescence microscopy experiments—the loss of a sharp, fluorescence boundary at the microchannel walls indicates that latex beads have leaked out of the device into a defective gap between the sealing lid and Si wafer substrate. Leaks at sites along oxCNF membranes occur when the cured polydimethylsiloxane PDMS lid delaminates from the oxCNFs as evidenced by the detection of any fluorescence across the membrane; transport through a sealed membrane should not be visible due to obstruction by the ox-CNFs.
3.3.3. Fluorescence recovery after photobleaching (FRAP) experiments
Nanoparticle–oxCNF binding may also affect the diffusion of nanoparticles across the oxCNF membrane in addition to the physical crowding effect of the oxCNFs. FRAP experiments were conducted to determine if the carboxylated nanoparticles bind to oxCNF surfaces. The exact details of the photobleaching equipment/set-up are described in detail elsewhere [31]. The physical geometry of the experiment is the same as those described above for characterizing membrane transport in a microfluidic channel except that the microchannel was filled completely with oxCNFs for the purpose of sampling a large area of oxCNFs. FRAP experiments were conducted using Fluoresbrite 50 nm carboxylated polystyrene nanoparticles and fluorescein dye (Sigma Chemical Co.); the later served as a non-bonding standard.
Briefly, for each FRAP experiment, a 40 μm × 40 μm region-of-interest (ROI), completely overlapping oxCNFs, was irradiated using a scanning laser probe (Leica TCS SP2 UV scanning 488 nm Ar+ probe, 50 mW ultraviolet, beam diameter ~1 μm) through an optically transparent PDMS sealing lid to irreversibly photobleach fluorescent molecules/nanoparticles present in solution between the oxCNFs. Intensity recovery into the ROI was acquired as a function of time (Δt = 416 ms). The rate of fluorescence recovery is fundamentally determined by either/both the effective diffusion coefficient of the fluorescent species or/and any binding interaction between the oxCNF surfaces and the fluorescent species. The effective diffusion coefficient as well as the binding parameters (kads and kdes) may then be extracted from the fluorescence recovery curves under certain conditions using both analytical [38, 41–43] and numerical methods [31, 44–46] (where kads and kdes are adsorption and desorption rate constants, respectively). In the event that the characteristic times for diffusion and binding are nearly equal, τD~τads/des, analysis of the recovery curve is non-trivial and best tackled by numerical methods. However, as was the case here, in the event that the characteristic diffusion time is significantly less than the mean desorption time, τD ≪ τdes, the rate of fluorescence recovery is determined purely by the rate of desorption of bleached and bound nanoparticles desorbing from the oxCNF surfaces that subsequently diffuse out of the ROI.
4. Results and discussion
4.1. Experimental fluorescence microscopy results
4.1.1. Diffusion of latex beads across CNF membranes
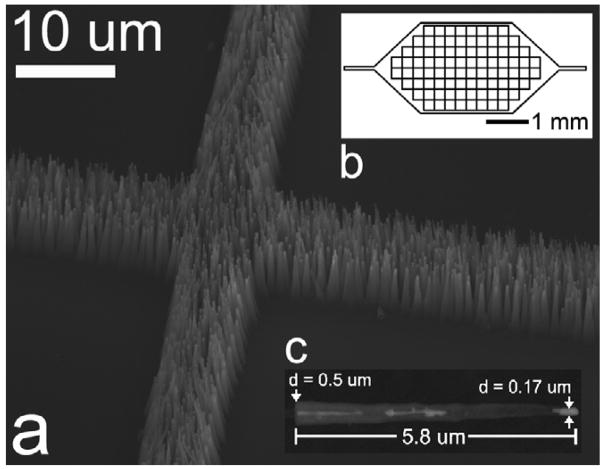
Experiments were performed to assess the transport rates of different sized latex beads across a common oxCNF membrane. Figure 2 displays drawings that aid in understanding the experimental configuration. The SEM image shows a CNF membrane node between four adjacent CNF enclosed volumes. A schematic diagram showing a top-down view of the CNF membrane microchannel design is presented in figure 2(b). An as-grown CNF that has been removed from the CNF membrane is shown in figure 2(c). A conformal coating of SiO2 was then deposited on the CNFs (thickness = 750 nm, fiber diameter = 1.7 μm) to move the size-selective threshold of the CNF membrane into the range of 50–100 nm so as to characterize the transport properties of the membrane in this size range. Previous computationally based simulations [20] have shown that a ‘leaky’ transport regime is expected for such an oxCNF membrane where transport through the membrane occurs periodically along the length of membrane as opposed to a uniform flux at all spatial locations.
Figure 2.
(a) An SEM image acquired at a tilted incidence showing the intersection of CNF membrane at the corner of four cell mimic structures. (b) A schematic diagram showing a top-down view of the cell mimic microchannel design. Fluid is introduced into the microchannel by the two etched extensions shown to the left and right in the schematic. (c) An individual CNF removed from the CNF membrane. This image was acquired midway through the CNF growth process; the CNFs were eventually grown to a final height of 14 μm. The image was taken before oxide deposition so the CNF forest morphology could clearly be seen.
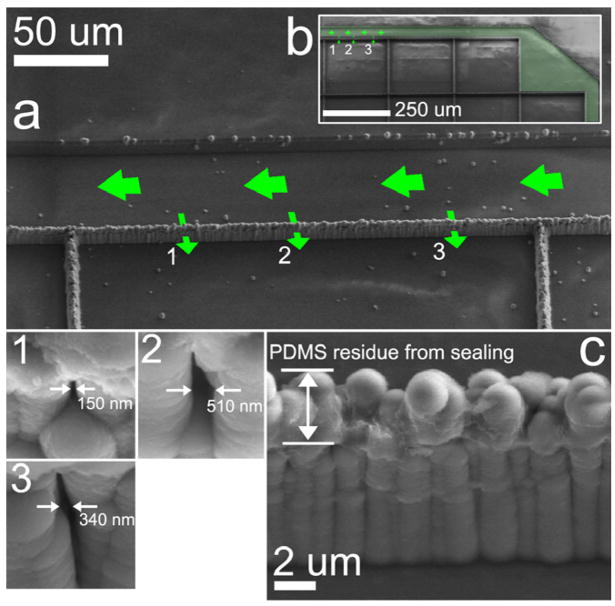
The SEM image in figure 3(a) shows a portion of the actual oxCNF membrane barrier where transport measurements, using 50 nm latex beads, were conducted. The artificially shaded region, superimposed over the image in figure 3(b), shows the fluid access pathway used to transport the fluorescent beads to the membrane barriers for transport measurements. These images were acquired following the completion of fluorescence microscopy experiments. Figure 3(c) shows that residual PDMS coats the tips of the oxCNFs where the lid was delaminated from the structure for SEM imaging after diffusion experiments were completed.
Figure 3.
(a) An SEM image of the specific length of membrane wall along which fluorescence microscopy characterization was conducted. 1, 2, and 3 indicate the locations in the CNF membrane wall from which 50 nm beads emerge; high-resolution SEM image insets show the exit surface nanopore morphologies. (c) The CNFs were coated with a conformal coating of oxide to reduce the size-selective property of the CNF membrane barrier to the size range of 50–100 nm. This image was collected following fluorescence experiments; the PDMS lid was delaminated to take the SEM image and PDMS residue is evident at the sealing tips of the oxCNFs.
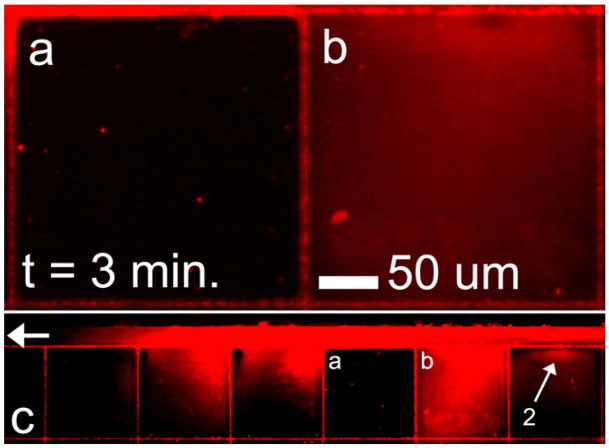
Time-lapse, fluorescence images were acquired on the PDMS sealed, oxCNF membrane device to monitor the diffusive transport across the oxCNF membrane barrier. The superimposed arrows over figure 3(a) show the direction of diffusion of the bead suspension solution to the specific oxCNF membrane segment where diffusion measurements were collected. One fluidic access microchannel (figure 2(b)) on the chip was monitored by fluorescence microscopy as it was filled with the fluorescent solution and this fluid was allowed to diffuse into the device for microchannel wetting; pressure driven flow was not required. During time-lapse fluorescence experiments, 50 nm beads were observed to radiate from locations in the oxCNF membrane indicated by the numerals 1, 2, and 3 in figure 3 and hence represent nanopores permeable to this bead size. The specific dimensions of the nanopore terminus on the cell interior side of the membrane were imaged and are shown as the numerically labeled, square insets in figure 3. The limiting aperture size of the each nanopore is unknown and may reside within the membrane. A non-permeable segment of the oxCNF membrane is shown in figure 3(c). The diffusion of 50 nm beads from the pores 1–3 is shown in the fluorescent micrographs displayed in figures 4(a), (b) at various times following the delivery of beads to this length of membrane (t = 0 s). It was found that the magnitude of transmembrane flux from each pore did not correlate with the pore exit size indicating that the unresolved, tortuous path in the oxCNF membrane must control transport.
Figure 4.
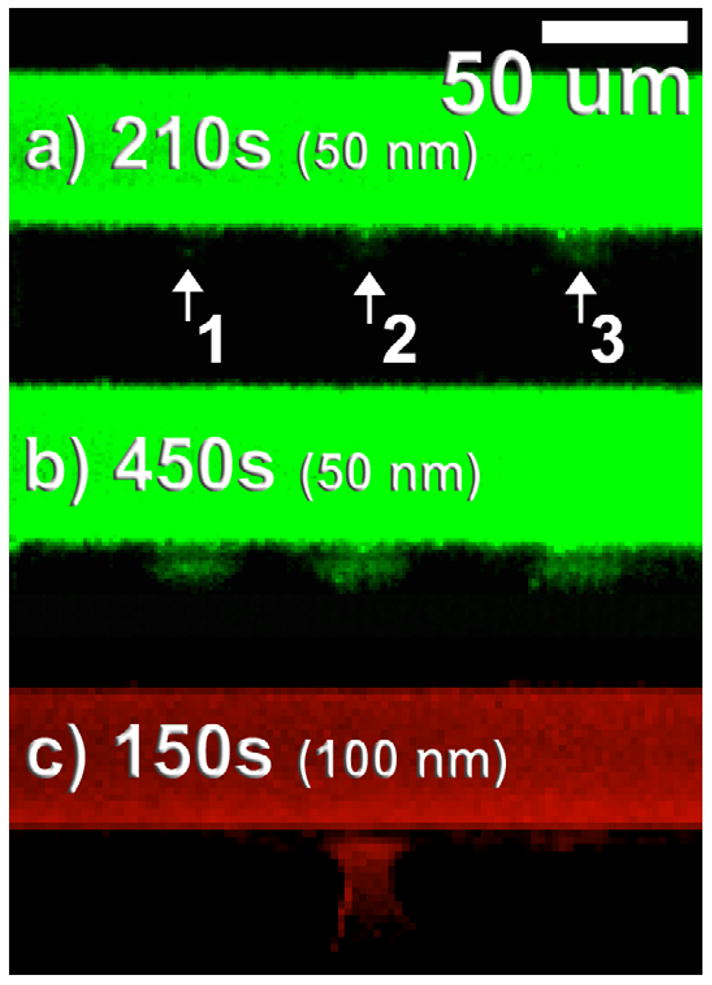
Size-selective transport at the nanoscale for the SiO2 coated CNF membrane. Each image shows a top-down fluorescence image of the microchannel and cell mimic structure shown in figure 2(a). (a) 0.75 nM, 50 nm bead transport through the oxCNF membrane at nanopores labeled 1, 2, and 3 at t = 210 s and (b) 450 s. (c) 10 nM, 100 nm bead transport through the oxCNF membrane at t = 150 s. Only nanopore 2 is permeable at the 100 nm bead size; the minimal fluorescence observed at nanopores 1 and 3 is from 50 nm bead staining from the previous experiments shown in (a) and (b). This fact is supported considering that, (1) this fluorescence was time independent during the experiment and (2) could be observed when the structure was dry.
50 nm latex beads begin to permeate the oxCNF membrane at t = 210 s, escaping from three discrete locations along the 200 μm length of membrane shown (figure 4(a)). A radial plume of beads emanates from discrete nanopores after t = 450 s (figure 4(b)). The diffusing beads began to completely fill in the cell interior at t = 810 s (not shown). The size-selective permeability of the cell mimic oxCNF structure was then explored by using a different (100 nm) latex bead size. The fluorescence image in figure 4(c) shows the same oxCNF membrane segment that was tested using 50 nm beads. No detectable transport across the oxCNF membrane was observed up to t = 105 s. However, a plume of 100 nm beads emerged from the exit aperture of pore #2 after diffusion in the membrane for t = 150 s (figure 4(c)). Bead flux was much more rapid for the experiments conducted using the 100 nm beads because the solution concentration was significantly higher (10 nM relative to the 0.75 nM 50 nm bead experiments) and also the 50 nm bead solution contained 25% glycerol by volume. Apparently a sub-100 nm restriction is present in nanopores #1 and #3 as no 100 nm beads were observed to emerge from either of these nanopores. Multiple experiments produced the same result. Time-lapse fluorescence images from the experiments were then coupled with simulation results to determine the transport characteristics of the beads within the oxCNF membrane.
Figure 5(a) shows that in specific instances entire oxCNF enclosed volumes were impermeable to 100 nm beads while wet with buffer solution. For example, adjacent cell (b) has homogeneously filled with 100 nm beads after t = 3 min while the adjacent cell (a) is filled only with buffer. This result exhibits the ability of the stochastic oxCNF membrane to contain nanoparticles.
Figure 5.
(a) and (b) Fluorescence microscopy images of adjacent cell mimic structures that share a common oxCNF membrane. Cell mimic (b) is permeable to 100 nm beads along its oxCNF membrane facing the bead feeding microchannel (feeding microchannel shown in c). However, the oxCNF barrier coupling cells (a) and (b) is not permeable to 100 nm beads. Thus, the number of defects of size <100 nm ± 13 nm is effectively zero along the 250 μm length of wall separating the two cell structures. Moreover, the left-most oxCNF membrane in cell (a) also appears impermeable to 100 nm beads as no beads are detected in cell (a). The experiment is a duplicate of that shown previously in figure 4, and again, pore 2 was found to be the only permeable pore along this length of oxCNF membrane.
FRAP experiments revealed an oxCNF–nanoparticle interaction for the case of oxCNFs wet with carboxylated 50 nm nanoparticles. The desorption rate constant (off-rate) was determined kdes = 0.045 ± 0.010 s−1 by means of a fit to the fluorescence recovery curve assuming that nanoparticle desorption rate limited fluorescence recovery at long recovery times (>25 s). A non-interacting fluorescein standard and tailored microchannel characteristics were used to identify the desorption regime as described in detail in the supplementary information (available at stacks.iop.org/Nano/19/415301). It is plausible that a hydrophilic interaction between the carboxyl groups terminating the nanoparticles and the hydrophilic SiO2 surface accounts for the detected bound fraction. Adhesion forces between silica surfaces and carboxylated polystyrene beads have been characterized previously and attributed to hydrogen bonding [47].
4.2. Simulation results
Simulations were conducted to emulate experimental, 1D concentration profiles of 0.75 nM, 50 nm bead solution in 25% glycerol across the oxCNF membrane were collected at various times 180, 330, 450, 630, and 810 s following the filling of the adjacent microchannel with the bead solution. These experimental concentration profiles are shown in figure 6. Data was collected from the exit surface of the oxCNF membrane, normal to the membrane surface and into the cell interior. The oxCNF membrane is located in the plot shown in figure 6 between 0 μm ≤ x ≤ 5 μm where fluorescence intensity could not be collected. The hatched red lines show analytical (non-steady state, Fick’s second law) fits to the concentration profiles acquired from the oxCNF-free cell mimic interior.
Figure 6.
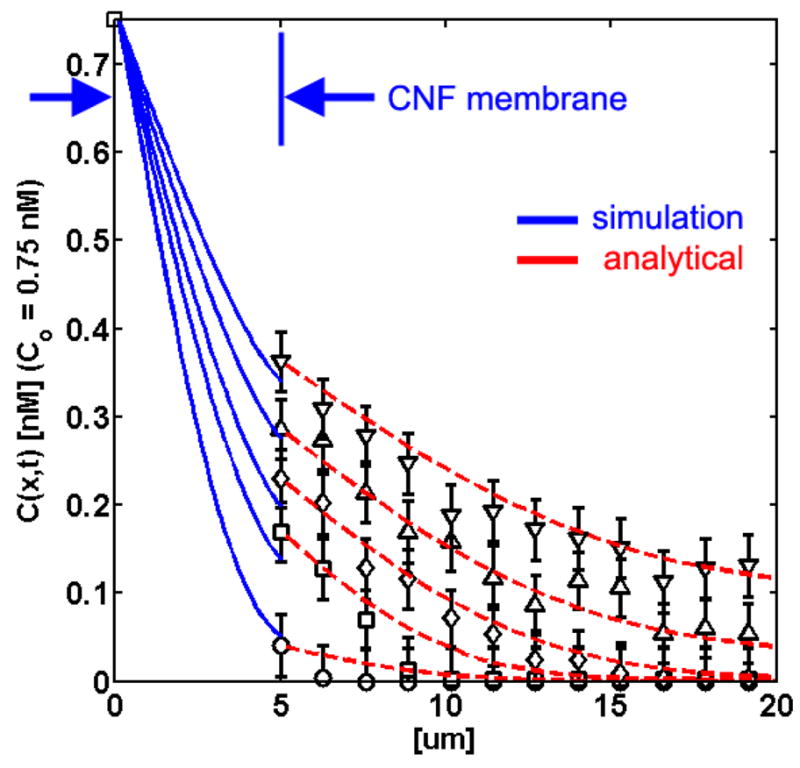
(a) Concentration gradient profiles at t = 180 (bottom curve), 330, 450, 630, and 810 s (top curve) starting in the microchannel (x = 0 μm, Co,50 nm = 0.75 nM), as simulated through the oxCNF membrane (blue curves) and into the cell mimic interior (black data points, fluorescence experiments). The blue line was generated from a 1D finite difference solution of Smoluchowski’s equation using 〈Da(x)〉 data obtained from a simulation of the random walk of 50 nm beads in a virtual oxCNF forest. The red hatched lines are analytical fits to the concentration profiles for the free diffusion in the obstacle-free, cell mimic interior.
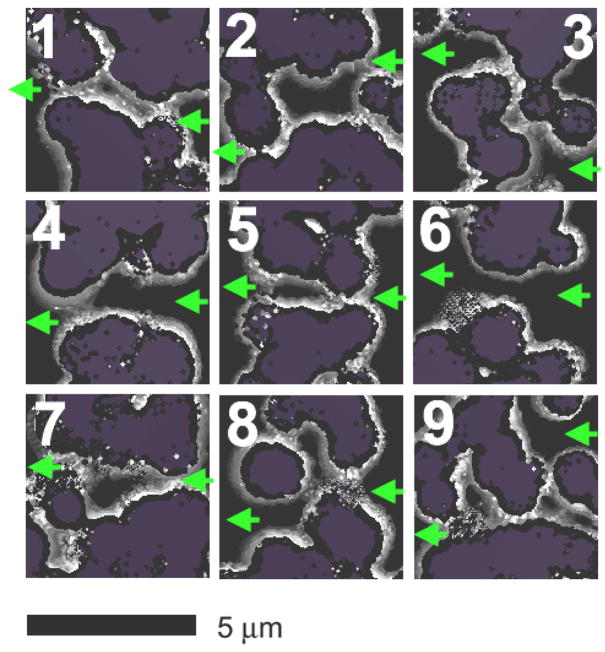
The simulated particle concentrations at the exit surface of the oxCNF membrane (x = 5 μm, figure 6) overlapped with the experimental concentration profiles emanating from real oxCNF membranes. This result is viewed as confirmation that the computer generated oxCNF membrane effectively replicates the real oxCNF membrane and that the transmembrane, interCNF porosity of virtual oxCNF membranes is assumed to represent the porosity present in real CNF membranes. Image slices through the computer generated diffusion path are shown in figure 7. The slices show select images of nanopores in a 5 μm wide stretch of virtual oxCNF membranes coated with 1.7 μm of SiO2.
Figure 7.
Porosity in virtual CNF membranes. Each separate image (1–9) is a 3D image slice through the oxCNF membrane (viewed down the nanofiber axis). In each case the membrane has been sliced to expose a transmembrane nanopore. Purple regions represent sliced oxCNFs. Dark regions represent the Si substrate floor below and gray shaded regions are the tapered oxCNF surfaces. The largest pore (image 6) observed over the 1.92 mm of virtual oxCNF membrane explored is considered more a defect than a pore. Image 9 shows the most tortuous pathway observed during the computer experiments.
Simulated CNF membranes with a thick coating of SiO2 (d = 1.7 μm) have previously exhibited transport termed ‘leaky’ [20]. Discrete nanopores located along the membrane wall ultimately control transport. The experimental fluorescence image shown in figure 4(b) best shows this type of transport. Simulations performed on a 1.6 mm length of virtual oxCNF membrane, generated to mimic this real oxCNF membrane, predicted the leaky behavior. Specifically, a leaky nanopore was observed every 128 μm along the oxCNF membrane wall for 50 nm bead computer experiments. Experimentally, this number was determined to be 83 μm, which is in reasonable agreement with the predictive capacity of the simulation.
Images 4, 6, and 8 (figure 7) show unacceptably large pores in the oxCNF membrane that render the membrane leaky. Such pores were observed experimentally and resulted in near instantaneous filling of the cell interior (Δt < 15 s). The remaining images (1–3, 5, 7, and 9) of porosity represent nanopores which collectively yielded a flux that mimicked the experimentally observed flux (simulated profiles in figure 6). The most tortuous pathway generated computationally that ultimately allowed for passage of the 50 nm bead size is shown in image 9.
4.2.1. Anomalous subdiffusion in oxCNF spaces and confined microchannels
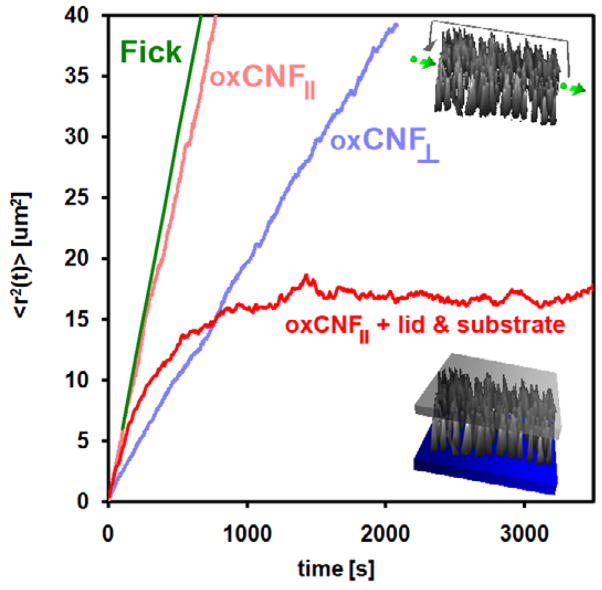
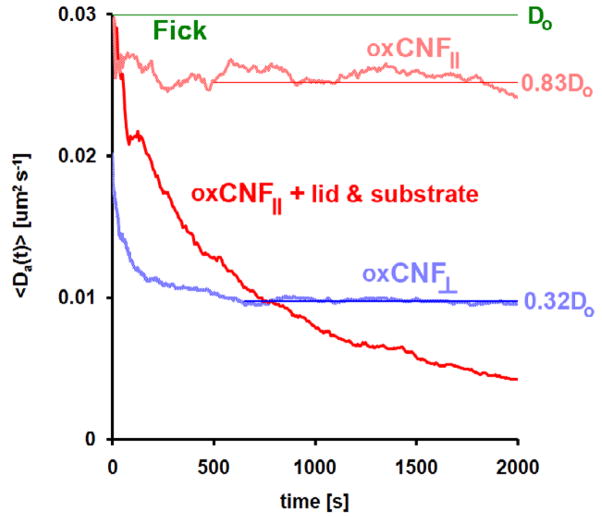
The diffusive behavior of 50 nm beads within oxCNF membranes was studied by the statistical analysis of a collection of virtual particle trajectories. MSD and 〈Da(t)〉 profiles were calculated (equations (2) and (4), respectively) using an ensemble of particle trajectories derived from the simulation that best fit experimental data. These MSD curves are plotted as a function of time in the oxCNF membrane in figure 8. Curves are presented for transport parallel (〈z(t)〉) to the oxCNF axes as well as orthogonal (〈x(t)〉) (the transmembrane direction) to the oxCNF axes. 〈Da(t)〉 profiles as a function of time are shown in figure 9.
Figure 8.
Mean-square displacement traces for an ensemble of 5000 virtual 50 nm particles in 25%/V glycerol diffusing in (1) free solution for reference, (2) parallel to thze oxCNF axes (CNF||), (3) orthogonal to the oxCNF axes (CNF⊥), and (4) parallel to the oxCNFs with lid and substrate included. For cases 2 and 3, periodic boundary conditions were implemented to remove particle scattering effects from the lid and substrate.
Figure 9.
The time-dependent diffusion coefficient 〈Da(t)〉 versus time for virtual particle transport in an oxCNF membrane using 50 nm virtual beads suspended in 25%/V glycerol. Each curve was derived from MSD traces assembled from 5000 virtual particle trajectories. The diffusion coefficient for bead diffusion in the dilute and obstacle-free glycerol solution was Do = 3 × 10⁻² μm2 s−1 (green line). Traces are shown for diffusion parallel (light blue) and orthogonal (light red) to the CNF axes. Periodic boundary conditions were imposed during the simulation to limit particle exploration to oxCNF space. The red trace shows diffusion in the z-direction when the lid and substrate geometries were included in the simulation.
The MSD is shown for diffusion of 50 nm beads (Do = 0.03 μm2 s−1) in an obstacle-free solution (green line) for reference (figure 8). Anomalous subdiffusion due just to the oxCNFs could be estimated by removing the substrate and lid features from the simulation. This was made possible by enforcing periodic boundary conditions at the simulation boundaries. Periodic boundary conditions forced trajectories, which would have previously collided with either the substrate or lid surface, to instead transmit and reenter the simulation boundary on the opposite side. The 〈x(t)〉 (oxCNF⊥) and 〈z(t)〉 (oxCNF||) MSD traces both show reduced MSD relative to the free diffusion reference line. Clearly, the reduction in MSD in the transmembrane direction reflects collisions with the oxCNF surfaces. The crowded oxCNFs effectively hinder diffusive transport. Figure 9 shows the decrease in D, from Do, in the transmembrane direction as particles first begin to collide with oxCNF surfaces. 〈Da(x, t) 〉 saturates at 0.32 × Do after Δt = 600 s once particles have collided with a significant number of oxCNFs. The saturation to an effective value of 0.32 × Do beyond 300 s is reflected in the near linear slope of the MSD beyond this time point. This example illustrates one benefit of the simulation—once the simulated fit to the experiment was determined, the cumulative, simulated particle trajectories could be analyzed and processed to estimate the details of particle transport in the membrane.
The mean pore size in the oxCNF transmembrane direction for the diffusion of 50 nm nanoparticles was then estimated to be 230 nm assuming the Knudsen model of diffusion in rough surfaced pore spaces [48, 49] and using the effective diffusion coefficient of 0.32 × Do. The fractal dimension of the oxCNF spatial distribution was required for this calculation and it was determined to be df = 1.746 from box counting [50] image analysis. Clearly, for the oxCNF membrane to restrict the diffusion of 100 nm nanoparticles requires the deviation about this mean to be significant. Such a deviation in oxCNF diameter has been verified by SEM and was attributed to the mass-transport limited growth of oxCNFs for thick oxide coatings that develops during the PECVD method—as the membrane begins to thicken specific regions within the membrane are effectively ‘cut off’ from the vapor precursor flux. This mass-transport limited growth leads to localized regions within the membrane with a relatively smaller oxCNF diameter and hence a larger local porosity.
Diffusion was also found to be anomalous orthogonal to the transmembrane direction. With the lid and substrate effectively removed, particle collisions in this direction are only possible if oxCNFs are either tapered or tilted. Both tapering and tilting of oxCNFs were observed by SEM imaging (figure 2). Thus, the free space surrounding the oxCNFs has 3D character even when the lid and substrate are absent. It is this property of the oxCNFs that induces anomalous subdiffusion in the z-direction and results in 0.83 × D0. However, oxCNF enclosure by substrate and lid significantly hindered diffusion in the z-direction. The slope of the MSD trajectory in the z-direction with the lid and substrate continually decreases in time (figure 8). Transmembrane diffusion was unaffected by incorporation of these enclosure features.
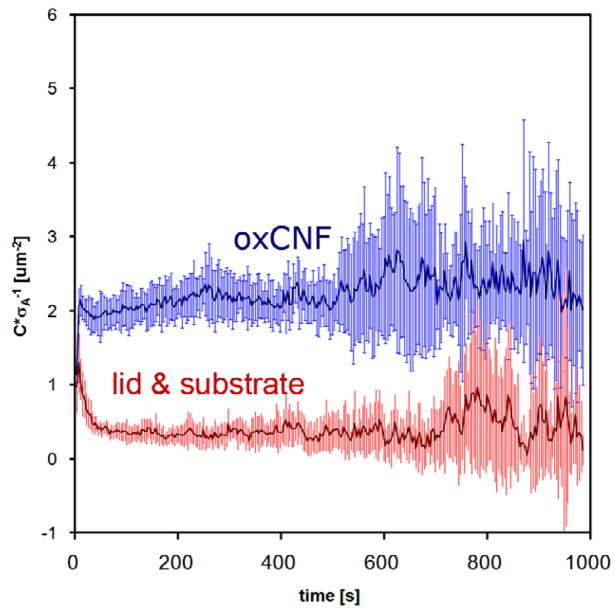
Lastly, figure 10 shows a plot of the total number of collisions of virtual particles with the oxCNF and microchannel surfaces (lid + substrate) during transmembrane transport. The total number of collisions has been plotted as a function of time in the membrane. Importantly, each curve has been divided by the total surface area (σA) accessible to the diffusing particles. Thus, any difference in the total number of collisions after this normalization reflects differences in the spatial distribution of the open area. The number of collisions per unit area is higher for the oxCNFs because of their larger surface-to-volume ratio compared with the confining surfaces forming the microchannel. As a result, the oxCNFs interact with the diffusing particles more than the channel surfaces during transmembrane diffusion. These collision ratios can be tailored by changing both the oxCNF density and the lid-to-substrate distance in the simulation. Future work will examine how chemical functionalization of these surfaces affects transport. Thus, these collision frequencies will aid in predicting reaction probabilities in the oxCNF channel. In this case, as figure 10 shows, the spatial confinement imposed by the microchannel volume itself can be as important as the crowding membrane elements in determining passive transport in small volumes.
Figure 10.
The total number of collisions with the oxCNF and lid and substrate surfaces sampled at a fixed frequency increment over the course of transport through the oxCNF membrane. The total number of collisions has been divided by the total available surface area (σA) of oxCNFs and the lid and substrate, respectively.
5. Conclusions
Previously, it was shown that the anomalous subdiffusion of small solute molecules diffusing in stochastic CNF-defined spaces was due to CNF clustering [31]. CNF clustering imparts a fractal character to the CNF-defined space over a limited length scale. Over this length scale passive transport is subdiffusive [31]. Collisions with CNFs and clusters of CNFs effectively impede diffusive transport disrupting the mean waiting time, characteristic of Brownian motion [51], producing a non-Markovian process [52]. However, the fractal character exists only over a small spatial range. In the results presented here, the fractal-like length scale was <10 μm for 50 nm beads diffusing in an oxCNF membrane which is size-selective to 100 nm beads. Beyond this length scale the diffusion coefficient saturates to a time-independent, effective value which is less than Do, the value for diffusion in dilute and unobstructed solution.
CNF clustering occurs during the catalytic, DC PECVD CNF growth process: an effect that can be enhanced by depositing a conformal coating on the CNF surfaces that ultimately merges adjacent CNFs [20]. Previously, anomalous subdiffusion was observed during the first-passage time (FPT) [53, 54] that starts immediately after the photobleach pulse(s) during fluorescence recovery after photobleaching (FRAP) experiments. The FRAP experiments were conducted using dilute, fluorescently labeled molecules enclosed and diffusing in CNF spaces [31]. Subdiffusion in the CNF space was predicted from simulations that fit experimental FRAP curves. Specifically, traces of the time-dependent diffusion coefficient are extracted from mean-square displacement (MSD) traces derived from Monte Carlo particle tracking simulations that fit experimental fluorescence recovery curves [31].
In this paper, the anomalous subdiffusion of 50 nm beads through oxCNF membranes was observed. The 5 μm wide oxCNF membranes were embedded in a microchannel. The microchannel was defined by a lid that served to seal the top surface of the protruding oxCNFs and the oxCNF supporting substrate. For these experiments, the diffusion of fluorescently labeled beads through the oxCNF membrane was observed by measuring the fluorescence intensity at the inlet and outlet surfaces of the membrane after loading the inlet side with 50 nm beads. The partial hindrance of 100 nm beads, relative to transport studies with 50 nm beads, by the membrane defined the size-selective threshold of the oxCNFs. FPT proceeds from the point of loading the inlet side of the membrane with beads, i.e., when the fluorescence gradient is established across the oxCNF membrane. Simulations that fit these experiments predicted subdiffusion. Thus, anomalous subdiffusion, observed first in forests of CNFs and oxCNFs [20, 31], also occurs for the case of transport across ‘thin’ oxCNF membranes—where ‘thin’ indicates the membrane width at which the characteristic length of subdiffusion (10 μm) is on the order of the membrane thickness.
A binding interaction between the carboxylated 50 nm nanoparticles and the oxCNF surface was detected by the FRAP method (kdes = 0.045 ± 0.010 s−1). This interaction seemed not to affect the diffusive transport of nanoparticles across the oxCNF membrane owing to the finding that simulations of anomalous subdiffusion alone accurately represented the transport of nanoparticles across real oxCNF membranes. Plausible explanations for the lack of simulation sensitivity to binding include the saturation of oxCNF binding sites with nanoparticles and/or the small mean stay time of nanoparticles on oxCNF surfaces τdes ~ 22 s relative to the characteristic diffusion time across thick and crowded oxCNF membranes of τD > 810 s.
The concentration profile through the oxCNF membrane was reduced relative to transport through an equivalent length of free space due to the collision of diffusing particles with the oxCNFs during transmembrane diffusion. This causes the Fickian-based linear dependence of MSD versus time to breakdown and becomes sublinear. This anomalous transport may be tailored using oxCNF-based membranes and it is this property that makes these oxCNF membranes strong candidates for applications requiring controlled release or size-selective transport. Microchannel dimensions also affect diffusion in addition to the oxCNF array. It was found that the tortuous nature of trajectories through the oxCNF membranes (caused by the stochastic spatial distribution of oxCNFs) render them effective assemblies for hindering diffusion but that the microchannel geometry can also act as an integral and active component to affect passive transport.
Supplementary Material
Acknowledgments
This research was supported by NIH Grant EB000657 and a portion of this research was conducted at the Center for Nanophase Materials Sciences, which is sponsored by the US Department of Energy, Office of Basic Energy Sciences, Division of Scientific User Facilities. AVM and MLS acknowledge support from the US Department of Energy, Office of Basic Energy Sciences, Materials Sciences and Engineering program.
This manuscript has been authorized by a contractor of the US Government under contract DE-AC05-00OR22725. Accordingly, the US Government retains a nonexclusive, royalty-free license to publish or reproduce the published form of this contribution, or allow others to do so, for US Government purposes.
© US Government.
Footnotes
Supplementary data are available from stacks.iop.org/Nano/19/415301 (Some figures in this article are in colour only in the electronic version)
References
- 1.Yeh I-C, Hummer G. Proc Natl Acad Sci. 2004;101:12177. doi: 10.1073/pnas.0402699101. [DOI] [PMC free article] [PubMed] [Google Scholar]
- 2.Holt JK, Noy A, Huser T, Eaglesham D, Bakajin O. Nano Lett. 2004;4:2245. [Google Scholar]
- 3.Sun L, Cooks RM. J Am Chem Soc. 2000;122:12340. [Google Scholar]
- 4.Dubbeldam D, Beerdsen E, Calero S, Smit B. Proc Natl Acad Sci. 2005;102:12317. doi: 10.1073/pnas.0503908102. [DOI] [PMC free article] [PubMed] [Google Scholar]
- 5.Sun L, Cooks RM. Langmuir. 1999;15:738. [Google Scholar]
- 6.Ho C, Qiao R, Heng JB, Chatterjee A, Timp RJ, Aluru NR, Timp G. Proc Natl Acad Soc. 2005;102:10445. doi: 10.1073/pnas.0500796102. [DOI] [PMC free article] [PubMed] [Google Scholar]
- 7.Yang H-H, Zhang S-Q, Yang W, Chen X-L, Zhuang Z-X, Xu J-G, Wang X-R. J Am Chem Soc. 2004;126:4054. doi: 10.1021/ja0389570. [DOI] [PubMed] [Google Scholar]
- 8.Kohli P, Harrell CC, Cao Z, Gasparac R, Tan W, Martin CR. Science. 2004;305:984. doi: 10.1126/science.1100024. [DOI] [PubMed] [Google Scholar]
- 9.Hinds BJ, Chopra N, Rantell T, Andrews R, Gavalas V, Bachas LG. Science. 2004;303:62. doi: 10.1126/science.1092048. [DOI] [PubMed] [Google Scholar]
- 10.Van Tomme SR, De Geest BG, Braeckmans K, De Smedt SC, Siepmann F, Siepmann J, van Nostrum CF, Hennink WE. J Control Release. 2005;110:67. doi: 10.1016/j.jconrel.2005.09.005. [DOI] [PubMed] [Google Scholar]
- 11.Netz PA, Dorfmuller T. J Chem Phys. 1995;103:9974. [Google Scholar]
- 12.Ding GQ, Zheng MJ, Xu WL, Shen WZ. Nanotechnology. 2005;16:1285. [Google Scholar]
- 13.Flachsbart BR, Wong K, Iannacone JM, Abante EN, Vlach RL, Rauchfuss PA, Bohn PW, Sweedler JV, Shannon MA. Lab Chip. 2006;6:667. doi: 10.1039/b514300d. [DOI] [PubMed] [Google Scholar]
- 14.Lee SB, Martin CR. J Am Chem Soc. 2002;124:11850. doi: 10.1021/ja027494f. [DOI] [PubMed] [Google Scholar]
- 15.Ku J-R, Stroeve P. Langmuir. 2004;20:2030. doi: 10.1021/la0357662. [DOI] [PubMed] [Google Scholar]
- 16.Scopece P, Baker LA, Ugo P, Martin CR. Nanotechnology. 2006;17:3951. [Google Scholar]
- 17.Klein KL, Melechko AV, McKnight TE, Retterer ST, Rack PD, Fowlkes JD, Joy DC, Simpson ML. J Appl Phys. 2008;103:061301. [Google Scholar]
- 18.Zhang L, Melechko AV, Merkulov VI, Guillorn MA, Simpson ML, Lowndes DH, Doktycz MJ. Appl Phys Lett. 2002;81:135. [Google Scholar]
- 19.Fletcher BL, Hullander ED, Melechko AV, McKnight TE, Klein KL, Hensley DK, Morrell JL, Simpson ML, Doktycz MJ. Nano Lett. 2004;4:1809. [Google Scholar]
- 20.Fowlkes JD, Fletcher BL, Hullander ED, Klein KL, Hensley DK, Melechko AV, Simpson ML, Doktycz MJ. Nanotechnology. 2005;16:3101. doi: 10.1088/0957-4484/17/22/021. [DOI] [PubMed] [Google Scholar]
- 21.Fletcher BL, McKnight TE, Melechko AV, Simpson ML, Doktycz MJ. Nanotechnology. 2006;17:2032. [Google Scholar]
- 22.Melechko AV, Merkulov VI, McKnight TE, Guillorn MA, Klein KL, Lowndes DH, Simpson ML. Appl Phys Rev. 2005;97:41301. doi: 10.1385/1-59259-901-X:191. [DOI] [PubMed] [Google Scholar]
- 23.Merkulov VI, Lowndes DH, Wei YY, Eres G, Voelkl E. Appl Phys Lett. 2000;76:3555. [Google Scholar]
- 24.Merkulov VI, Melechko AV, Guillorn MA, Lowndes DH, Simpson ML. Appl Phys Lett. 2002;80:476. [Google Scholar]
- 25.Melechko AV, McKnight TE, Hensley DK, Guillorn MA, Borisevich AY, Merkulov VI, Lowndes DH, Simpson ML. Nanotechnology. 2003;14:1029. [Google Scholar]
- 26.Merkulov IA, Melechko AV, Wells JC, Cui H, Merkulov VI, Simpson ML, Lowndes DH. Phys Rev. 2005;B71:45409. [Google Scholar]
- 27.Merkulov VI, Hensley DK, Melechko AV, Guillorn MA, Lowndes DH, Simpson ML. J Phys Chem. 2002;B106:10570. [Google Scholar]
- 28.Melechko AV, Merkulov VI, Lowndes DH, Guillorn MA, Simpson ML. Chem Phys Lett. 2002;356:527. [Google Scholar]
- 29.Merkulov VI, Melechko AV, Guillorn MA, Lowndes DH, Simpson ML. Appl Phys Lett. 2001;79:2970. [Google Scholar]
- 30.Fletcher BL, Retterer ST, McKnight TE, Melechko AV, Fowlkes JD, Simpson ML, Doktycz MJ. ACS Nano. 2008;2:247. doi: 10.1021/nn700212k. [DOI] [PubMed] [Google Scholar]
- 31.Fowlkes JD, Hullander ED, Fletcher BL, Retterer ST, Melechko AV, Hensley DK, Simpson ML, Doktycz MJ. Nanotechnology. 2006;17:5659. doi: 10.1088/0957-4484/17/22/021. [DOI] [PubMed] [Google Scholar]
- 32.Havlin S, Ben-Avraham P. Adv Phys. 1987;36:695. [Google Scholar]
- 33.Coppens M-O, Froment GF. Chem Eng Sci. 1995;50:1013. [Google Scholar]
- 34.Saxton MJ, Jacobson K. Annu Rev Biophys Biomol Struct. 1997;26:373. doi: 10.1146/annurev.biophys.26.1.373. [DOI] [PubMed] [Google Scholar]
- 35.Grzywna J. Chem Eng Sci. 1996;51:4115. [Google Scholar]
- 36.Martin DS, Forstner MB, Kas JA. Biophys J. 2002;83:2109. doi: 10.1016/S0006-3495(02)73971-4. [DOI] [PMC free article] [PubMed] [Google Scholar]
- 37.Saxton MJ. Biophys J. 1994;66:394. doi: 10.1016/s0006-3495(94)80789-1. [DOI] [PMC free article] [PubMed] [Google Scholar]
- 38.Saxton MJ. Biophys J. 1996;70:1250. doi: 10.1016/S0006-3495(96)79682-0. [DOI] [PMC free article] [PubMed] [Google Scholar]
- 39.Sprague BL, McNally JG. Trends Cell Biol. 1995;15:85. doi: 10.1016/j.tcb.2004.12.001. [DOI] [PubMed] [Google Scholar]
- 40.Levy P. Processus Stochastiques et Movement Brownien. Paris: Gauthier-Villars; 1965. [Google Scholar]
- 41.Reits EAJ, Neefjes JJ. Nat Cell Biol. 2001;3:E145. doi: 10.1038/35078615. [DOI] [PubMed] [Google Scholar]
- 42.Phair RD, Misteli T. Nat Rev Mol Cell Biol. 2001;2:898. doi: 10.1038/35103000. [DOI] [PubMed] [Google Scholar]
- 43.Chloe Bulinski J, Odde DJ, Howell BJ, Salmon TD, Waterman-Storer CM. J Cell Sci. 2001;114:3885. doi: 10.1242/jcs.114.21.3885. [DOI] [PubMed] [Google Scholar]
- 44.Sprague BL, Pego RL, Stavreva DA, McNally JG. Biophys J. 2004;86:3473. doi: 10.1529/biophysj.103.026765. [DOI] [PMC free article] [PubMed] [Google Scholar]
- 45.Carrero G, Crawford E, Hendzel MJ, de Vries G. Bull Math Biol. 2004;66:1515. doi: 10.1016/j.bulm.2004.02.005. [DOI] [PubMed] [Google Scholar]
- 46.Sbalzarini IF, Mezzacasa A, Helenius A, Koumoutsakos P. Biophys J. 2005;89:1482. doi: 10.1529/biophysj.104.057885. [DOI] [PMC free article] [PubMed] [Google Scholar]
- 47.Christendat D, Abraham T, Xu Z, Masliyah J. J Adhes Sci Technol. 2005;19:149. [Google Scholar]
- 48.Knudsen M. Ann Phys 4F. 1909;29:75. [Google Scholar]
- 49.Coppens M-O, Dammers AJ. Fluid Phase Equilib. 2006;241:308. [Google Scholar]
- 50.ben-Avraham D, Havlin S. Diffusion and Reactions in Fractals and Disordered Systems. Cambridge: Cambridge University Press; 2000. [Google Scholar]
- 51.Einstein A. Investigations on the Theory of Brownian Movement. New York: Dover; 1956. [Google Scholar]
- 52.Sokolov IM, Klafter JC. Chaos. 2005;15:026103. doi: 10.1063/1.1860472. [DOI] [PubMed] [Google Scholar]
- 53.Redner S. A Guide to First-Passage Processes. Cambridge: Cambridge University Press; 2000. [Google Scholar]
- 54.Condamin S, Benichou O, Klafter J. Phys Rev Lett. 2007;98:250602. doi: 10.1103/PhysRevLett.98.250602. [DOI] [PubMed] [Google Scholar]
Associated Data
This section collects any data citations, data availability statements, or supplementary materials included in this article.


