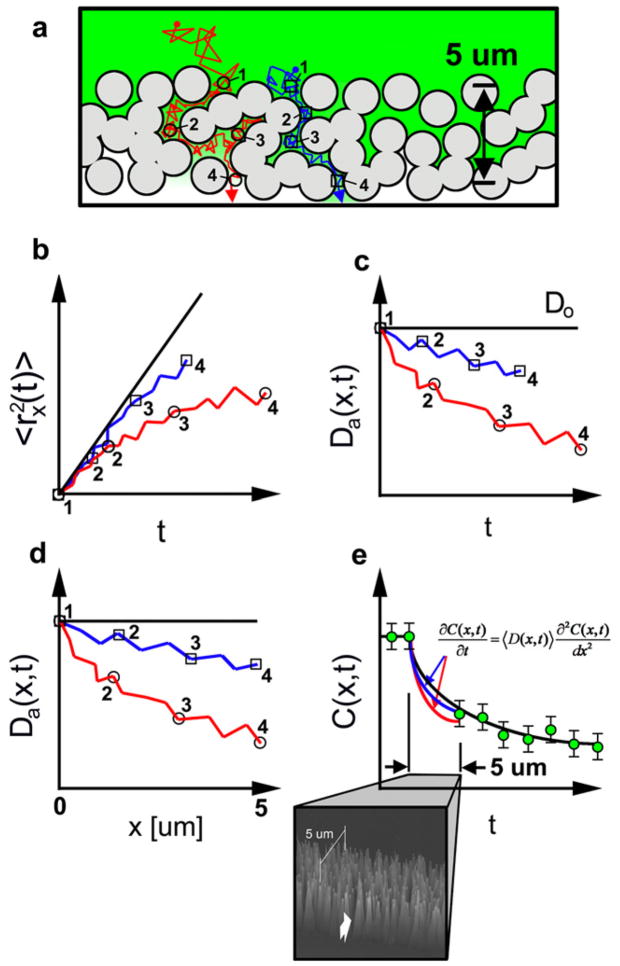
Figure 1.
A schematic illustration of the procedure used to simulate transport in the CNF membrane. (a) The 5 μm thick CNF membrane (viewed down the nanofiber axis) consists of CNFs of d ~ 200 nm coated with ~750 nm of SiO2 to increase the average nanofiber diameter to d = 1.7 μm and these are represented as the circular structures in the image. Two individual Monte Carlo simulated diffusion trajectories through the membrane are shown: a tortuous one (grey (red)) and a less tortuous one (black (blue)). A Monte Carlo simulation is also used to generate the position, taper, tilt, and morphology of each CNF constituting the membrane. (b) The anomalous, mean-square displacement (MSD) of each trajectory through the CNF membrane. The superimposed black trajectory shows the average MSD for such particles in an unhindered domain. (c) The apparent diffusion coefficient 〈Da(x, t) 〉 of each trajectory as a function of time while in the membrane. (d) 〈Da(x, t) 〉 of each trajectory as a function of transmembrane axis. (e) The concentration profile through the CNF membrane is simulated by solving the Smoluchowski equation with 〈Da(x) 〉 in the CNF membrane using the finite difference approximation. The concentration profile of both red and blue trajectories in the CNF membrane merge with experimental data on the other side of the membrane, the required characteristic of an accurate simulation. Moreover, the black fit of unhindered diffusion in the cell interior, when extrapolated back into the CNF membrane, overestimates diffusion in the CNF membrane. This should be expected as the CNFs hinder transport through particle–CNF interactions.

