Abstract
The epidermal growth factor receptor (EGFR) plays an important role in cancer by activating downstream signals important in growth and survival. Inhibitors of EGFR are frequently selected as treatment for cancer including lung cancer. We performed an unbiased and comprehensive search for EGFR phosphorylation events related to somatic activating mutations and EGFR inhibitor (erlotinib) sensitivity. EGFR immunoprecipitation combined with high resolution liquid chromatography-mass spectrometry and label free quantitation characterized EGFR phosphorylation. Thirty (30) phosphorylation sites were identified including 12 tyrosine (pY), 12 serine (pS), and 6 threonine (pT). Site-specific phosphorylation was monitored by comparing ion signals from the corresponding unmodified peptide. Phosphorylation sites related to activating mutations in EGFR as well as sensitivity to erlotinib were identified using 31 lung cancer cell lines. We identified three sites (pY1092, pY1110, pY1172) correlating with activating mutations while three sites (pY1110, pY1172, pY1197) correlated with erlotinib sensitivity. Five sites (pT693, pY1092, pY1110, pY1172 and pY1197) were inhibited by erlotinib in concentration-dependent manner. Erlotinib sensitivity was confirmed using liquid chromatography coupled to multiple reaction monitoring (LC-MRM) and quantitative western blotting. This LC-MS/MS strategy can quantitatively assess site-specific EGFR phosphorylation and can identify relationships between somatic mutations or drug sensitivity and protein phosphorylation.
Keywords: epidermal growth factor receptor, tyrosine phosphorylation, mass spectrometry, proteomics, tyrosine kinase inhibitor, erlotinib, lung cancer
INTRODUCTION
Protein kinases play a major role in signaling transduction through their ability to phosphorylate downstream substrate proteins as well as themselves. These phosphorylation events regulate signaling by activating substrate signaling proteins or by promoting the formation of signaling complexes 1, 2. Knowledge of these specific phosphorylation sites can provide insights into the function of multiple signaling pathways in both normal and cancer cells. Tyrosine kinases are particularly important because of their role in controlling signaling cascades and their known deregulation in cancer. The epidermal growth factor receptor (EGFR) is one such receptor tyrosine kinase known to drive cell growth and survival of multiple epithelial forms of cancer including non-small cell lung cancer (NSCLC) 3, 4. Activation of EGFR, through somatic mutation, gene amplification or autocrine ligand production, leads to enhanced kinase activity and autophosphorylation on key tyrosine sites. Phosphorylation of key tyrosines allows recruitment of proteins containing modular domains that bind phosphotyrosines, such as proteins containing Src-homology 2 (SH2) domains 5. EGFR is a bona fide therapeutic target in lung cancer, particularly in subsets of patients with activating mutations in select areas in exons 19 and 21. Lung cancers harboring these activating EGFR mutations occur in nearly 10% of NSCLC and predict dramatic response to small molecule EGFR TKI such as erlotinib 6–11.
Mass spectrometry based approaches in combination with affinity enrichment of the EGFR protein or its proteolytic peptides have been applied to profile the phosphoproteome driven by EGFR signaling5, 12–22. Introduction of peptide and protein based pull down significantly increases the ability of phosphorylation peptide identification and site assignment through concentrating the targeted phosphorylation peptides and proteins5, 23. Proteomic strategies in combination of affinity-purification5, 14, 24, extended range proteomic analysis (ERPA)23, 25, or tandem immunoprecipitation-mass spectrometry method (TIPY-MS)26 were developed to comprehensively characterize EGFR signaling. These approaches provide comprehensive insights into activated EGFR signaling networks with potential clinical relevance 12, 13, 22, 27. For example, EGFR tyrosine sites have been identified in human lung cancer cell lines and tumors and patterns of EGFR phosphorylation haven been suggested to correlate with the EGFR mutation status as well as type of lung cancer 13, 28, 29.
Despite these successes, site specific full characterization of EGFR phosphorylation using mass spectrometry is still a challenge due to the low abundance and varying stoichiometry of the post-translational modification, particularly when coupled with limits in MS sensitivity30. Besides the well-defined function of tyrosine phosphorylation sites (pY), phosphorylated serine (pS) or threonine (pT) residues in EGFR have also been reported to have functional relevance 27, 31–34. While phosphorylation sites related to activating EGFR mutations have been identified in one isogenic cell line, profiling across different lung cancer cell lines may provide additional insights. Furthermore, monitoring of sites related to EGFR inhibition by erlotinib, a small molecule tyrosine kinase inhibitor, may also provide insights into receptor function and drug sensitivity of cells. Some studies using erlotinib implicated particular sites of EGFR related to erlotinib effects 35–38. One study suggested that pY1172 was associated with erlotinib sensitivity in lung cancer39. One limiting factor of these studies was the lack of comprehensive scanning of all EGFR phosphorylation sites related to drug sensitivity and mechanism.
Given the importance of EGFR signaling pathway in lung cancer and its ability to provide a platform for signaling through phosphorylation (both driven by EGFR kinase activity as well as other kinases such as SRC kinases), we set out to comprehensively map all phosphorylation sites on EGFR across a panel of lung cancer cell lines that had cells with wild type or mutant EGFR as well as cells representing drug sensitive and drug resistant tumors. High mass accuracy and high resolution mass spectrometers, such as the hybrid linear ion trap-orbital ion trap (LTQ Orbitrap, Thermo), now enable identification of multiple post translational modifications with high confidence from samples containing femtomole amounts of protein 40–42. We hypothesize that integration of EGFR protein immunoprecipitation and MS quantification could comprehensively characterize EGFR phosphorylation and define sites related to EGFR mutation and EGFR kinase inhibitor sensitivity.
We developed a strategy for mapping EGFR phosphorylation that combines protein immunoprecipitation coupled with high resolution MS based phosphorylation site identification and quantitation. Using this strategy, we identified nearly 60% of 50 previously identified phosphorylation EGFR sites (50%of known pS, 55% of known pT, and 80% of known pY sites) from NSCLC cell lines 43–48). We identified sites associated with EGFR mutation and EGFR TKI drug sensitivity. Our results define a strategy to use MS-based approaches to characterize key post-translational modifications that are related to somatic activating mutations and drug sensitivity.
EXPERIMENTAL PROCEDURES
Tumor Material and drug treatment
Human non-small cell lung cancer (NSCLC) cells were grown in RPMI 1640 supplemented with 10% fetal bovine serum except for H1648 cells, which were grown in 5% FBS-RPMI 1640 (Invitrogen). Cells were tested and confirmed to be free of Mycoplasma contamination. For inhibitor studies, cells were grown at 37°C and 5% CO2 in a humidified environment and treated with 0.1, 1, 10, 100, or 1000 nM erlotinib (Tarceva®, OSI Pharmaceuticals, Melville, NY) for 10 min, with DMSO used as control. For MS-based studies examining drug sensitivity to erlotinib, cell lines were cultured in triplicate, harvested when grown to 80% confluence, and washed with PBS (Fisher Scientific) containing 1 mM sodium orthovanadate (Sigma). After all liquid was aspirated from the culture dishes, the cells were rapidly frozen and stored at −80°C. Cell viability assays were performed as previously described 49. Primary human lung cancer implanted subcutaneously into nude mice were generated as previously described. Following euthanasia, tumors were excised and rapidly snap frozen in liquid nitrogen.
Preparation of tumor extracts
Lysates were prepared as previously described50. Briefly, human cells were removed from frozen storage and put on ice and then placed on culture dishes with 3 ml of ice-cold cell lysis buffer (20 mM Tris (pH 7.5), 150 mM NaCl, 1% Triton X-100, 1× complete protease inhibitor cocktail tablets (Roche Diagnostics GmbH), and 1× phosphatase inhibitor cocktail 2 (Sigma)). Cells were incubated for 5 min, scraped from dishes, transported via a cell-lysis buffer mixture into 1.5-ml low retention microcentrifuge tubes (Fisher Scientific), incubated for another 20 min, and then sonicated for three cycles of 5 s each on ice. After microcentrifugation for 10 min at 14,000 × g at 4°C, protein concentration was assayed using the Bradford approach (protein assay solution from Bio-Rad, Biophotometer from Eppendorf). We adjusted the final protein concentration of all samples to 1 mg/ml with lysis buffer and stored all samples at −80°C until further use. Primary tumor tissue was pulverized with a BioPulverizer (BioSpec Products, Inc) followed by addition to 10ml lysis buffer (20 mM Tris (pH 7.5), 500 mM NaCl, 1% Triton X-100, 1× complete protease inhibitor cocktail tablets (Roche Diagnostics GmbH), and 1× phosphatase inhibitor cocktail 2 (Sigma)). Following by incubation for 20min on ice, samples were sonicated for four cycles of 15 s each on ice. After microcentrifugation and protein concentration determination, samples were prepared for EGFR immunoprecipitation.
For primary tumor specimens, a series of lysate (according to 0.1, 1, 10, 50 and 100mg of tumor tissue) were used for EGFR immunoprecipitation. After incubation with antibody and seven times of washing with lysis buffer, EGFR proteins were eluted from protein-G agarose beads with 80 μl 200 mM formic acid. Resulting elute was in solution digested with trypsin. Detergent was removed by Pierce detergent removal spin columns (Thermo Scientific, # 8777) according to product instruction.
EGFR immunoprecipitation
Immunoprecipitation was applied following a protocol provided by Cell Signaling Technology with slight modification (http://www.cellsignal.com/products/2256.html ). Briefly, immunoprecipitation was carried out by adding 6 μl of EGF receptor (EGFR1) mouse mAb (Catalog:# 2256B, IP specific; Cell Signaling Technology) to each 1.5-mg cell lysate sample on ice and incubating at 4°C with gentle rocking overnight. A 60-μl protein G agarose bead slurry was added to each antigen-antibody complex and then further incubated at 4°C with gentle rocking for 2 hours. Samples were then microcentrifuged for 30 seconds at 14,000 × g at 4°C. After pellets were washed five times with 500 μl of ice-cold cell lysis buffer, they were resuspended in 50 μl of 3× SDS sample buffer, vortexed, and microcentrifuged for 30 seconds at 14,000 × g. Samples were heated at 95°C for 5 minutes and microcentrifuged at room temperature for another 1 minute at 14,000 × g. All supernatants were loaded to SDS-PAGE gels.
SDS-PAGE separation, Western blot, and in-gel digestion
Purified recombinant EGFR T790M/L858R kinase (recombinant EGFR; His672-Ala1210m supplied as GST fusion, Cell Signaling Technology), EGFR antigen-antibody complex immunoprecipitated from cells (IP-EGFR), and cell lysate EGFR (Lysate-EGFR) were separated by 8% SDS-PAGE and visualized with Coomassie brilliant blue staining. EGFR bands from each sample were identified by Western blot assay using EGFR rabbit polyclonal antibody (Cell Signaling Technology).
EGFR bands were cut into 0.6-mm3 cubes; these gels were washed with 1 ml of Milli-Q water for 30 min at room temperature, destained with 1 ml of 50 mM ammonium bicarbonate (Ambic)-50% methanol twice, each for 20 min, and reduced with 90 μl of 50 mM Ambic and 10 μl of 20 mM tris (2-carboxyethyl) phosphine hydrochloride (TCEP) two times, each for 20 min at 37°C. Samples were then alkylated with 90 μl of 50 mM Ambic and 10 μl of 200 of mM iodoacetamide in dark conditions at room temperature twice, each for 15 min. Samples were washed three times with 200 μl of 50 mM ammonium bicarbonate (Ambic)-50% methanol, each for 15 min and subjected to vacuum centrifugation for 10 min to dry gel granules to slightly opaque. After granules were rehydrated with 20 μl of 20 ng/μl trypsin and 10 μl of 30 mM Ambic for 5 min, added 100 μl of 30 mM Ambic, samples were allowed to digest for 20 hours at 37°C. Peptides were extracted twice with 100 μl of 50% acetonitrile-0.1% TFA at room temperature, shaking for 20 min, and all solutions were pooled to 1.5-ml low retention microcentrifuge tubes, vacuum dried to 20 μl final volume, and stored at 4°C until further use.
Liquid chromatography-tandem mass spectrometry (LC-MS/MS)
After destaining and trypsin digestion, peptides were concentrated to 20 ml using vacuum centrifugation. Nanoflow liquid chromatography (U3000, Dionex, Sunnyvale, CA) coupled to an electrospray ion trap mass spectrometer (LTQ-Orbitrap, Thermo, San Jose, CA) was used for tandem mass spectrometry peptide sequencing experiments. Samples were first loaded onto a pre-column (5 mm × 300 mm ID packed with C18 reverse-phase resin, 5 mm, 100 Å) and washed for 8 minutes with aqueous 2% acetonitrile and 0.04% trifluoroacetic acid. The trapped peptides were eluted onto the analytical column (C18, 75 μm ID × 15 cm; Pepmap 100, Dionex, Sunnyvale, CA). The 60-minute gradient was programmed as 95% solvent A (2% acetonitrile + 0.1% formic acid) for 8 minutes, solvent B (90% acetonitrile + 0.1% formic acid) was ramped from 5% to 50% over 35 minutes, and then solvent B from 50% to 90% B in 1 minute and held at 90% for 5 minutes, followed by solvent B from 90% to 5% in 1 minute and re-equilibrated for 10 minutes. The flow rate on the analytical column was 300 nl/min. After each survey scan, 5 tandem mass spectra were collected in a data-dependent manner. The MS scans were performed in Orbitrap to obtain accurate peptide mass measurement, and the MS/MS scans were performed in linear ion trap using 60-second exclusion for previously sampled peptide peaks.
Peptide assignment
Sequest51 and Mascot52 searches were performed against human entries in the Swiss-Prot database. Two missed tryptic cleavages were allowed, and the precursor mass tolerance was set to 1.08 Da. MS/MS mass tolerance was 0.8 Da. Dynamic modifications included carbamidomethylation (Cys), oxidation (Met), deamidation (Asn, Gln) and phosphorylation (Ser, Thr, Tyr). To accurately identify phosphorylation sites, we integrated database search results from both Sequest51 and Mascot 53 into Scaffold (www.proteomesoftware.com ) and took multiple parameters: SCAFFOLD peptide probability, XCorr, DeltaCN, Mascot ion score, E-value into consideration. The following limits were used to establish data quality ≥80% peptide probability, 40 Mascot score, and XCorr for 2+ ≥2.5, XCorr for 3+ ≥ 3, and DeltaCN ≥ 0.1. Peptides could be identified by either database search alone as long as the quality metrics were exceeded. Finally, phosphorylation site assignment was manually validated from spectrum using published methods30, 54, 55.
Quantification using Extracted Ion Chromatograms
The integrated peak areas for phosphotyrosine peptide quantification were calculated from extracted ion chromatograms (EIC) using QuanBrowser from Xcalibur 2.0. These values were restricted by m/z (±0.02) and retention time (±60 seconds). Other parameters were genesis peak integration smoothing point 9.0, S/N threshold 0.5, and genesis peak detection minimum peak height (S/N) 3.0. The masses and isotopic peak patterns of the target peptides were manually inspected to ensure proper sequence assignment and to verify peak quality. Peak area values of all precursors from all samples were merged to one spreadsheet using software called PeakAreaSummary, which was developed in-house (http://proteome.moffitt.org/proteomics/). PeakAreaSummary is an Excel Add-in using VBA. It first calculates the sum of peak areas for all the precursors in the same sample with the same m/z and retention time (using the same delta values as mentioned above) and then merges the peak area values from all the samples to get one value for any precursor.
Standard peptide synthesis
Solid state peptide synthesis (Symphony, Protein Technologies, Tucson, AZ) was used to make standards for unphospho- and phospho-EGFR peptides, Y1110 (RPAGSVQNPVYHNQPLNPAPSR), Y1172 (GSHQISLDNPDYQQDFFPK), Y1197(GSTAENAEYLR) and pY1197(GSTAENAEpYLR) at the 25 micromole scale using standard FMOC chemistry. Stable isotope label was purchased from Cambridge Isotope Lab. Detailed procedure was described in supplement S1.
Liquid chromatography multiple reaction monitoring
Peptides detected from LC-MS/MS experiments were examined to establish a method that could be used for EGFR quantification. Unmodified and phosphorylated peptides containing the EGFR tyrosine 1197 were selected for subsequent multiple-reaction monitoring (MRM) experiments on a triple quadrupole (TSQ Quantum Ultra, Thermo, San Jose, CA) mass spectrometer using the same LC conditions as the LC-MS/MS experiments, so that retention time would be predictable. SRM set up was as follows: Q1: 0.2 FWHM; Q3: 0.7 FWHM; scan width: 0.002 m/z; scan time: 25 ms.
Three specific transitions (y-ions) for each peptide were selected using Pinpoint software (Thermo) based on the highest intensity peaks in the MS/MS spectrum56. Transitions of Y1197 (GSTAENAEYLR) were set as parent ion m/z 605.79 (2+) to three product ions m/z 651.30 (y5), m/z 765.39 (y6), and m/z 894.39 (y7). Transitions of pY1197 (GSTAENAEpYLR) were set as parent ion at m/z 645.77 (2+) to three product ions m/z 731.31(y5), m/z 845.37(y6), and m/z 974.27(y7). Collision energy (CE) for these doubly charged peptides were calculated using Equation 1:
| Equation 1 |
Peak areas for all transitions for each peptide were summed for quantification.
For MRM based experiments using primary tumor samples, chemical synthesized unphosphorylated and phosphorylated peptides corresponding to Y1197, Y1172 and Y1110 were directly infused to triple quadrupole mass spectrometer to identify fragment patterns. Transitions for all target peptides were generated using Skyline software57 based on the highest intensity of peaks identified from chemical synthesized peptides and previous MS/MS spectrum. Three unmodified EGFR peptides (GLWIPEGEK, IPLENLQIIR and EISDGDVIISGNK) were used as reference peptides to monitor total EGFR expression. All transitions were input into Skyline software and exported to excel (shown in supplement table 1). Total peak area for each precursor was used for quantification.
Quantitative Western blotting
Cell lysates were separated by SDS-PAGE, and proteins were electrotransfered to nitrocellulose membranes. Membranes, blocked with Odyssey Blocking Buffer (LI-COR Biosciences) for 1 hour at room temperature, were washed three times for 5 minutes each with 15 ml of TBS/T. Membranes were incubated with 10 μl of pY1172 EGFR antibody or EGFR antibody (Cell Signaling Technology) and 1 μl of β-actin antibody (Sigma) in 10 ml of blocking buffer with gentle agitation overnight at 4°C and then washed three times for 5 minutes each with 15 ml of TBS/T. Incubated membranes were fluorescently labeled with secondary antibody (1 μl IRDye 680 goat-anti-mouse antibody and 1 μl IRDye 680 goat-anti-rabbit antibody (1:10,000)) in 10 ml of blocking buffer, with gentle rotation for 1 hour at room temperature. Membranes were washed with 15 ml of TBS/T three times for 5 minutes and rinsed with PBS to remove residual Tween 20. The Odyssey Infrared Imaging System quantified the 700- and 800-nm channel images and Odyssey V1.2 to calculate the intensities at 800 nm for pY1172 EGFR and total EGFR; these values were normalized to corresponding β-actin results (700 nm).
Statistical analysis
We applied estimated stoichiometry (ES) as described by Wu et al. 23, to quantify various EGFR phosphorylation sites in this study. The ES is defined as the ratio of peak area(s) as determined from extracted ion chromatogram(s) of the peptide(s) containing individual phosphorylation site to the sum of all peak area values for ion signals corresponding to peptides with the same sequence. The formula is given in equation 2:
| Equation 2 |
pX and X represent the peak areas of the phosphorylated and unmodified peptide, 1 to n represent the number of post-translational modifications co-localized in that peptide sequence. A linear regression model with ES as an outcome variable and relative concentration level as a continuous independent variable was applied. Theoretically, the ES measurements were similar across different concentration levels. The zero slope hypothesis would hold if the p-value for the dilution coefficient was greater than or equal to 0.05. For some sites, the zero slope hypothesis would hold beyond specific concentration level. To estimate ES and choose sites affected by erlotinib, the generalized estimating equation (GEE) 58 model was applied, with ES as the outcome variable and erlotinib concentration as the covariate. Concentration levels were treated as a 5-level categorical variable as the relationship between the EGFR phosphorylation site and ES may not be linear. Similar analyses were performed on LC-MRM data of site Y1197.
For LC-MS/MS analysis of the 31 lung cancer cell lines, clustering was performed using full linkage hierarchical clustering with Pearson’s un-centered correlation on the EGFR phosphorylation expression data using Cluster 3.0 and visualized using Java Treeview. Each phosphosite was median-centered. Differences in EGFR site expression were analyzed using a Mann-Whitney U test for EGFR mutations (n = 6) and K-RAS mutations (n = 10) compared to wild type cells. Multiple testing (n = 21) issues were corrected using a smaller significance threshold (p < 0.01). Correlation with IC50 measurements for the EGFR TKI erlotinib was performed using Spearman’s correlation. Significance was determined as p ≥ 0.02. Statistical analyses were performed using SAS 9.1, and results were plotted by Graphpad 5 Prism and Excel.
RESULTS
The goal of the study was to develop a global and unbiased approach for the qualitative and quantitative evaluation of phosphorylation within the EGFR protein, as shown in Figure 1. This approach would then be applied to examine EGFR phosphorylation in relation to somatic mutations in EGFR as well as EGFR inhibitor sensitivity in a panel of cell lines. One key requirement was a method that could be implemented across cell lines with widely varying levels of EGFR protein expression. We developed a label free quantification strategy combining protein immunoprecipitation, in-gel digestion, and high resolution mass spectrometry. We evaluated this strategy by examining global EGFR phosphorylation in 31 lung cancer cell lines and related EGFR phosphorylation with presence of activating EGFR mutations and sensitivity to EGFR tyrosine kinase inhibitors (TKI). Finally, we evaluated site phosphorylation effected by EGFR tyrosine kinase inhibition using two other methods.
Figure 1. Platform to assess EGFR Phosphorylation using LC-MS/MS.
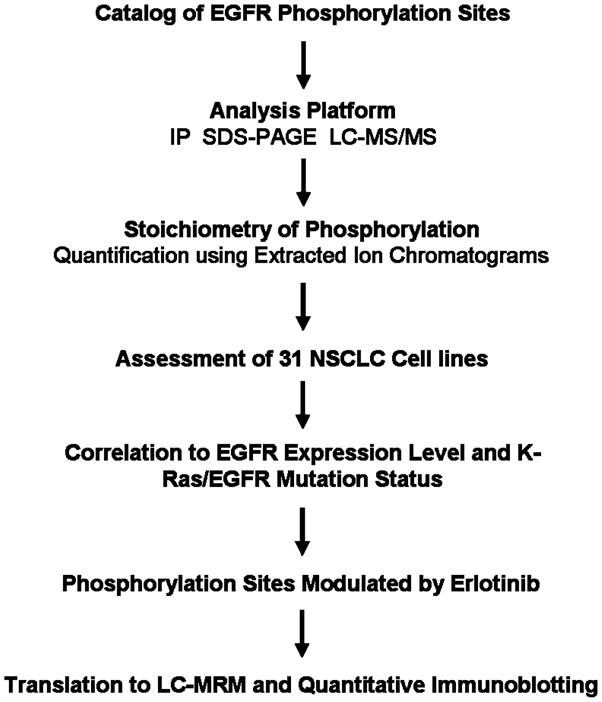
EGFR phosphorylation sites were determined using LC-MS/MS analysis of recombinant protein and EGFR extracted from HCC827 cells using SDS-PAGE fractionation and immunoprecipitation followed by SDS-PAGE. The latter sample preparation (IP) is used for all subsequent experiments. Stoichiometry is estimated using extracted ion chromatograms from high resolution LC-MS/MS. Phosphorylation is measured across a representative panel of cell lines, where each site can be correlated with mutations in EGFR or KRas and in lung cancer cells exposed to erlotinib, a EGFR tyrosine kinase inhibitor. Selected sites can be used for patient monitoring; examples are shown for translation to reaction monitoring mass spectrometry and quantitative immunoblotting, which are more amenable to analysis of patient samples.
Identification of EGFR phosphorylation sites by mass spectrometry
We initially developed our method by using three sources of EGFR for LC-MS/MS. This included (i) recombinant EGFR, (ii) proteins excised from gels corresponding to the approximate molecular weight of EGFR (termed “lysate” for our study), and (iii) EGFR immunoprecipitated (IP) from lung cancer cells. The HCC827 lung cancer cell line was chosen as a sample source given its high level EGFR gene copy and high EGFR activity due to harboring an activating mutation 59. EGFR containing samples were separated by SDS-PAGE; bands at molecular weight of 87 kDa (rEGFR) and180 kDa (for lysate EGFR and IP EGFR) were cut out from gel, digested and analyzed by LC-MS/MS. Results are shown in Table 1. Using 201 LC-MS/MS experiments to assess the different starting materials, we identified 26 phosphorylation sites of EGFR including 9 phosphoserines, 5 phosphothreonines and 12 phosphotyrosines. Four sites (pS151, pS1057, pT940 and pY585) were identified solely with Sequest, while the remaining 22 phosphosites were identified by both Mascot and Sequest. We manually validated each phosphorylation site from its tandem mass spectra and literature review to confirm the correct identification. We compared the protein sequence coverage of EGFR identified from IP and lysate EGFR. Our results indicate that protein immunoprecipitation increased protein sequence coverage by approximately 10% (see Supplemental S2). Based on this result, we used IP to enrich EGFR for further experiments described below. From this analysis, we gained confidence that our MS-based approach can identify a large number of phosphorylation sites with potential information related to drug sensitivity and presence of activating EGFR mutation.
Table 1. Phosphosites profile of EGFR protein.
Phosphorylation sites of EGFR found in recombinant EGFR, IP EGFR from HCC827 cells, or lystate EGFR found in HCC827 cells. All peptides listed have over 80% identification probability calculated using Scaffold. The highest Mascot or Sequest score for each peptide were shown in this table. Most phosphorylation peptides were identified from Mascot searching against SWISS PROT database with high confidence. Four peptides marked with * were identified only with high SEQUEST score. All phosphorylation sites of epidermal growth factor receptor (EGFR) were manually confirmed and labeled pY: phosphotyrosine, pS: phosphoserine, pY: phosphothrionine. Of those peptide sequences, according phosphorylated residues are underlined and bolded in each peptide sequence.
| Phosphosites | Sequence | M/Z | Charge | Scaffold score | MASCOT | SEQUEST Score | E value | Dcn |
|---|---|---|---|---|---|---|---|---|
| pS151* | FSNNPALCNVESIQWR | 978.95 | 2+ | 87% | 2.9 | 0.23 | ||
| pS511 | ATGQVCHALCSPEGCWGPEPR | 797.67 | 3+ | 95% | 41 | 7.00E-02 | ||
| pY585* | GPDNCIQCAHYIDGPHCVK | 754.99 | 3+ | 82% | 3.46 | 0.14 | ||
| pT693¶ | ELVEPLTPSGEAPNQALLR | 1057.53 | 2+ | 95% | 72 | 8.30E-05 | ||
| pT725 | VLGSGAFGTVYK | 639.81 | 2+ | 95% | 43 | 3.80E-02 | ||
| pY727¶ | VLGSGAFGTVYK | 639.81 | 2+ | 95% | 74 | 3.20E-05 | ||
| pY764 | ANKEILDEAYVMASVDNPHVCR | 871.06 | 3+ | 95% | 68 | 2.80E-04 | ||
| pY827 | GMNYLEDR | 539.21 | 2+ | 95% | 37 | 1.10E-01 | ||
| pY869¶ | LLGAEEKEYHAEGGKVPIK | 716.70 | 3+ | 95% | 47 | 2.30E-02 | ||
| pT940* | LPQPPICTIDVYMIMVK | 1020.52 | 2+ | 88% | 3.98 | 0.33 | ||
| pY978 | YLVIQGDER | 586.77 | 2+ | 81% | 35 | 2.10E-01 | ||
| pS991¶ | MHLPSPTDSNFYR | 823.34 | 2+ | 95% | 48 | 1.70E-02 | ||
| pS1025 | ALMDEEDMDDVVDADEYLIPQQGFFSSPSTSR | 1240.51 | 3+ | 91% | 51 | 1.80E-02 | ||
| pS1026 | ALMDEEDMDDVVDADEYLIPQQGFFSSPSTSR | 1240.52 | 3+ | 95% | 51 | 9.10E-03 | ||
| pS1030 | ALMDEEDMDDVVDADEYLIPQQGFFSSPSTSR | 1240.52 | 3+ | 95% | 46 | 2.60E-02 | ||
| pS1039 | TPLLSSLSATSNNSTVACIDR | 1144.04 | 2+ | 95% | 87 | 1.60E-06 | ||
| pT1046 | TPLLSSLSATSNNSTVACIDR | 744.02 | 3+ | 95% | 43 | 7.70E-02 | ||
| pS1057* | NGLQSCPIKEDSFLQR | 638.97 | 3+ | 95% | 3.54 | 0.35 | ||
| pY1069¶ | YSSDPTGALTEDSIDDTFLPVPEYINQSVPK | 1160.20 | 3+ | 95% | 91 | 1.90E-06 | ||
| pT1074 | YSSDPTGALTEDSIDDTFLPVPEYINQSVPK | 1160.20 | 3+ | 95% | 70 | 2.00E-04 | ||
| pY1092¶ | YSSDPTGALTEDSIDDTFLPVPEYINQSVPK | 1160.20 | 3+ | 95% | 70 | 2.10E-04 | ||
| pY1110¶ | RPAGSVQNPVYHNQPLNPAPSR | 827.07 | 3+ | 95% | 54 | 3.50E-03 | ||
| pY1138 | DPHYQDPHSTAVGNPEYLNTVQPTCVNSTFDSPAHWAQK | 1123.00 | 4+ | 95% | 82 | 7.40E-06 | ||
| pS1166¶ | GSHQISLDNPDYQQDFFPK | 1158.52 | 2+ | 95% | 82 | 1.30E-05 | ||
| pY1172¶ | GSHQISLDNPDYQQDFFPK | 772.67 | 3+ | 95% | 63 | 7.70E-04 | ||
| pY1197¶ | GSTAENAEYLR | 645.78 | 2+ | 95% | 58 | 8.30E-04 |
indicates the peptides which have been documented in at least five publications.
EGFR phosphorylation sites related to EGFR somatic activating mutations and sensitivity to EGFR inhibitors
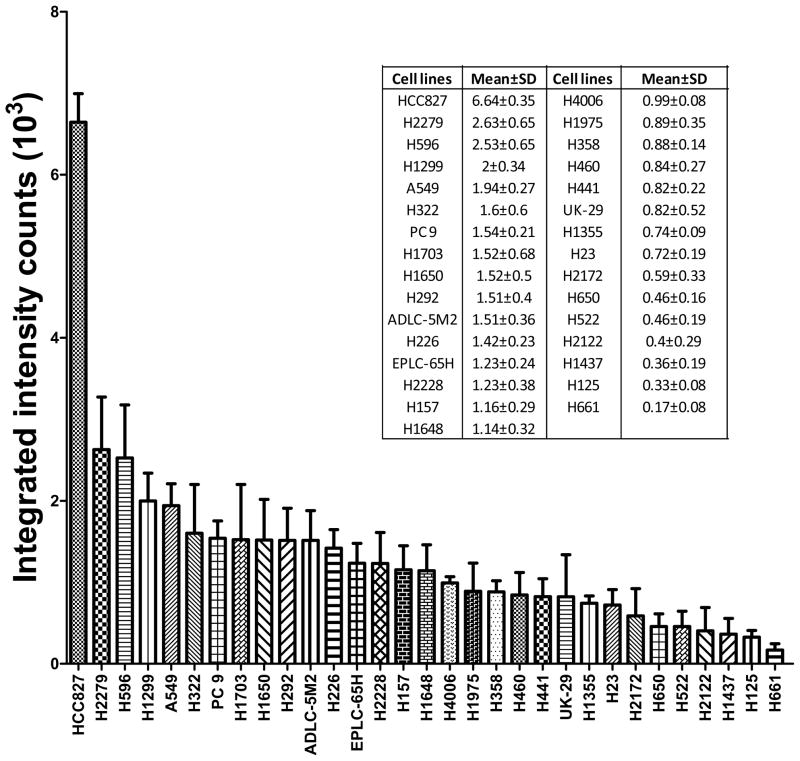
We performed a comprehensive analysis of EGFR phosphorylation using our approach across 31 lung cancer cell lines with known EGFR mutations and sensitivity to erlotinib (see Supplemental S3). We used immunoprecipitation to capture EGFR for each cell line and then measured both phosphorylated and non-phosphorylated counterpart peptides for each phosphorylation site. This was important as total EGFR protein expression varied by a factor of nearly 40 fold across the different cell lines (Figure 2). For each site, we generated extracted ion chromatograms (EIC) to quantify site abundance. Estimated stoichiometry (ES) has been suggested as an ideal way to quantify label-free dynamic phosphorylation sites in proteins by measuring the quantities of the phosphorylated as well as the unmodified peptide 23. We therefore applied ES to quantify phosphorylation of EGFR sites across different samples. One limitation to this approach is that EIC based ES can not distinguish phosphorylation sites located within the same peptide sequence when the peaks can not be resolved by liquid chromatography. For example, peptides containing a single phosphorylation on one of the following sites, pS1025, pS1026, and pS1030, have same m/z and retention time. To provide some estimate of these sites, their peak area values were quantified as one value from the same peak in liquid chromatography.
Figure 2. Total EGFR protein expression in NSCLC cell lines.
Thirty one (31) non-small cell lung cancer cell lines were cultured in triplicate, total lysates were made, and equal amounts of protein run on SDS-PAGE. Total EGFR protein expression was quantified for each of 31 cell lines using infrared based quantitative western blot approach using an anti-EGFR antibody. The expression of β-actin was used for normalization. Error bars represent mean ± standard deviation.
For each cell line, we isolated EGFR using immunoprecipitation in three biological replicates, performed LC-MS/MS for each sample in triplicate, and quantified all EGFR phosphorylation and counterpart non-phosphorylation sites. We ran three batches of LC-MS/MS analysis, each corresponding to one replicate of the full 31 cell line set. During this analysis, we identified an additional 4 phosphorylation sites on EGFR not found in our initial analysis with HCC827 EGFR or recombinant EGFR: pY998, pS1037, pS1071, and pS1081.
As part of the initial analysis, we examined measurements of two EGFR peptides corresponding to sequences that have no known mutations or modifications (ELIIEFSK and GLWIPEGEK). We found reasonable variation for each peptide across the data set indicating biological differences between the amounts of EGFR recovered in the experimental immunoprecipitation (CV = 0.46 for ELIIEFSK and CV = 0.43 for GLWIPEGEK). We also found an excellent correlation (R = 0.98) between these two peptides across the entire dataset. We compared total EGFR expression results measured by both quantification using EICs from the LC-MS/MS data and antibody based quantitative western blot methods (Figure 2) and found an excellent correlation between the two platforms (R = 0.985) (see Supplemental S4). We also examined a dilution series to assess linearity of the EIC based measurements and found that linear regression models fitted the data of phosphorylation sites well with a mean R2 range of 0.92 ± 0.09 (see Supplemental S5).
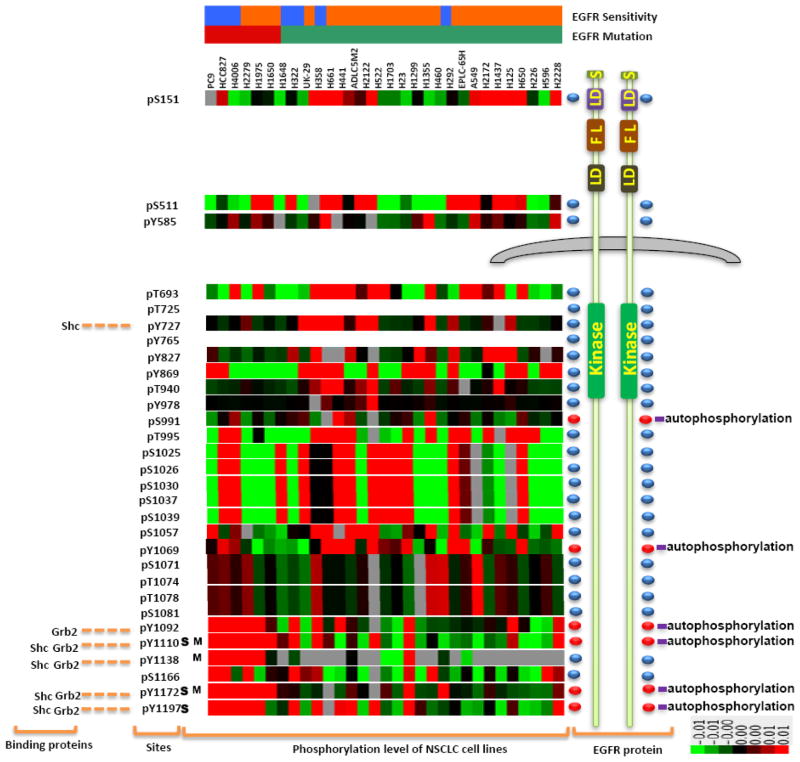
Encouraged by this level of measurement accuracy, we measured estimated stoichiometry for each phosphorylated peptide and the corresponding unmodified peptide. Out of 30 phosphorylation sites total, ten phosphorylation sites could not be quantified independently because multiple sites are contained in the same tryptic peptide: e.g. S1025/S1026/S1030, S1037/S1039, S991/T993, and S1071/T1074/S1081. While the MS/MS data show evidence for each modification site, each member of a group of phosphorylated sites within the same peptide sequence are detected in one LC peak and therefore the assessment of these sites is presented as the sum of all phosphorylation on the peptide. In addition, three sites, T725, Y764 and T1046, had no identifiable peak in any of the cell lines (though originally detected in other immunoprecipitation EGFRs from HCC827 cells and EGFR gel band separated directly from HCC827 cell lysate by SDS PAGE). Therefore, ES of final 21 unique phosphorylation sites were calculated as shown in Figure 3. We performed clustering analysis relating site-specific quantitation of EGFR phosphorylation to each of the 31 different lung cancer cell lines. From this analysis, identified one cluster of six phosphorylation sites with higher intensity (pY1092, pY1110, pY1138, pS1166, pY1172, and pY1197) in the left lower quadrant associated with the cell lines harboring EGFR mutation. This result provides the global view of group and correlation of phosphorylation sites with NSCLC cell lines.
Figure 3. Relationship of EGFR phosphorylation to oncogenic mutations and tyrosine kinase inhibitor sensitivity.
Summary of all data relating LC-MS/MS based site-specific EGFR phosphorylation with lung cancer cells lines EGFR mutation status and erlotinib sensitivity. On the top, blue color and red represent the erlotinib sensitive and resistant cell lines respectively while the orange and green color represent the cell lines with mutant or wildtype EGFR respectively.
Left panel: Binding proteins known to interact with specific phosphotyrosine sites cited from literature5; Middle panels: Phosphorylation sites identified in our experiments. S indicates the site which correlation with erlotinib sensitivity; M indicates the site which correlation with EGFR mutation; Heat map shows the correlation of phosphorylation sites with NSCLC cell lines by overall clustering by EGFR sites across 31 lung cancer cell lines using ES as normalization, green and red represent the lowest and highest amount of ES value of phosphorylation sites, respectively.
Right panels: EGFR protein: EGFR domains are summarized from PhosphoSiteplus, UniProKB and Scansite. S represents single peptide; LD represents L domains, FL represents Furin-like domains; Kinase represents pTyr kinase domains; Red ellipsoid-domes represent EGFR auto-phosphorylation sites. The color bar describes the intensity levels of median-centered Estimated stoichiometry(ES) values for each phosphosite.
We correlated EGFR phosphorylation with (i) EGFR mutation, (ii) sensitivity of EGFR TKI, (iii) mutations in K-Ras, and (iv) total EGFR levels measured by quantitative Western blotting. We identified three sites (pY1092, pY1110, and pY1172) highly correlated with EGFR mutants (p < 0.01). Three sites (pY1110, pY1172, and pY1197) were highly correlated with sensitivity to EGFR TKI erlotinib. Of these, two phosphosites (pY1110 and pY1172) overlap between mutation and erlotinib sensitivity. We evaluated the function of these sites using the existing literature60–66; pY1092, pY1110, pY1172 and pY1197 are known autophosphorylation sites and therefore could reflect EGFR kinase activity.
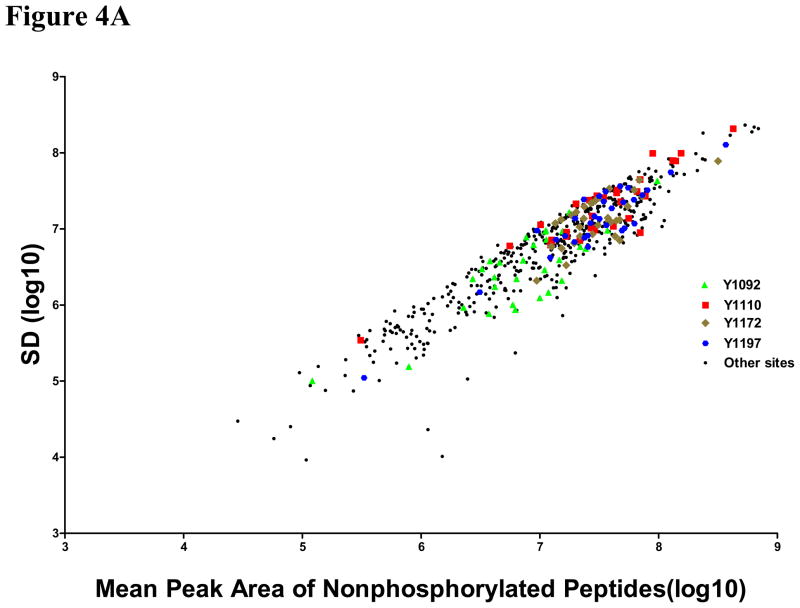
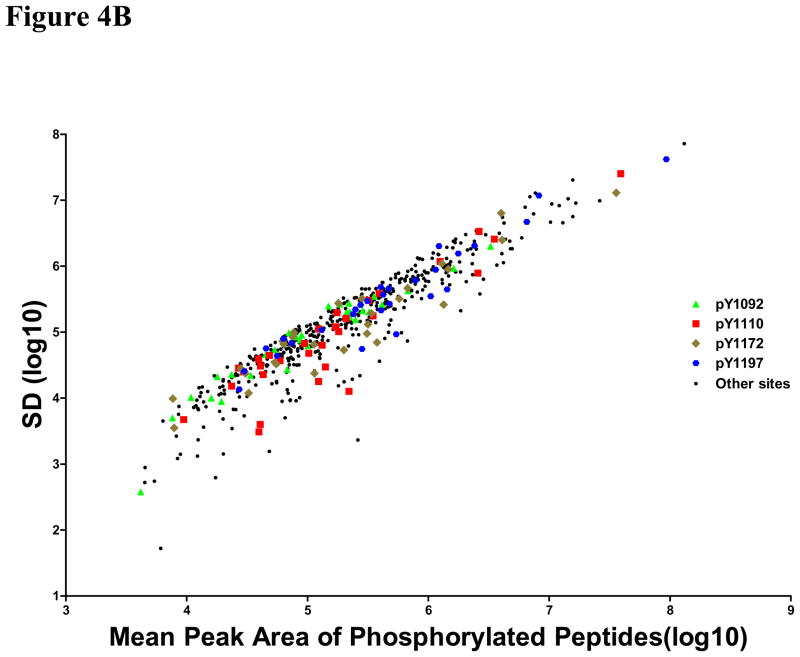
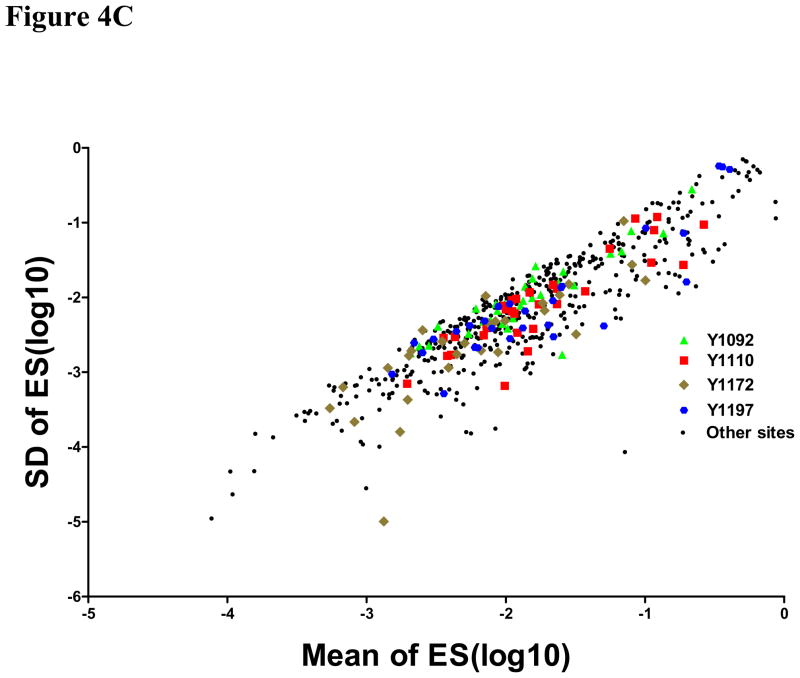
Signal quality and the accuracy of stoichiometry measurement were examined using these sites correlating with EGFR mutation and erlotinib sensitivity. The rationale for this analysis was to determine if there were limits on data quality for identification of sites that have biological or clinical relevance. Therefore, standard deviations for the peak area of the unmodified peptide, the peak area of the phosphopeptide, and the estimated stoichiometry are plotted against the average values from each cell line. For these four phosphorylation sites, the signals for the unmodified peptides are typically robust (Figure 4A) with peak areas above 106, but the phosphopeptide peak areas are scattered throughout the range observed for all EGFR phosphopeptides (Figure 4B). The estimated stoichiometry values are also scattered throughout the range (Figure 4C), indicating that the highest data quality and the highest intensity peaks are not contributing to the selection of the biologically and clinically relevant phosphorylation sites.
Figure 4. Plots of standard deviation (SD) against means of peak area of unphosphorylated (A), phosphorylated (B) EGFR sites and estimated stoichiometry ES (C).
Three sites (pY1110, pY1172 and pY1197) correlated with EGFR mutation and other three sites (pY1092, pY1110 and pY1172) correlated with erlotinib sensitivity were marked with different colors and shapes. Green triangle: site 1092, Red square: site 1110, Tan diamond: site 1172, Blue hexagon: site 1197; Black circles: other sites.
With additional data analysis, no phosphorylation sites could be correlated with K-Ras mutation status. We performed similar analysis examining total levels of EGFR protein and its relationship to EGFR mutation or erlotinib sensitivity. We found higher levels of EGFR protein in cells measured by quantitative western blot harboring activating EGFR mutations (P = 0.043). However, we found no correlation between EGFR protein expression and erlotinib sensitivity (R2 = 0.022). From this analysis, we conclude that an unbiased and comprehensive strategy to identify and quantify EGFR phosphorylation sites finds sites related to both EGFR activating mutations as well as EGFR inhibitor sensitivity. We found that site-specific information tracks better with erlotinib sensitivity than did total levels of EGFR protein and the approach identifies tyrosine phosphorylated sites known to interact with critical adaptor proteins Grb2 and Shc that activate downstream Ras/Raf/MAPK/ERK signaling.
Identification of phosphorylation sites affected by EGFR tyrosine kinase inhibitor
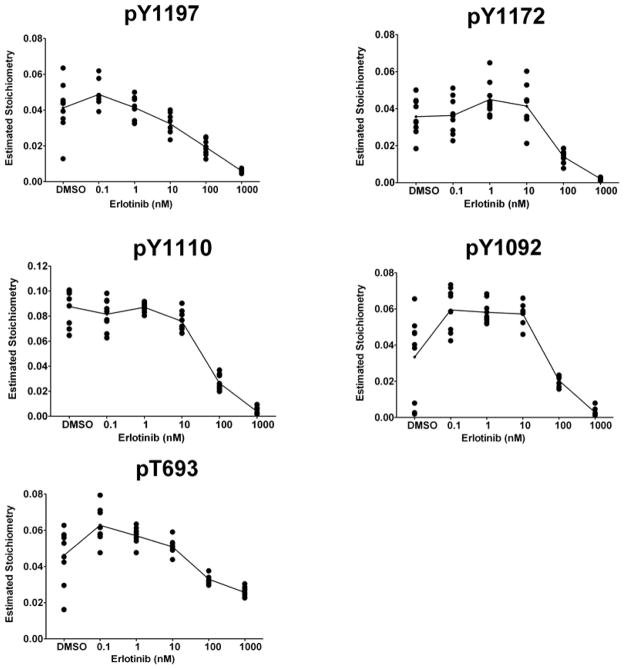
We next evaluated if the sites identified related to EGFR mutation and/or erlotinib sensitivity were affected by EGFR tyrosine kinase inhibition. We used erlotinib, an EGFR tyrosine kinase inhibitor, and performed concentration-dependent studies in HCC827 cells, which were selected as a model system due to drug sensitivity and overexpression of EGFR. EGFR was immunoprecipitated, digested, and analyzed with LC-MS/MS. A total of 26 phosphorylation sites were identified and quantified from HCC827 cells with treatment of erlotinib in series of concentrations. To identify sites that are affected by EGFR kinase inhibition, we used generalized estimating equations (GEE) 58. This analysis revealed that 8 phosphorylation sites of EGFR were affected by erlotinib (p<0.05). Of these 8 sites, we found that 5 phosphorylation EGFR sites (pT693, pY1092, pY1110, pY1172 and pY1197) were inhibited by erlotinib in concentration dependent manner (Figure 5). Of these five sites, three were shown above to be related to EGFR mutation (pY1092, pY1110, pY1172) and three were related to erlotinib sensitivity (pY1110, pY1172, pY1197).
Figure 5. Erlotinib inhibits EGFR phosphorylation in a concentration-dependent manner.
HCC827 cells were exposed to six different concentrations of erlotinib: 0, 0.1, 1, 10, 100, 100 and 1000 nM for 10 minutes. Cells were lysed and prepared for IP-LC-MS/MS and EIC based quantitation. estimated stoichiometry(ES) of phosphorylation is plotted against concentration for 5 EGFR peptides in HCC827 cells found to be affected by erlotinib in a concentration-dependent manner. There were 9 estimated stoichiometry data points for each concentration. The lines were based on the predictions of ES and calculated using the generalized estimating equations (GEE) models.
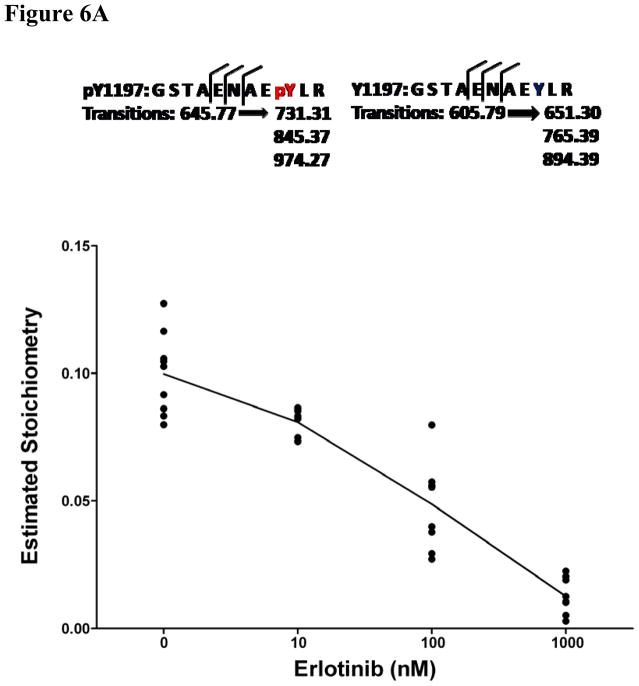
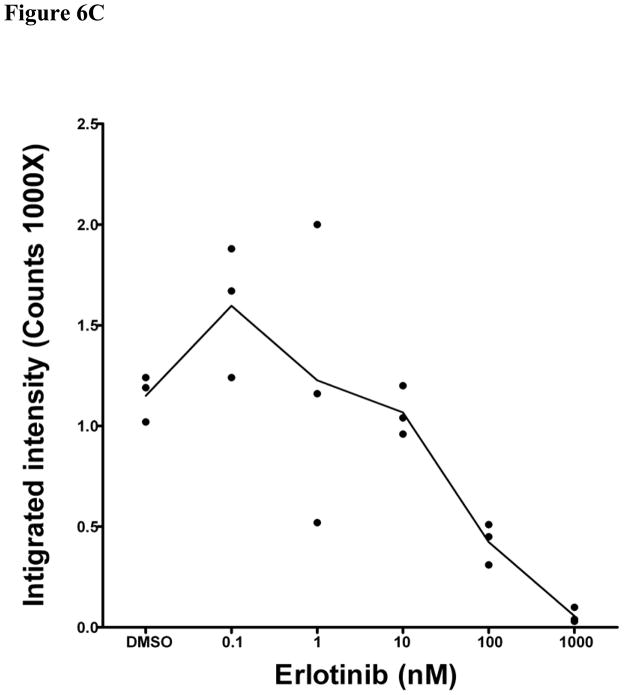
Using the same cell line model and dosing scheme, the erlotinib sensitivity of two of these sites was validated using two other methods. Liquid chromatography coupled to multiple reaction monitoring mass spectrometry (LC-MRM) was used to monitor changes in phosphorylation of Y1197 (Figure 6A). Using a phospho-specific antibody, we also validated the decrease in phosphorylation on Y1172 following erlotinib treatment using infrared quantitative western blots (Figure 6B and 6C). Our results indicate that these two sites are inhibited by erlotinib and therefore agree with results using estimated stoichiometry approach described above for LC-MS/MS data.
Figure 6. Validation of EIC based quantification results with liquid chromatography multiple reaction monitoring (MRM) and quantitative western blotting.
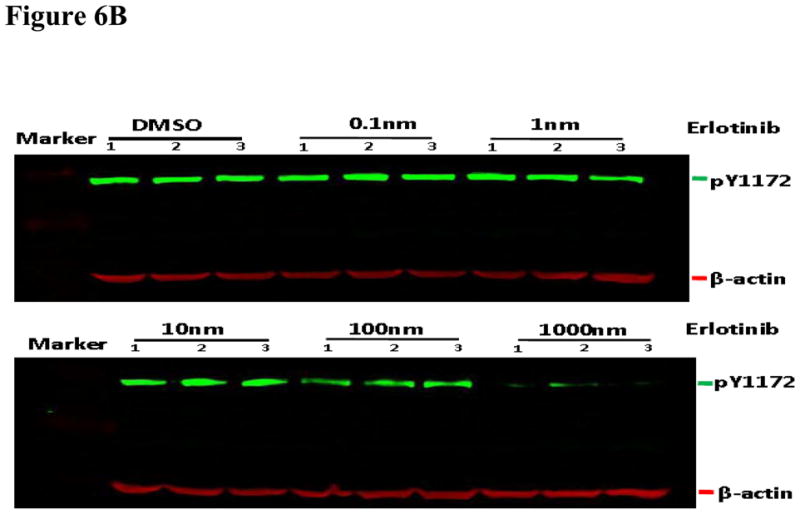
We validated EIC based quantification results with LC-MRM (A) and quantitative western blots (B, C). In A, three transitions were monitored for EGFR pY1197 and Y1197 respectively. All estimated stiochoimetry (ES) values were calculated using area under curves (AUC) of the sum of the MRM transitions. Generalized estimating equations (GEE) model was also used to predict the appropriate estimated stoichiometry (ES) from total 9 replicated data points for each of four concentrations: 0, 10, 100 and 1000nm erlotinib. Panel B shows the results of quantitative western blot of EGFR pY1172, in which, β-actin was used internal control. Integrated intensity of infrared light in quantitative western blot experiments was calculated for EGFR pY1172. Panel C shows triplicate quantitative results of EGFR pY1172 in HCC827 cells response to each of six concentrations: 0, 0.1, 1, 10, 100 and 1000nm erlotinib.
EGFR phosphorylation in primary lung cancer explants using IP-MRM
As an initial step towards an assay platform more readily useable for human tumor tissue applications, we assessed the ability to make measurements of EGFR phosphorylation using IP-MRM. Our goal was to measure EGFR phosphorylation sites (pY1110, pY1172, pY1197) related to erlotinib sensitivity using lung cancers from primary tumor explant models. These models directly implant human tumor tissue from patients into immunocompromised mice and more fully recapitulate human lung cancer behavior than cell line based xenograft models. The models also allow propagation allowing development of the assay system including refinement of measurements of pY and Y abundance and determination of the sensitivity of the resulting assays.
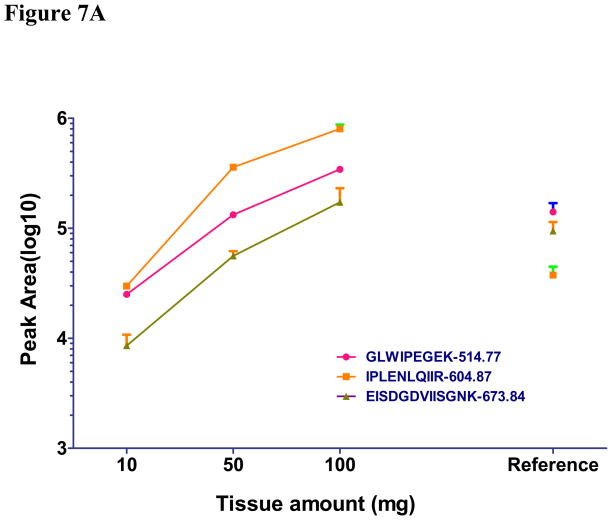
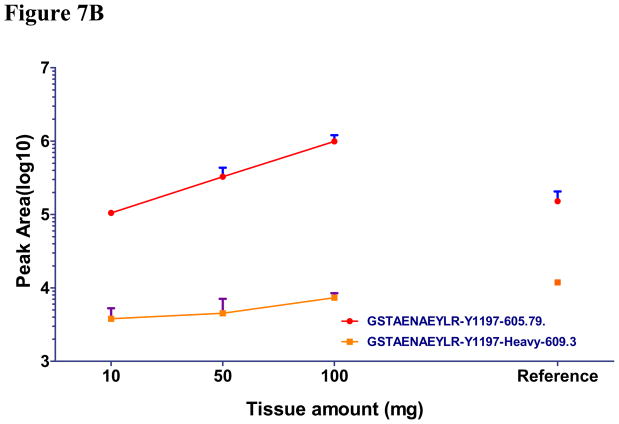
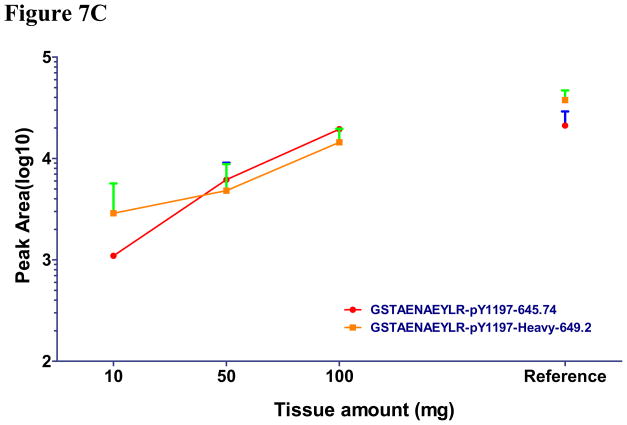
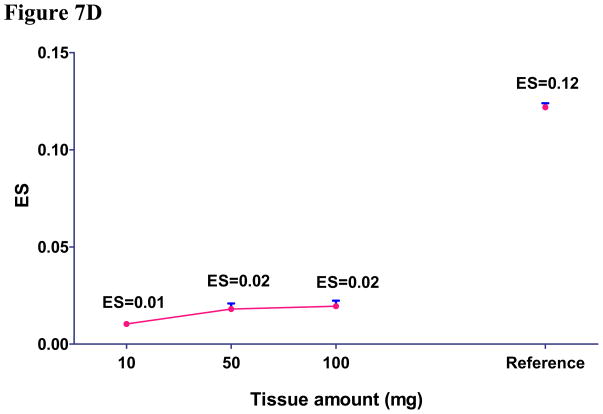
Using IP-MRM, we measured the amount of three reference EGFR peptides and three pairs of unphosphorylated and phosphorylated EGFR peptides (Y1110, Y1172 and Y1197) different amounts of the same tumor. Genotyping revealed this tumor to have wildtype EGFR. We were unable to produce Y1110 or Y1172 peptides because of poor peak intensity and were abandoned (see Supplemental S6). As a positive control, we also performed IP-MRM using 2mg of protein lysate from HCC927cells. Initial inspection of results using 0.1 and 1.0 mg of tumor tissue revealed unsatisfactory results indicated by unreliable signal of each peptide gained from liquid chromatography.(Figure 7A, 7B, 7C). Our results using 10, 50, and 100 mg of tumor tissue show that three unmodified reference peptides, unphosphorylated and phosphorylated Y1197 peptides showed good quality signals and linear increases in signal as protein lysate was increased (R2 for all curves are greater than 0.96). Furthermore, similar ES of pY1197 was observed among 10, 50 and 100mg tumor samples (Figure 7D). Average CV for the three reference EGFR peptides was 0.16, while, CV of 0.24, 0.19 and 0.09 were found for unphosphorylated, phosphorylated and ES of Y1197. Consistent with HCC827 having 35 copies of EGFR, total expression of total EGFR in 2 mg of lysates approximated that corresponding to 10–50 mg tumor weight, while phosphorylation of Y1197 in HCC827 cells is nearly equal to 100 mg wet tumor weight. Compared to ES for pY1197 (0.12), the ES for tumor tissue was nearly five fold lower for 100 mg tumor tissue. Collectively these results indicate that IP-MRM is a feasible measurement strategy for EGFR phosphorylation in tumor tissue and while limited, the preliminary results suggest low levels of EGFR phosphorylation in tumors.
Figure 7. Measurement of EGFR phosphorylation in primary tumor explants using immunoprecipitation with MRM.
EGFR protein was immunoprecipitated from primary lung cancer explants and digested with trypsin. HCC827 cell line was used as positive control. Total peak area was measured to quantify each unmodified (Fig 7A), unphosphorylated (Fig 7B) and phosphorylated EGFR peptides (Fig 7C) by MRM. ES was calculated to measure the phosphorylation of EGFR in human tumor tissue and HCC827 cells (Fig 7D).
DISCUSSION
We present a MS-based strategy to comprehensively map EGFR phosphorylation sites in lung cancer cells. We could identify and quantify nearly 30 phosphorylation sites in EGFR and use estimated stoichiometry to compare site-specific phosphorylation across different samples. We identified sites related to either activating somatic mutations in EGFR or sensitivity to EGFR kinase inhibitors and found overlap with sites whose phosphorylation was inhibited by erlotinib. These sites are known to affect binding of the activated receptors to key downstream adaptors important in signal transduction39, 67–70. Compared to affinity enrichment of phosphotyrosine containing peptides, protein immunoprecipitation allowed for a more comprehensive characterization of the phosphorylation patterns of EGFR including pS, pT and pY. Despite studies suggesting functional roles for serine or threonine phosphorylation, we mainly identified tyrosine phosphorylated sites related to mutation or drug sensitivity. In addition, quantitation of phosphorylation sites could be normalized to the ion signals detected for the corresponding unmodified peptide, establishing an estimate of the stoichiometry of phosphorylation.
Our results scanning phosphorylation of EGFR across the 31 lung cancer cell lines show that higher stoichiometries of three phosphorylation sites (pY1092, pY1110, and pY1172) were statistically correlated with EGFR sensitizing mutations. Similarly, higher amounts of phosphorylation on three sites (pY1110, pY1172 and pY1197) correlated with erlotinib sensitivity. Examining these statistically significant phosphorylations, two sites, pY1110 and pY1172, correlate to both mutation and drug sensitivity. We identified 5 phosphorylation sites on EGFR from HCC827 cell lines that were inhibited by erlotinib in a concentration dependent manner. Consistent with expectation, four of the five sites are autophosphorylation sites. Similar to other previous studies, pY1092 and pY1172 on EGFR were also found to be inhibited by erlotinib in our results 35–38. We surmised that we could use these 5 EGFR phosphorylation sites as surrogates for EGFR kinase activity; this could be then related to either somatic mutations in EGFR or sensitivity to EGFR kinase inhibitors. Our results found no correlation between total protein expression with erlotinib sensitivity. These results, as well as those in a previous clinical study, indicates that phosphorylation pattern of EGFR, not total protein, is related to the erlotinib sensitivity in lung cancer 71, 72, 73. In a previous study using reverse phase protein array platform, phosphorylation level of Y1092 and Y1172 positively correlated with EGFR mutation 22. This is consistent with our results. No correlation of phosphorylation of Y1110 with EGFR mutation was identified in their study.
In addition, previous studies have found that these two individual pY sites can couple to downstream signaling molecules, such as Grb2 for Ras signaling 23, 74. Incorporation of this knowledge from protein-protein interaction networks could further increase confidence in these sites as being related to EGFR activity and drug sensitivity. Taking previous evidence and our results into consideration, monitoring pY1110 and pY1172 might prove to be informative for prediction of erlotinib sensitivity in cancer patients. The results of this analysis also suggest that this approach could be useful for determining biomarkers that may be predictive of drug effects. A similar strategy could be examine with other signaling molecules, such as insulin-like growth factor receptor signaling, where less obvious biomarkers exist for predicting drug sensitivity.
In comparison to spectral counting (which usually registers 0 or 1 for modified peptides), peak areas generated from extracted ion chromatograms (EIC) can be used to quantify peptides with and without particular post-translational modifications, such as phosphorylation. Our results show that protein immunoprecipitation allows one to gain not only phosphorylation site identification but also quantification because of the simultaneous detection of the unmodified peptide. Estimated stoichiometry was first described in ERPA based quantification and suggested as a method to quantify dynamic status of individual phosphorylation sites 23. Although CVs of < 0.2 are usually considered desirable in most proteomics applications, we observed an overall CV of 0.57 for of ES across the 31 lung cancer cell lines. Most of the variation resides in biological changes in phosphorylation across the different biologic samples (cell types) and phosphorylation sites. For example, we found less variability of ES 1197 in EGFR mutation cells (mean CV 0.33) compared to EGFR wild type cells (mean CV 0.62). Similarly, the CV of ES 1197, 1110, 1172, and T693 sites in HCC827 cells were all below 0.1, while CV of other sites in the same cell were higher than 0.1. Higher CVs may be acceptable for quantitative data using peak intensity in proteomics factors affect the variation across different samples, such as through biological variation amongst samples, errors in purification efficiency, or variability in LC-MS/MS 75. Despite the higher variability, we were still able to identify known biological sites on EGFR related to both autophosphorylation and adaptor protein binding associated with EGFR mutation.
It could be interesting and important to monitor EGFR phosphorylation in a larger set of human lung cancers with known response to EGFR inhibitors. Towards this end, we developed a MRM assay to measure the phosphorylation status of EGFR in human lung cancer tumor tissue. The current results indicate measurement accuracy using 10 mg of tumor tissue. One limitation is generation of high quality standard peptides secondary to low abundance, long sequence and multiple charge states, which decrease the peak density in liquid chromatography to an undetectable level76. Our preliminary experiments suggest very low EGFR signals in human lung cancer tumor tissue models. A larger screen of more tumors (~100) could uncover true patterns of EGFR phosphorylation across different lung cancers and could be performed using this approach. While speculative, the low levels of EGFR could be related to low response to EGFR kinase inhibitors outside of the mutation positive group. This will require a larger group of tumors for analysis and overcoming hurdles including having adequate amounts of tumor tissue on advanced lung cancer patients snap frozen. Most advanced lung cancer patients have small needle biopsies and thus do not procure enough tumor tissue. In addition, it is rare to find institutions that snap freeze tumor biopsies.
In summary, we have developed a proteomic approach which has merits in qualitatively and quantitatively characterizing multiple phosphorylation events on EGFR. Using this approach, we identified 30 phosphorylation sites including pS, pT, and pY from three sources of EGFR. The use of estimated stoichiometry as a quantitative assay allows assessment of response of phosphorylation to TKI treatment by integrated peak areas for the phosphopeptide and the corresponding unmodified peptide. We identified sites that correlated with EGFR mutation and/or erlotinib sensitivity across a panel of 31 lung cancer cell lines. Five phosphorylation EGFR sites were found to be inhibited by erlotinib; two representative sites were validated by quantitative western blot and LC-MRM, based on available of antibody and high intensity transitions, respectively. This approach could be useful as a biomarker discovery platform to identify important phosphoryation or other post-translational events on disease related proteins.
Supplementary Material
Acknowledgments
We thank OSI Pharmaceuticals and Genentech for providing erlotinib, Rasa Hamilton for editorial assistance, and Patricia Johnston for administrative assistance. The work was partially funded by grants from the National Functional Genomics Center and the Moffitt Lung SPORE (5P50CA119997). The Moffitt Proteomics Facility is supported by the US Army Medical Research and Material Command under Award No. DAMD17-02-2-0051 for a National Functional Genomics Center, the National Cancer Institute under Award No. P30-CA076292 as a Cancer Center Support Grant, and the Moffitt Foundation. The triple quadrupole mass spectrometer was purchased with a shared instrument grant from the Bankhead-Coley Cancer Research program of the Florida Department of Health (06BS-02-9614).
References
- 1.Blume-Jensen P, Hunter T. Oncogenic kinase signalling. Nature. 2001;411(6835):355–65. doi: 10.1038/35077225. [DOI] [PubMed] [Google Scholar]
- 2.Pawson T. Specificity in signal transduction: from phosphotyrosine-SH2 domain interactions to complex cellular systems. Cell. 2004;116(2):191–203. doi: 10.1016/s0092-8674(03)01077-8. [DOI] [PubMed] [Google Scholar]
- 3.Hackel PO, Zwick E, Prenzel N, Ullrich A. Epidermal growth factor receptors: critical mediators of multiple receptor pathways. Curr Opin Cell Biol. 1999;11(2):184–9. doi: 10.1016/s0955-0674(99)80024-6. [DOI] [PubMed] [Google Scholar]
- 4.Zwick E, Hackel PO, Prenzel N, Ullrich A. The EGF receptor as central transducer of heterologous signalling systems. Trends Pharmacol Sci. 1999;20(10):408–12. doi: 10.1016/s0165-6147(99)01373-5. [DOI] [PubMed] [Google Scholar]
- 5.Schulze WX, Deng L, Mann M. Phosphotyrosine interactome of the ErbB-receptor kinase family. Mol Syst Biol. 2005;1:2005–0008. doi: 10.1038/msb4100012. [DOI] [PMC free article] [PubMed] [Google Scholar]
- 6.Dowell J, Minna JD, Kirkpatrick P. Erlotinib hydrochloride. Nat Rev Drug Discov. 2005;4(1):13–4. doi: 10.1038/nrd1612. [DOI] [PubMed] [Google Scholar]
- 7.Melnikova I, Golden J. Targeting protein kinases. Nat Rev Drug Discov. 2004;3(12):993–4. doi: 10.1038/nrd1600. [DOI] [PubMed] [Google Scholar]
- 8.Copeman M. Prolonged response to first-line erlotinib for advanced lung adenocarcinoma. J Exp Clin Cancer Res. 2008;27:59. doi: 10.1186/1756-9966-27-59. [DOI] [PMC free article] [PubMed] [Google Scholar]
- 9.Sharma SP. New predictors of survival for early-stage NSCLC. Lancet Oncol. 2007;8(4):288. doi: 10.1016/s1470-2045(07)70092-x. [DOI] [PubMed] [Google Scholar]
- 10.Sharma SP. Gene signature for predicting NSCLC outcome. Lancet Oncol. 2007;8(2):105. doi: 10.1016/s1470-2045(07)70024-4. [DOI] [PubMed] [Google Scholar]
- 11.Sharma SV, Bell DW, Settleman J, Haber DA. Epidermal growth factor receptor mutations in lung cancer. Nat Rev Cancer. 2007;7(3):169–81. doi: 10.1038/nrc2088. [DOI] [PubMed] [Google Scholar]
- 12.Morandell S, Stasyk T, Skvortsov S, Ascher S, Huber LA. Quantitative proteomics and phosphoproteomics reveal novel insights into complexity and dynamics of the EGFR signaling network. Proteomics. 2008;8(21):4383–401. doi: 10.1002/pmic.200800204. [DOI] [PubMed] [Google Scholar]
- 13.Rikova K, Guo A, Zeng Q, Possemato A, Yu J, Haack H, Nardone J, Lee K, Reeves C, Li Y, Hu Y, Tan Z, Stokes M, Sullivan L, Mitchell J, Wetzel R, Macneill J, Ren JM, Yuan J, Bakalarski CE, Villen J, Kornhauser JM, Smith B, Li D, Zhou X, Gygi SP, Gu TL, Polakiewicz RD, Rush J, Comb MJ. Global survey of phosphotyrosine signaling identifies oncogenic kinases in lung cancer. Cell. 2007;131(6):1190–203. doi: 10.1016/j.cell.2007.11.025. [DOI] [PubMed] [Google Scholar]
- 14.Blagoev B, Kratchmarova I, Ong SE, Nielsen M, Foster LJ, Mann M. A proteomics strategy to elucidate functional protein-protein interactions applied to EGF signaling. Nat Biotechnol. 2003;21(3):315–8. doi: 10.1038/nbt790. [DOI] [PubMed] [Google Scholar]
- 15.Boeri Erba E, Bergatto E, Cabodi S, Silengo L, Tarone G, Defilippi P, Jensen ON. Systematic analysis of the epidermal growth factor receptor by mass spectrometry reveals stimulation-dependent multisite phosphorylation. Mol Cell Proteomics. 2005;4(8):1107–21. doi: 10.1074/mcp.M500070-MCP200. [DOI] [PubMed] [Google Scholar]
- 16.Huang PH, White FM. Phosphoproteomics: unraveling the signaling web. Mol Cell. 2008;31(6):777–81. doi: 10.1016/j.molcel.2008.09.001. [DOI] [PMC free article] [PubMed] [Google Scholar]
- 17.Olsen JV, Blagoev B, Gnad F, Macek B, Kumar C, Mortensen P, Mann M. Global, in vivo, and site-specific phosphorylation dynamics in signaling networks. Cell. 2006;127(3):635–48. doi: 10.1016/j.cell.2006.09.026. [DOI] [PubMed] [Google Scholar]
- 18.Oppermann FS, Gnad F, Olsen JV, Hornberger R, Greff Z, Keri G, Mann M, Daub H. Large-scale proteomics analysis of the human kinome. Mol Cell Proteomics. 2009;8(7):1751–64. doi: 10.1074/mcp.M800588-MCP200. [DOI] [PMC free article] [PubMed] [Google Scholar]
- 19.Oyama M, Kozuka-Hata H, Tasaki S, Semba K, Hattori S, Sugano S, Inoue J, Yamamoto T. Temporal perturbation of tyrosine phosphoproteome dynamics reveals the systemwide regulatory networks. Mol Cell Proteomics. 2009;8(2):226–31. doi: 10.1074/mcp.M800186-MCP200. [DOI] [PubMed] [Google Scholar]
- 20.Pan C, Olsen JV, Daub H, Mann M. Global effects of kinase inhibitors on signaling networks revealed by quantitative phosphoproteomics. Mol Cell Proteomics. 2009 doi: 10.1074/mcp.M900285-MCP200. [DOI] [PMC free article] [PubMed] [Google Scholar]
- 21.Zhang Y, Wolf-Yadlin A, Ross PL, Pappin DJ, Rush J, Lauffenburger DA, White FM. Time-resolved mass spectrometry of tyrosine phosphorylation sites in the epidermal growth factor receptor signaling network reveals dynamic modules. Mol Cell Proteomics. 2005;4(9):1240–50. doi: 10.1074/mcp.M500089-MCP200. [DOI] [PubMed] [Google Scholar]
- 22.VanMeter AJ, Rodriguez AS, Bowman ED, Jen J, Harris CC, Deng J, Calvert VS, Silvestri A, Fredolini C, Chandhoke V, Petricoin EF, 3rd, Liotta LA, Espina V. Laser capture microdissection and protein microarray analysis of human non-small cell lung cancer: differential epidermal growth factor receptor (EGPR) phosphorylation events associated with mutated EGFR compared with wild type. Mol Cell Proteomics. 2008;7(10):1902–24. doi: 10.1074/mcp.M800204-MCP200. [DOI] [PMC free article] [PubMed] [Google Scholar]
- 23.Wu SL, Kim J, Bandle RW, Liotta L, Petricoin E, Karger BL. Dynamic profiling of the post-translational modifications and interaction partners of epidermal growth factor receptor signaling after stimulation by epidermal growth factor using Extended Range Proteomic Analysis (ERPA) Mol Cell Proteomics. 2006;5(9):1610–27. doi: 10.1074/mcp.M600105-MCP200. [DOI] [PubMed] [Google Scholar]
- 24.Wissing J, Jansch L, Nimtz M, Dieterich G, Hornberger R, Keri G, Wehland J, Daub H. Proteomics analysis of protein kinases by target class-selective prefractionation and tandem mass spectrometry. Mol Cell Proteomics. 2007;6(3):537–47. doi: 10.1074/mcp.T600062-MCP200. [DOI] [PubMed] [Google Scholar]
- 25.Wu SL, Kim J, Hancock WS, Karger B. Extended Range Proteomic Analysis (ERPA): a new and sensitive LC-MS platform for high sequence coverage of complex proteins with extensive post-translational modifications-comprehensive analysis of beta-casein and epidermal growth factor receptor (EGFR) J Proteome Res. 2005;4(4):1155–70. doi: 10.1021/pr050113n. [DOI] [PubMed] [Google Scholar]
- 26.Tong J, Taylor P, Jovceva E, St-Germain JR, Jin LL, Nikolic A, Gu X, Li ZH, Trudel S, Moran MF. Tandem immunoprecipitation of phosphotyrosine-mass spectrometry (TIPY-MS) indicates C19ORF19 becomes tyrosine-phosphorylated and associated with activated epidermal growth factor receptor. J Proteome Res. 2008;7(3):1067–77. doi: 10.1021/pr7006363. [DOI] [PubMed] [Google Scholar]
- 27.Tong J, Taylor P, Peterman SM, Prakash A, Moran MF. Epidermal growth factor receptor phosphorylation sites Ser991 and Tyr998 are implicated in the regulation of receptor endocytosis and phosphorylations at Ser1039 and Thr1041. Mol Cell Proteomics. 2009;8(9):2131–44. doi: 10.1074/mcp.M900148-MCP200. [DOI] [PMC free article] [PubMed] [Google Scholar]
- 28.Guha U, Chaerkady R, Marimuthu A, Patterson AS, Kashyap MK, Harsha HC, Sato M, Bader JS, Lash AE, Minna JD, Pandey A, Varmus HE. Comparisons of tyrosine phosphorylated proteins in cells expressing lung cancer-specific alleles of EGFR and KRAS. Proc Natl Acad Sci U S A. 2008;105(37):14112–7. doi: 10.1073/pnas.0806158105. [DOI] [PMC free article] [PubMed] [Google Scholar]
- 29.Guo A, Villen J, Kornhauser J, Lee KA, Stokes MP, Rikova K, Possemato A, Nardone J, Innocenti G, Wetzel R, Wang Y, MacNeill J, Mitchell J, Gygi SP, Rush J, Polakiewicz RD, Comb MJ. Signaling networks assembled by oncogenic EGFR and c-Met. Proc Natl Acad Sci U S A. 2008;105(2):692–7. doi: 10.1073/pnas.0707270105. [DOI] [PMC free article] [PubMed] [Google Scholar]
- 30.Macek B, Mann M, Olsen JV. Global and site-specific quantitative phosphoproteomics: principles and applications. Annu Rev Pharmacol Toxicol. 2009;49:199–221. doi: 10.1146/annurev.pharmtox.011008.145606. [DOI] [PubMed] [Google Scholar]
- 31.Heisermann GJ, Gill GN. Epidermal growth factor receptor threonine and serine residues phosphorylated in vivo. J Biol Chem. 1988;263(26):13152–8. [PubMed] [Google Scholar]
- 32.Heisermann GJ, Wiley HS, Walsh BJ, Ingraham HA, Fiol CJ, Gill GN. Mutational removal of the Thr669 and Ser671 phosphorylation sites alters substrate specificity and ligand-induced internalization of the epidermal growth factor receptor. J Biol Chem. 1990;265(22):12820–7. [PubMed] [Google Scholar]
- 33.Bishayee A, Beguinot L, Bishayee S. Phosphorylation of tyrosine 992, 1068, and 1086 is required for conformational change of the human epidermal growth factor receptor c-terminal tail. Mol Biol Cell. 1999;10(3):525–36. doi: 10.1091/mbc.10.3.525. [DOI] [PMC free article] [PubMed] [Google Scholar]
- 34.Kuppuswamy D, Dalton M, Pike LJ. Serine 1002 is a site of in vivo and in vitro phosphorylation of the epidermal growth factor receptor. J Biol Chem. 1993;268(25):19134–42. [PubMed] [Google Scholar]
- 35.Pao W, Miller V, Zakowski M, Doherty J, Politi K, Sarkaria I, Singh B, Heelan R, Rusch V, Fulton L, Mardis E, Kupfer D, Wilson R, Kris M, Varmus H. EGF receptor gene mutations are common in lung cancers from “never smokers” and are associated with sensitivity of tumors to gefitinib and erlotinib. Proc Natl Acad Sci U S A. 2004;101(36):13306–11. doi: 10.1073/pnas.0405220101. [DOI] [PMC free article] [PubMed] [Google Scholar]
- 36.Morgan MA, Parsels LA, Kollar LE, Normolle DP, Maybaum J, Lawrence TS. The combination of epidermal growth factor receptor inhibitors with gemcitabine and radiation in pancreatic cancer. Clin Cancer Res. 2008;14(16):5142–9. doi: 10.1158/1078-0432.CCR-07-4072. [DOI] [PMC free article] [PubMed] [Google Scholar]
- 37.Tan AR, Yang X, Hewitt SM, Berman A, Lepper ER, Sparreboom A, Parr AL, Figg WD, Chow C, Steinberg SM, Bacharach SL, Whatley M, Carrasquillo JA, Brahim JS, Ettenberg SA, Lipkowitz S, Swain SM. Evaluation of biologic end points and pharmacokinetics in patients with metastatic breast cancer after treatment with erlotinib, an epidermal growth factor receptor tyrosine kinase inhibitor. J Clin Oncol. 2004;22(15):3080–90. doi: 10.1200/JCO.2004.08.189. [DOI] [PubMed] [Google Scholar]
- 38.Zhang X, Zhang H, Tighiouart M, Lee JE, Shin HJ, Khuri FR, Yang CS, Chen ZG, Shin DM. Synergistic inhibition of head and neck tumor growth by green tea (-)-epigallocatechin-3-gallate and EGFR tyrosine kinase inhibitor. Int J Cancer. 2008;123(5):1005–14. doi: 10.1002/ijc.23585. [DOI] [PMC free article] [PubMed] [Google Scholar]
- 39.Li T, Ling YH, Perez-Soler R. Tumor dependence on the EGFR signaling pathway expressed by the p-EGFR:p-AKT ratio predicts erlotinib sensitivity in human non-small cell lung cancer (NSCLC) cells expressing wild-type EGFR gene. J Thorac Oncol. 2008;3(6):643–7. doi: 10.1097/JTO.0b013e3181753b24. [DOI] [PubMed] [Google Scholar]
- 40.Makarov A, Denisov E, Lange O, Horning S. Dynamic range of mass accuracy in LTQ Orbitrap hybrid mass spectrometer. J Am Soc Mass Spectrom. 2006;17(7):977–82. doi: 10.1016/j.jasms.2006.03.006. [DOI] [PubMed] [Google Scholar]
- 41.Yates JR, Ruse CI, Nakorchevsky A. Proteomics by mass spectrometry: approaches, advances, and applications. Annu Rev Biomed Eng. 2009;11:49–79. doi: 10.1146/annurev-bioeng-061008-124934. [DOI] [PubMed] [Google Scholar]
- 42.Witze ES, Old WM, Resing KA, Ahn NG. Mapping protein post-translational modifications with mass spectrometry. Nat Methods. 2007;4(10):798–806. doi: 10.1038/nmeth1100. [DOI] [PubMed] [Google Scholar]
- 43.Gnad F, Ren S, Cox J, Olsen JV, Macek B, Oroshi M, Mann M. PHOSIDA (phosphorylation site database): management, structural and evolutionary investigation, and prediction of phosphosites. Genome Biol. 2007;8(11):R250. doi: 10.1186/gb-2007-8-11-r250. [DOI] [PMC free article] [PubMed] [Google Scholar]
- 44.Diella F, Gould CM, Chica C, Via A, Gibson TJ. Phospho.ELM: a database of phosphorylation sites--update 2008. Nucleic Acids Res. 2008;36(Database issue):D240–4. doi: 10.1093/nar/gkm772. [DOI] [PMC free article] [PubMed] [Google Scholar]
- 45.Linding R, Jensen LJ, Pasculescu A, Olhovsky M, Colwill K, Bork P, Yaffe MB, Pawson T. NetworKIN: a resource for exploring cellular phosphorylation networks. Nucleic Acids Res. 2008;36(Database issue):D695–9. doi: 10.1093/nar/gkm902. [DOI] [PMC free article] [PubMed] [Google Scholar]
- 46.Hornbeck PV, Chabra I, Kornhauser JM, Skrzypek E, Zhang B. PhosphoSite: A bioinformatics resource dedicated to physiological protein phosphorylation. Proteomics. 2004;4(6):1551–61. doi: 10.1002/pmic.200300772. [DOI] [PubMed] [Google Scholar]
- 47.Li H, Xing X, Ding G, Li Q, Wang C, Xie L, Zeng R, Li Y. SysPTM: a systematic resource for proteomic research on post-translational modifications. Mol Cell Proteomics. 2009;8(8):1839–49. doi: 10.1074/mcp.M900030-MCP200. [DOI] [PMC free article] [PubMed] [Google Scholar]
- 48.Obenauer JC, Cantley LC, Yaffe MB. Scansite 2.0: Proteome-wide prediction of cell signaling interactions using short sequence motifs. Nucleic Acids Res. 2003;31(13):3635–41. doi: 10.1093/nar/gkg584. [DOI] [PMC free article] [PubMed] [Google Scholar]
- 49.Li J, Rix U, Fang B, Bai Y, Edwards A, Colinge J, Bennett KL, Gao J, Song L, Eschrich S, Superti-Furga G, Koomen J, Haura EB. A chemical and phosphoproteomic characterization of dasatinib action in lung cancer. Nat Chem Biol. 6(4):291–9. doi: 10.1038/nchembio.332. [DOI] [PMC free article] [PubMed] [Google Scholar]
- 50.Patel VJ, Thalassinos K, Slade SE, Connolly JB, Crombie A, Murrell JC, Scrivens JH. A comparison of labeling and label-free mass spectrometry-based proteomics approaches. J Proteome Res. 2009;8(7):3752–9. doi: 10.1021/pr900080y. [DOI] [PubMed] [Google Scholar]
- 51.MacCoss MJ, Wu CC, Yates JR., 3rd Probability-based validation of protein identifications using a modified SEQUEST algorithm. Anal Chem. 2002;74(21):5593–9. doi: 10.1021/ac025826t. [DOI] [PubMed] [Google Scholar]
- 52.Perkins DN, Pappin DJ, Creasy DM, Cottrell JS. Probability-based protein identification by searching sequence databases using mass spectrometry data. Electrophoresis. 1999;20(18):3551–67. doi: 10.1002/(SICI)1522-2683(19991201)20:18<3551::AID-ELPS3551>3.0.CO;2-2. [DOI] [PubMed] [Google Scholar]
- 53.Hirosawa M, Hoshida M, Ishikawa M, Toya T. MASCOT: multiple alignment system for protein sequences based on three-way dynamic programming. Comput Appl Biosci. 1993;9(2):161–7. doi: 10.1093/bioinformatics/9.2.161. [DOI] [PubMed] [Google Scholar]
- 54.Blackburn K, Goshe MB. Challenges and strategies for targeted phosphorylation site identification and quantification using mass spectrometry analysis. Brief Funct Genomic Proteomic. 2009;8(2):90–103. doi: 10.1093/bfgp/eln051. [DOI] [PubMed] [Google Scholar]
- 55.Nichols AM, White FM. Manual validation of peptide sequence and sites of tyrosine phosphorylation from MS/MS spectra. Methods Mol Biol. 2009;492:143–60. doi: 10.1007/978-1-59745-493-3_8. [DOI] [PubMed] [Google Scholar]
- 56.Prakash A, Tomazela DM, Frewen B, Maclean B, Merrihew G, Peterman S, Maccoss MJ. Expediting the development of targeted SRM assays: using data from shotgun proteomics to automate method development. J Proteome Res. 2009;8(6):2733–9. doi: 10.1021/pr801028b. [DOI] [PMC free article] [PubMed] [Google Scholar]
- 57.MacLean B, Tomazela DM, Shulman N, Chambers M, Finney GL, Frewen B, Kern R, Tabb DL, Liebler DC, MacCoss MJ. Skyline: an open source document editor for creating and analyzing targeted proteomics experiments. Bioinformatics. 26(7):966–8. doi: 10.1093/bioinformatics/btq054. [DOI] [PMC free article] [PubMed] [Google Scholar]
- 58.Zeger SL, Liang KY. Longitudinal data analysis for discrete and continuous outcomes. Biometrics. 1986;42(1):121–30. [PubMed] [Google Scholar]
- 59.Gandhi J, Zhang J, Xie Y, Soh J, Shigematsu H, Zhang W, Yamamoto H, Peyton M, Girard L, Lockwood WW, Lam WL, Varella-Garcia M, Minna JD, Gazdar AF. Alterations in genes of the EGFR signaling pathway and their relationship to EGFR tyrosine kinase inhibitor sensitivity in lung cancer cell lines. PLoS One. 2009;4(2):e4576. doi: 10.1371/journal.pone.0004576. [DOI] [PMC free article] [PubMed] [Google Scholar]
- 60.Gotoh N, Tojo A, Muroya K, Hashimoto Y, Hattori S, Nakamura S, Takenawa T, Yazaki Y, Shibuya M. Epidermal growth factor-receptor mutant lacking the autophosphorylation sites induces phosphorylation of Shc protein and Shc-Grb2/ASH association and retains mitogenic activity. Proc Natl Acad Sci U S A. 1994;91(1):167–71. doi: 10.1073/pnas.91.1.167. [DOI] [PMC free article] [PubMed] [Google Scholar]
- 61.Sorkin A, Helin K, Waters CM, Carpenter G, Beguinot L. Multiple autophosphorylation sites of the epidermal growth factor receptor are essential for receptor kinase activity and internalization. Contrasting significance of tyrosine 992 in the native and truncated receptors. J Biol Chem. 1992;267(12):8672–8. [PubMed] [Google Scholar]
- 62.Sorkin A, Waters C, Overholser KA, Carpenter G. Multiple autophosphorylation site mutations of the epidermal growth factor receptor. Analysis of kinase activity and endocytosis. J Biol Chem. 1991;266(13):8355–62. [PubMed] [Google Scholar]
- 63.Hsu CY, Hurwitz DR, Mervic M, Zilberstein A. Autophosphorylation of the intracellular domain of the epidermal growth factor receptor results in different effects on its tyrosine kinase activity with various peptide substrates. Phosphorylation of peptides representing Tyr(P) sites of phospholipase C-gamma. J Biol Chem. 1991;266(1):603–8. [PubMed] [Google Scholar]
- 64.Margolis BL, Lax I, Kris R, Dombalagian M, Honegger AM, Howk R, Givol D, Ullrich A, Schlessinger J. All autophosphorylation sites of epidermal growth factor (EGF) receptor and HER2/neu are located in their carboxyl-terminal tails. Identification of a novel site in EGF receptor. J Biol Chem. 1989;264(18):10667–71. [PubMed] [Google Scholar]
- 65.Gates RE, King LE., Jr Different forms of the epidermal growth factor receptor kinase have different autophosphorylation sites. Biochemistry. 1985;24(19):5209–15. doi: 10.1021/bi00340a038. [DOI] [PubMed] [Google Scholar]
- 66.Downward J, Parker P, Waterfield MD. Autophosphorylation sites on the epidermal growth factor receptor. Nature. 1984;311(5985):483–5. doi: 10.1038/311483a0. [DOI] [PubMed] [Google Scholar]
- 67.Countaway JL, Northwood IC, Davis RJ. Mechanism of phosphorylation of the epidermal growth factor receptor at threonine 669. J Biol Chem. 1989;264(18):10828–35. [PubMed] [Google Scholar]
- 68.Saito T, Okada S, Ohshima K, Yamada E, Sato M, Uehara Y, Shimizu H, Pessin JE, Mori M. Differential activation of epidermal growth factor (EGF) receptor downstream signaling pathways by betacellulin and EGF. Endocrinology. 2004;145(9):4232–43. doi: 10.1210/en.2004-0401. [DOI] [PubMed] [Google Scholar]
- 69.Zhang Y, Yan Z, Farooq A, Liu X, Lu C, Zhou MM, He C. Molecular basis of distinct interactions between Dok1 PTB domain and tyrosine-phosphorylated EGF receptor. J Mol Biol. 2004;343(4):1147–55. doi: 10.1016/j.jmb.2004.08.072. [DOI] [PubMed] [Google Scholar]
- 70.Jiang X, Huang F, Marusyk A, Sorkin A. Grb2 regulates internalization of EGF receptors through clathrin-coated pits. Mol Biol Cell. 2003;14(3):858–70. doi: 10.1091/mbc.E02-08-0532. [DOI] [PMC free article] [PubMed] [Google Scholar]
- 71.Hirsch FR, Varella-Garcia M, Cappuzzo F. Predictive value of EGFR and HER2 overexpression in advanced non-small-cell lung cancer. Oncogene. 2009;28 (Suppl 1):S32–7. doi: 10.1038/onc.2009.199. [DOI] [PubMed] [Google Scholar]
- 72.Erlotinib in Lung Cancer. N Engl J Med. 2005;353(16):3. [PubMed] [Google Scholar]
- 73.Tsao MS, Sakurada A, Cutz JC, Zhu CQ, Kamel-Reid S, Squire J, Lorimer I, Zhang T, Liu N, Daneshmand M, Marrano P, da Cunha Santos G, Lagarde A, Richardson F, Seymour L, Whitehead M, Ding K, Pater J, Shepherd FA. Erlotinib in lung cancer - molecular and clinical predictors of outcome. N Engl J Med. 2005;353(2):133–44. doi: 10.1056/NEJMoa050736. [DOI] [PubMed] [Google Scholar]
- 74.Wolf-Yadlin A, Hautaniemi S, Lauffenburger DA, White FM. Multiple reaction monitoring for robust quantitative proteomic analysis of cellular signaling networks. Proc Natl Acad Sci U S A. 2007;104(14):5860–5. doi: 10.1073/pnas.0608638104. [DOI] [PMC free article] [PubMed] [Google Scholar]
- 75.Tworoger SS, Spentzos D, Grall FT, Liebermann TA, Hankinson SE. Reproducibility of proteomic profiles over 3 years in postmenopausal women not taking postmenopausal hormones. Cancer Epidemiol Biomarkers Prev. 2008;17(6):1480–5. doi: 10.1158/1055-9965.EPI-07-2725. [DOI] [PubMed] [Google Scholar]
- 76.Jin LL, Tong J, Prakash A, Peterman SM, St-Germain JR, Taylor P, Trudel S, Moran MF. Measurement of protein phosphorylation stoichiometry by selected reaction monitoring mass spectrometry. J Proteome Res. 9(5):2752–61. doi: 10.1021/pr100024a. [DOI] [PubMed] [Google Scholar]
Associated Data
This section collects any data citations, data availability statements, or supplementary materials included in this article.


