Abstract
In this paper, we provide a quantitative electroencephalogram (EEG) analysis to study the effect of hypothermia on the neurological recovery of brain after cardiac arrest. We hypothesize that the brain injury results in a reduction in information of the brain rhythm. To measure the information content of the EEG a new measure called information quantity (IQ), which is the Shannon entropy of decorrelated EEG signals, is developed. For decorrelating EEG signals, we use the discrete wavelet transform (DWT) which is known to have good decorrelating properties and to show a good match to the standard clinical bands in EEG. In measuring the amount of information, IQ shows better tracking capability for dynamic amplitude change and frequency component change than conventional entropy-based measures. Experiments are carried out in rodents (n = 30) to monitor the neurological recovery after cardiac arrest. In addition, EEG signal recovery under normothermic (37 °C) and hypothermic (33 °C) resuscitation following 5, 7, and 9 min of cardiac arrest is recorded and analyzed. Experimental results show that the IQ is greater for hypothermic than normothermic rats, with an IQ difference of more than 0.20 (0.20 ± 0.11 is 95% condidence interval). The results quantitatively support the hypothesis that hypothermia accelerates the electrical recovery from brain injury after cardiac arrest.
Keywords: Brain injury, cardiac arrest, EEG, entropy, hypothermia, wavelet
I. Introduction
ELECTROENCEPHALOGRAM (EEG) is a record of electric activity from the scalp, obtained with the aid of an array of electrodes. The development of quantitative EEG analysis was motivated by the need for objective measures as well as some degree of automation [1]. Quantitative EEG analysis shows promising results as a tool for diagnostic monitoring of brain injury such as after resuscitation from cardiac arrest [2]-[5].
The effects of changes in brain temperature on electroencephalogram (EEG) have been already exploited since 1930s [6]. Recently the relation between hypothermia and EEG has been reported by [7], [8]. These results may support the hypothesis that therapeutic hypothermia, which is to lower the body’s temperature after cardiac arrest, dramatically increases the chances of recovery and improves the neurological outcome [9]-[11].
However, most of results have been based on subjective and qualitative observations and not a quantitative EEG-based analysis of the effect of therapeutic hypothermia after cardiac arrest. Here, we provide a quantitative, entropy or information based, analysis of EEG for studying the effect of the therapeutic hypothermia on neurological recovery after cardiac arrest. We hypothesize that brain injury results in a reduction in information content of the brain rhythm. Further we test the hypothesis that the neurological recovery in the brain is reflected in the information content in EEG signals. From the perspective of the information theory, the information contained in a signal can be physically quantified by calculating the entropy [12]. The entropy-based EEG analysis methods have recently been developed and showed promising results [2]-[4]. For example, Tong et al. used the time dependent entropy (TDE) measure to study EEG during the recovery of the brain’s function from asphyxic cardiac arrest injury. They also compared Tsallis and Renyi entropy methods for hypoxic ischemic injury.
The EEG as a physical signal can be divided into its predictable component and the uncertain component, and the amount of information contained in the signal is more related to the uncertain parts. Thus, for an accurate information measurement, the predictable component, which is called the information redundancy, need to be removed as much as possible. Conventionally the information in EEG signals was measured without removing the information redundancy. To remove redundancy in EEG signals we use the discrete wavelet transform (DWT) for two reasons. One is that theoretical and experimental results show that correlations between values after DWT are extremely small. This means that DWT does a very good job in removing redundancy [14], [15]. The other reason is that the multiresolution decomposition of DWT results in a good match to the standard clinical bands of interest: Gamma, Beta, Alpha, Theta, and Delta (in accordance of the sampling rate of 250 Hz) [5]. Next we use the Shannon entropy (SE) to measure the uncertainty. In short, we measure the SE of decorrelated EEG signals. To distinguish the new wavelet based measure from the conventional SE, we will call it the information quantity (IQ).
II. Information Quantity (IQ)
A. Removing Redundancy Using DWT
We denoted a sampled EEG signal as s(i). To remove redundancy in EEG signals we apply DWT to s(i). Wavelet-based analysis of signals is based on a decomposition of a signal using an orthogonal family of basis function. While a sine wave based Fourier analysis is useful in analyzing periodic and time invariant phenomena, wavelet analysis is well suited for the analysis of transient, time-varying signals [14], [15].
A wavelet expansion is similar in form to the well-known Fourier series expansion, but is defined by a two-parameter family of functions
| (1) |
where j and k are integers and the function ψj,k(i) are the wavelet expansion functions. The computation of the transform is formulated as a filtering operation with two related finite impulse response (FIR) filters. The DWT coefficients, and at different scales, are calculated using the following convolution-like expressions [14]:
| (2) |
where r denotes the resolution or scale and i is the index for the samples. The operation defined in (2) is a linear digital filtering operation using filters h and g, followed by down-sampling. The coefficients and are known, respectively, as DWT coefficients at the level r scaling. The coefficients represent the source signal, s(i). Filters h and g are FIR quadrature-mirror filters known as the scaling and wavelet filters, respectively. The scaling filter is a lowpass filter, while the wavelet filter is high-pass. For an even length scaling filter the two filters are related by the following formula:
| (3) |
where l = 0, 1 ⋯ L − 1. Then the DWT coefficients consist of and for r ≥ 0. Assuming we use 2-level DWT decomposition, the DWT coefficients are
We will denote above expression as WC(r), i.e.,
| (4) |
B. Measuring Information Quantity
The SE utilizes the probability distribution to calculate the information. The classical SE is expressed in
| (5) |
where p(m) is the probability of finding the system in the mth microstate with 0 ≤ p(m) ≤ 1 and .
To analyze nonstationary EEG signals, we need to get a temporal evolution of SE. To do this an alternative time dependent SE measure based on sliding temporal window technique is applied [3], [4]. Let {s(i) : i = 1 ⋯ N} denote the raw sampled signal. Now we define a sliding temporal window w ≤ N, and the sliding step Δ ≤ w. Then sliding windows are defined by
where n = 0, 1 ⋯ [n/Δ]−w+1 and [x] denotes the integer part of x. To calculate the probability, pn(m) within each window W(n; w; Δ), we introduce intervals such that
| (6) |
Then, the probability pn(m) that the sampled signal belongs to the interval Im is the ratio between the number of the samples found within interval Im and the total number of samples in W(n; w; Δ). Using pn(m), SE(n) is defined as
| (7) |
Based on the above arguments, we can define the IQ. First the DWT coefficients within each window are obtained as
| (8) |
Then, to calculate p(m) within each transformed window WC(r; n; w; Δ), intervals in (6) are modified
| (9) |
Similar to pn(m) in SE, the probability, within each window WC(r; n; w; Δ) is calculated using (9) instead of (6). Finally IQ is defined as
| (10) |
Thus, we can explore the IQ evolution of the whole data {s(i) : i = 1 ⋯ N} with (10).
C. Comparing IQ With Conventional Wavelet Entropy (WE)
It is worth relating the IQ in (10) with the conventional WE in [5]. In the WE, the probability is calculated as the relative wavelet energy, i.e.,
| (11) |
where En(m) is the energy of the DWT coefficients in m subband and . Then the WE is defined as
| (12) |
Thus, WE measures how spread the DWT coefficients are in different subbands. The WE provides a good way to analyze short duration EEG signals. But it may show ambiguous results for signals with large dynamic amplitude range in time domain. This is because the WE is based on the normalized relative wavelet energy, not absolute energy. More substantive comparison will be shown in Section III for simulated signals.
III. Simulation Results
To illustrate the necessity of redundancy removal in calculating the entropy, computer simulations are carried out. Two signals, s1(n) and s2(n), are generated as
| (13) |
where
and
| (14) |
where P(·) is the random permutation operator. Since s2(n) is generated by randomly permutating s1(n), the two signals have the same distribution. Note that neighboring samples in s1(n) are highly correlated but s2(n) is nearly uncorrelated. We can initially expect without any calculation that more information is needed to represent s2(n) than s1(n) and, thus, s2(n) has more entropy since s2(n) quite obviously is more complex and disordered.
For the two signals we calculate IQ for various wavelet decomposition levels, r in Table I. Note the case of r = 0 which means that no DWT is applied. In this case, from the perspective of the SE the two signals are considered as the same since those have the same distribution. This leads to the unexpected result that the two signals have the same entropy. From the table we see that the SE is the same for both at 1.03. This result conflicts with our initial guess that s2(n) will have higher entropy than s1(n). But as r increases, IQ for s1(n) decreases. This implies that DWT successfully removes redundancy in s1(n). On the other hand, IQ for s2(n) is kept almost same for various r. This is because s2(n) is already uncorrelated. After 5 level decomposition, IQ for s1(n) is 0.15 and 1.13 for s2(n). This result concurs with our initial guess.
TABLE I.
IQ of the Two Signals With the Same Distribution but Different Correlation Degree
| r | 0 | 1 | 2 | 3 | 4 | 5 |
|---|---|---|---|---|---|---|
| s1(i) | 1.03 | 0.83 | 0.56 | 0.29 | 0.19 | 0.15 |
| s2(i) | 1.03 | 1.13 | 1.13 | 1.13 | 1.13 | 1.13 |
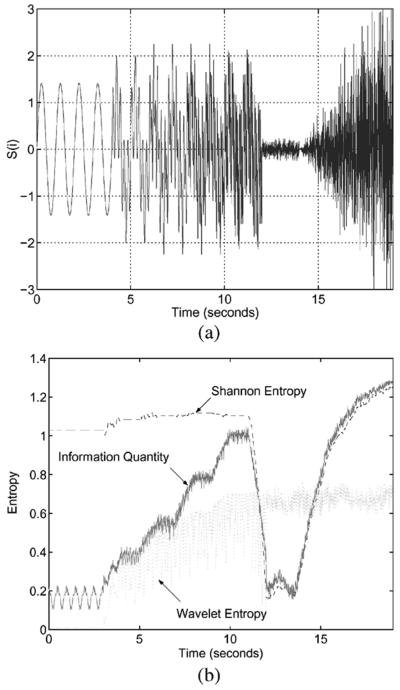
To see the time evolution of IQ, other simulated signal with multiple sinusoidal components and Gaussian distribution is used in Fig. 1. The number of sinusoids is time-dependent, systematically increasing for the first 12 s. After that, the signal has Gaussian distribution with increasing value of standard deviation. Fig. 1(a) shows the simulated signal in time domain. It starts with single sinusoid and after 4, 6, 8, and 10 s., one more sinusoid is added until 12 s. Then from 10 to 12 s., it consists of 5 sinusoids whose frequencies are 1, 5, 10, 20, and 40 Hz. Here, we can anticipate that the amount of information or entropy increases with time until 12 s, after that it will show a large decease due to the small magnitude around zero until 13 s, and it will increase continually. Fig. 1(b) shows the plots for SE, WE and IQ. From 0 to 12 s., the SE without removing redundancy is almost constant regardless of the number of sinusoidal components but IQ and WE increase in accordance with the increase of sinusoidal components. From 12 to 13 s., SE and IQ show a large decrease as expected but WE keeps constant without any responsivity to the signal change. From 13 s. IQ and WE continually increase but WE is still kept the same as before. The SE can be a good measure for observing dynamic amplitude change but may not be for frequency component change. Interestingly the WE has the opposite property to that of SE, it is good for frequency change and not good for amplitude. The proposed IQ is shown to be a good measure for both.
Fig. 1.
Time evolution of SE, WE and IQ for signal with time-varying frequency components and Gaussian distribution. (a) Time domain representation. (b) Comparison of SE, WE, and IQ.
IV. Experimental Methods
We obtained experimental EEG recording from rats during experiments designated to study the information evolution in brain rhythms following asphyxic cardiac arrest condition. This brain injury model has been approved by the animal Care and Use Committee of the Johns Hopkins Medical Institutions. Asphyxic cardiac arrest and resuscitation protocol was performed as modified from Katz and colleagues [16]. The experimental protocol is as follows.
30 Wistar rats (300 ± 25 g) were randomly assigned to different experimental conditions. Anesthesia was induced with 4% halothane and 50:50% nitrous oxide: oxygen. Baseline recording of 10 min was followed by 5-min washout, which was conducted to ensure that halothane did not have a significant effect on EEG. After 5-min washout, asphyxia was induced by stopping and disconnecting the ventilator and clamping the tracheal tube. CA was decided by observing pulselessness with mean arterial blood pressure (MABP) <10 mm Hg. Graded asphyxia of 5 (10 rats), 7 (10 rats), and 9 min (10 rats) followed. Also the resuscitation was done by chest compression until return of spontaneous circulation (i.e., achieving spontaneous MABP >60 mm Hg). After waiting for 45-min recovery, two different resuscitation conditions are applied: normothermia (37 °C) and hypothermia (33 °C). Clinical hypothermia was undertaken with sedation and paralysis, in our model, halothane maintained anesthesia was continued, and the rats were cooled using misted cold water and fan to reach a graded target temperature. In rats assigned to hyperthermia, the temperature change was undertaken at the same interval as the hypothermia group. Core temperature was monitored using the vital view Mini-mitter temperature sensor. This telemetric system allows for an untethered monitoring of core—intraperitoneal temperature. Similar system was used in the studies done at the Safar laboratories, who are pioneers in this area [17]. The extracranial temperature monitor is also closely patterned to the actual clinical situation that monitors the temperature in the urinary bladder or in the heart [10].
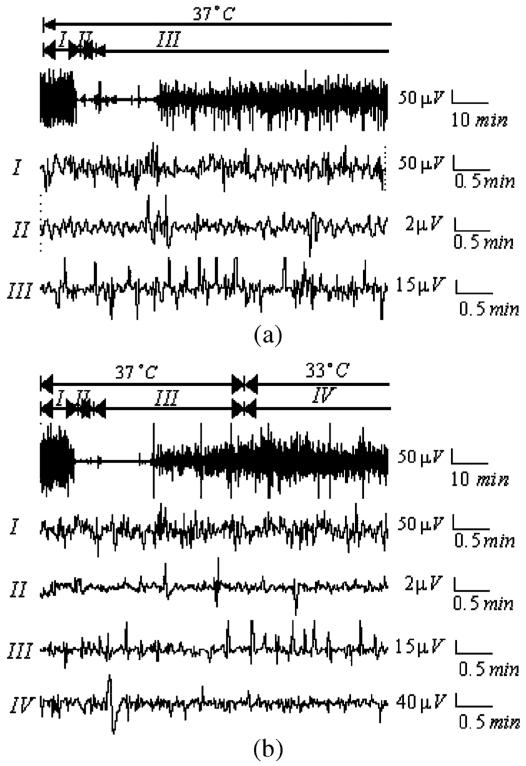
Table II summarizes the rat models used in the experiments. Two channels of EEG using subdermal needle electrodes (Grass Instruments, Quincy, MA) in right and left parietal areas, one channel of ECG and one channel of arterial pressure were recorded continuously before the insult, during the insult and about 3-hour recovery. The signals were digitized using the data acquisition package CODAS (DATAQ Instruments Inc., Akron OH). Sampling frequency of 250 Hz and 12 bit analog-to-digital conversion were used. Fig. 2(a) and (b) illustrates EEG recordings under normothermia and hypothermia, respectively.
TABLE II.
Rat Groups Used in Experiments
| Group | No. of Rat | asphyxia | temperature |
|
|---|---|---|---|---|
| hypo | normo | |||
| G 5,H | 5 | 5min | √ | |
| G 5,N | 5 | 5min | √ | |
|
| ||||
| G 7,H | 5 | 7min | √ | |
| G 7,N | 5 | 7min | √ | |
|
| ||||
| G 9,H | 5 | 9min | √ | |
| G 9,N | 5 | 9min | √ | |
Fig. 2.
Real EEG data for a rat which is recovered after asphyxic cardiac arrest. (a) EEG recording under normothermia (I) is 10 min (baseline), (II) is 7-min brain injury after cardiac arrest and (III) is recovery under normothermia (37 °C). (b) EEG recording under hypothermia (I) is 10 min (baseline), (II) is 7-min brain injury after asphyxic cardiac arrest, (III) is 45-min early recovery under normothermia and (IV) is recovery under hypothermia (33 °C).
V. Results
The EEG recording under normothermia is divided into three different phases: (I) 10-min baseline, (II) 5-, 7-, and 9-min asphyxic cardiac arrest, and (III) early recovery under normothermia. The EEG recording under hypothermia is divided into four phases: (I) 10-min baseline, (II) 5-, 7-, and 9-min asphyxic cardiac arrest, (III) early recovery under normothermia, and (IV) early recovery under hypothermia. We observed that after cardiac arrest EEG signal amplitude is highly suppressed and then gradually activated with time. However, the difference between the two EEG signals in Fig. 2 was not readily discerned from visualizing the waveform itself; i.e., the effect of hypothermia on the EEG signal recovery was not evident without quantitative analysis.
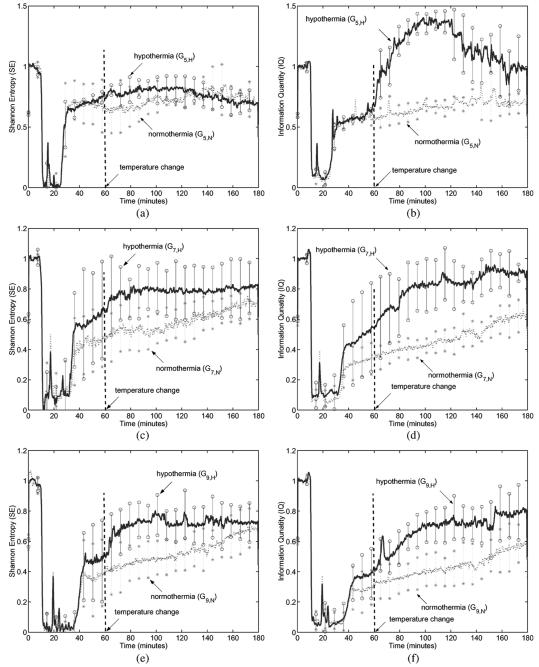
To exploit the effect of hypothermia on neurological recovery, we needed to quantify the signal differences and, thus, we calculated SE and IQ for all EEG data. The parameters used in the calculation were: sliding window length w = 500, sliding step Δ = 100, M = 10 and wavelet decomposition scale r = 6. Fig. 3 illustrates SE and IQ for all EEG data. Each curve is a result from one group of rats, i.e., each is averaged over three SE curves or IQ obtained from 5 rats under the same experimental condition. For example, the solid line in Fig. 3(a) is the averaged SE result for the group G5,H consisting of 5 rats for which the experimental conditions were 5-min asphyxia and hypothermia as described in Table II.
Fig. 3.
SE and IQ for experimental EEG data for rats under normothermia and hypothermia after 5-, 7-, and 9-min asphyxia cardiac arrest (Each curve is the averaged result over 5 rats). (a) Comparison of SE under hypothermia to SE under normothermia for 5-min brain injury. (b) Comparison of IQ under hypothermia to IQ under normothermia for 5-min brain injury. (c) Comparison of SE under hypothermia to SE under normothermia for 7-min brain injury. (d) Comparison of IQ under hypothermia to IQ under normothermia for 7-min brain injury. (e) Comparison of SE under hypothermia to SE under normothermia for 9-min brain injury. (f) Comparison of IQ under hypothermia to IQ under normothermia for 9-min brain injury.
Fig. 3(a) compares SE under hypothermia to SE under normothermia for 5-min injury and Fig. 3(b) compares IQ. During early recovery phase, before temperature change at 60 min, we observed the increase in both SE and IQ. After temperature change the difference in IQ between two plots, for hypothermia and normothermia, becomes more apparent, as shown in Fig. 3(b). The difference in SE is not so noticeable for 5-min injury. Fig. 3(c) and (d) illustrate the results for 7-min injury. In these cases, the clear distinction in EEG recovery with and without hypothermia were observed from both the SE and the IQ curves. For 9-min injury model, of which the results are shown in Fig. 3(e) and (f), similar trends were observed. In summary, both the SE and the IQ of EEG data under hypothermia are generally higher than those under normothermia for various injury levels. These results reinforce the idea that hypothermia accelerates the neurological EEG signal recovery after cardiac arrest.
Tables III and IV summarize statistical results of the SE and the IQ at 45, 70, 120, and 180 min, respectively. Also averaged SE and IQ from 120 to 180 min for each group are calculated. Comparing the results at 45 to 70 min, we observed a noticeable increase for the groups under hypothermia as visually seen in Fig. 3. The averaged SE and IQ under hypothermia are higher than those in normothermia. Also groups under longer injury period result in lower SE and IQ. This result coincides with the fact that the longer injury period is, the worse the neurological recovery is. To compare the hypothermia results to the normothermia, we calculate the difference of the average values using t-test.
TABLE III.
Statistical Results of SE
| Group | Shannon Entropy (SE, Mean ± SD) |
|||||
|---|---|---|---|---|---|---|
| 45 min | 70 min | 120 min | 180 min | Average | t-value (p) | |
| G 5,H | 0.70 ± 0.02 | 0.73 ± 0.04 | 0.75 ± 0.02 | 0.67 ± 0.09 | 0.74 ± 0.11 | −0.32 |
| G 5,N | 0.70 ± 0.15 | 0.67 ± 0.19 | 0.74 ± 0.09 | 0.71 ± 0.14 | 0.76 ± 0.09 | (0.3078) |
|
| ||||||
| G 7,H | 0.38 ± 0.18 | 0.69 ± 0.09 | 0.69 ± 0.08 | 0.70 ± 0.09 | 0.80 ± 0.09 | 1.61 |
| G 7,N | 0.36 ± 0.23 | 0.42 ± 0.25 | 0.48 ± 0.12 | 0.65 ± 0.18 | 0.65 ± 0.10 | (0.086) |
|
| ||||||
| G 9,H | 0.37 ± 0.17 | 0.61 ± 0.08 | 0.64 ± 0.09 | 0.62 ± 0.10 | 0.73 ± 0.14 | 1.61 |
| G 9,N | 0.13 ± 0.08 | 0.20 ± 0.03 | 0.44 ± 0.02 | 0.60 ± 0.04 | 0.60 ± 0.12 | (0.073) |
Note: In t-value, we compared the averaged SE of hypothermia group with that of normothermia.
TABLE IV.
Statistical Results of IQ
| Group | Information Quantity (IQ, Mean ± SD) |
|||||
|---|---|---|---|---|---|---|
| 45 min | 70 min | 120 min | 180 min | Average | t-value (p) | |
| G 5,H | 0.58 ± 0.01 | 0.97 ± 0.11 | 1.22 ± 0.07 | 0.90 ± 0.25 | 1.09 ± 0.23 | 3.40 |
| G 5,N | 0.56 ± 0.04 | 0.56 ± 0.07 | 0.62 ± 0.03 | 0.66 ± 0.08 | 0.71 ± 0.09 | (0.005) |
|
| ||||||
| G 7,H | 0.28 ± 0.06 | 0.45 ± 0.08 | 0.82 ± 0.06 | 0.83 ± 0.01 | 0.99 ± 0.12 | 5.00 |
| G 7,N | 0.25 ± 0.10 | 0.32 ± 0.13 | 0.38 ± 0.08 | 0.56 ± 0.22 | 0.55 ± 0.10 | (0.0005) |
|
| ||||||
| G 9,H | 0.26 ± 0.16 | 0.40 ± 0.08 | 0.65 ± 0.11 | 0.76 ± 0.13 | 0.75 ± 0.15 | 2.83 |
| G 9,N | 0.12 ± 0.09 | 0.19 ± 0.08 | 0.30 ± 0.11 | 0.42 ± 0.13 | 0.50 ± 0.13 | (0.01) |
Note: In t-value, we compared the averaged IQ of hypothermia group with that of normothermia.
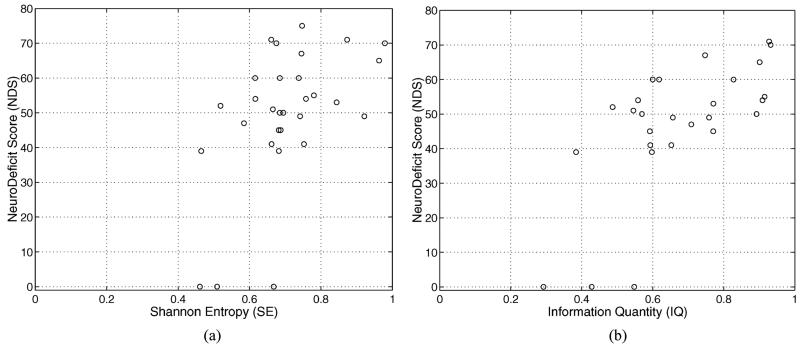
To validate the quantitative EEG measure such as SE and IQ, an independent observer using a comprehensive behavioral examination serially evaluated a single neurological deficit score (NDS) after injury. The overall template of the NDS is patterned after the standard neurologic examination in humans. The NDS was determined at 6 h after injury. The NDS ranges from 80 (best) to 0 (brain dead) and its score is based on general behavioral, brain-stem function, motor assessment, sensory assessment, motor behavior and seizures. The NDS and its detail components can be found in [18]. Fig. 4 gives a better illustration of the correlation between quantitative measures and NDS.
Fig. 4.
The quantitative EEG measures (SE or IQ) versus NDS (a) averaged SE versus NDS. (b) Averaged IQ versus NDS.
VI. Discussion and Conclusion
Recently entropy based methods have been developed to analyze EEG data and showed good results [2]-[13]. One approach measured the entropy using a probability distribution of signal amplitude in time domain. Thus, it successfully detected local irregularity in time domain. Another approach, such as the WE in (12), calculated EEG power in different bands and measured how wide the power distributes in frequency bands. Therefore, the WE is a good measure of spectral order/disorder but less sensitive to amplitude change in time domain. The new measure, IQ inherits merits and overcomes the shortcomings of the two approaches. Actually the IQ can be interpreted as a unified entropy measure applicable to both time and frequency domain since it is based on time-frequency representation of wavelet transform.
In Section V, we have presented quantitative results to support the idea that hypothermia possibly diminishes the neurological damage after cardiac arrest, as evidenced by the EEG signal recovery after cardiac arrest. Assuming that the larger information content of the brain rhythm, the better neurological brain status, we measured the information in EEG data in terms of SE and IQ. Using SE and IQ, we have shown that EEG data under hypothermia contained more information than those under normothermia. Also this feature was observed more clearly from the new measure, IQ than SE.
The limitation of this work is that the hypothermia situation was set to only one temperature, 33 °C. To clearly establish the neurological dependency on temperature, we need to do more experiments under various temperatures and with more animals. It may also be worth contrasting the neurological response under hyperthermia (temperature greater than 37 °C). As well, long term recovery and survival of the animals receiving hypothermia treatment remains to be established.
In summary, we believe that the newly developed measure, the IQ, can be directly applied to quantitative EEG analysis of neurological injury and recovery. This measure is shown to be useful in titrating different grades of cardiac arrest injuries and hypothermic treatments.
Acknowledgments
This work was supported in part by the National Institutes of Health (NIH) under Grant HL71568 and Grant NS42640 and in part by Information and Telecommunication National Scholarship Program funded by the Ministry of Information and Communication (MIC), Republic of Korea.
Biography
Hyun-Chool Shin (S’00–A’04–M’04) received the B.Sc., M.Sc., and Ph.D. degrees in electronic and electrical engineering from Pohang University of Science and Technology (POSTECH), Pohang, Korea, in 1997, 1999, and 2004, respectively.
Since 2004, he has been a postdoctoral researcher at the Department of Biomedical Engineering, Johns Hopkins School of Medicine. His research interests include adaptive signal processing for multimedia communications, laser speckle imaging for brain microvessel, and bio/neurological signal processing, such as electroencephalogram, evoked potential, and neural spike analysis.

Shanbao Tong (M’04) received the B.S. degree in radio technology from Xi’an Jiaotong Univertsity, Xi’an, China, in 1995, and the M.S. degree in turbine machine engineering and Ph.D. degree in biomedical engineering from Shanghai Jiaotong University, Shanghai, China, in 1998 and 2002, respectively.
From 2000 to 2001, he was a trainee in the Biomedical Instrumentation Laboratoary, Biomedical Engineering Department, Johns Hopkins School of Medicine, Baltimore, MD. He did his postdotoral research in the Biomedical Bngineering Bepartment, Johns Hopkins School of Medicine from 2002 to 2005. Currently, he is an Associate Professor with the Biomedical Engineering Department, Shanghai Jiaotong University. His current research interests include neural signal processing, neurophysiology of brain injury, and cortical optical imaging.
Dr. Tong is an Associate Editor of the IEEE Transactions on Neural Systems and Rehablitation Engineering.

Soichiro Yamashita received the M.D. degree in clinical medicine from Tsukuba University, Ibaraki, Japan, in 2002.
He was a Postdoctoral Researcher with Department of Neurology, Johns-Hopkins Medical Institutes, since 2003. Since the end of this research, he has been Staff Anesthesiologist with the Department of Anesthesiology and Critical Care Medicine, Tsukuba University. His research interests include basic and clinical investigations in acute neurological injuries.
Xiaofeng Jia received the M.D. degree in clinical medicine from Zhejiang Medical University (the later Zhejiang University), Zhejiang, P.R. China, in 1994; the M.S. degree in surgery from Shanghai Medical University (the later Fudan University), Shanghai, P.R. China, in 1997; the Ph.D. degree in surgery (Orthopedics) from Fudan University in 2003.
He completed his surgery residency at the Huashan Hospital, Shanghai Medical University and Orthopedic Surgery fellowship at the Shanghai 6th people’s Hospital, Shanghai. And since then after being an attending surgeon in orthopedic department of the Zhongshan Hospital, Shanghai for 3 years, He has been an assistant professor and an attending surgeon in Orthopedic department of Shanghai 8th peoples’ Hospital, Shanghai. He has been a Postdoctoral Researcher at the Department of Biomedical Engineering, Medical institution, Johns Hopkins University, Baltimore, MD, since September 2004. His research interests include basic and clinical investigations in acute neurological injuries after global cerebral ischemia; novel application of neuro-electrophysiology for detection and restoration of spinal cord and peripheral nerve injury, therapeutic hypothermia of brain and spinal cord after asphyxial cardiac arrest.
Dr. Jia is a recipient of the Guanghua scholarship, Government Public scholarship, the Outstanding moral-intellectual-physical student, and the Outstanding graduate from Fudan University and National Educational Ministry Outstanding Postgraduate scholarship from Shanghai Medical University. He is a member of the Chinese Society of Microsurgery and member of Chinese Society of Orthopaedics.
Romergryko G. Geocadin received the Bachelors in Science degree from the University of the Philippines in 1987 and the UERM College of Medicine, Quezon City, Philippines, in 1981. He completed his Neurology residency at New York University Medical Center and Neurocritical care fellowship at the Johns Hopkins Hospital, Baltimore, MD.
He is the Director of the Neurosciences Critical Care Unit (NCCU) at the Johns Hopkins Bayview Medical Center and is an attending neuro-intensivist at the NCCU of The Johns Hopkins Hospital, Baltimore, MD. He is an Assistant Professor of Neurology, Neurosurgery and Anesthesiology-Critical Care Medicine of The Johns Hopkins University School of Medicine. His research interests include basic and clinical investigations in acute neurological injuries after global cerebral ischemia; novel application of neuro-electrophysiology for early detection of acute neurological injuries; disorders of intracranial pressure; coma; cerebrovascular disorders and neurologic disorders in critical illness.

Nitish V. Thakor (S’78–M’81–SM’89–F’97) received B.Tech. degree in electrical engineering from Indian Institute of Technology, Bombay, India, in 1974 and the Ph.D. degree in electrical and computer engineering from the University of Wisconsin, Madison, in 1981.
He served on the faculty of Electrical Engineering and Computer Science of the Northwestern University, Evanston, IL, between 1981 and 1983, and since then he has been with the Johns Hopkins University, School of Medicine, Baltimore, MD, where he is currently serving as a Professor of Biomedical Engineering. He teaches and conducts research on cardiovascular and neurological instrumentation, biomedical signal processing, and micro and nanotechnologies. He has authored more than 160 peer-reviewed publications on these subjects. He directs the laboratory for Neuroengineering at the Johns Hopkins University with the aim of carrying out interdisciplinary and collaborative engineering research for basic and clinical neurosciences. He also directs an NIH supported training grant in the field of neuroengineering. He is actively interested in developing international scientific programs, collaborative exchanges, tutorials, and workshops on neuroengineering and medical microsystems.
Dr. Thakor serves on the editorial boards of several journals and has been appointed as the incoming Editor in Chief of IEEE TRANSACTIONS ON NEURAL AND REHABILITATION ENGINEERING. He is a recipient of a Research Career Development Award from the National Institutes of Health and a Presidential Young Investigator Award from the National Science Foundation, and is a fellow of the American Institute of Medical and Biological Engineering and Founding Fellow of the Biomedical Engineering Society. He is also a recipient of the Centennial Medal from the University of Wisconsin School of Engineering, Honorary Membership from Alpha Eta Mu Beta Biomedical Engineering student Honor Society and Distinguished Service Award from IIT Bombay.

Contributor Information
Hyun-Chool Shin, Department of Biomedical Engineering, Johns Hopkins School of Medicine, Baltimore, MD 21205 USA.
Soichiro Yamashita, Department of Anesthesiology, Tsukuba University, Tsukuba 305-8577, Japan.
Xiaofeng Jia, Department of Biomedical Engineering, Johns Hopkins School of Medicine, Baltimore, MD 21205 USA.
Romergryko G. Geocadin, Department of Neurology, Johns Hopkins School of Medicine, Baltimore, MD 21205 USA
Nitish V. Thakor, Department of Biomedical Engineering, Johns Hopkins School of Medicine, Baltimore, MD 21205 USA.
References
- [1].Thakor NV, Tong S. Advances in quantitative electroencephalogram analysis methods. Annu. Rev. Biomed. Eng. 2004;6:453–495. doi: 10.1146/annurev.bioeng.5.040202.121601. [DOI] [PubMed] [Google Scholar]
- [2].Tong S, Bezerianos A, Malhotra A, Zhu Y, Thakor NV. Parameterized entropy analysis of EEG following hypoxic-ischemic brain injury. Phys. Lett. A. 2003;314:354–361. [Google Scholar]
- [3].Bezerianos A, Tong S, Thakor NV. Time-dependent entropy estimation of EEG rhythm changes following brain ischemia. Ann. Biomed. Eng. 2003;31:221–232. doi: 10.1114/1.1541013. [DOI] [PubMed] [Google Scholar]
- [4].Tong S, Bezerianos A, Paul J, Zhu Y, Thakor NV. Nonextensive entropy measure of EEG following brain injury from cardiac arrest. Physica A. 2002;305:619–628. [Google Scholar]
- [5].Rosso OA, Blanco S, Yordanova J, Kolev V, Figliola A, Schürmann M, Başar E. Wavelet entropy: a new tool for analysis of short duration brain electrical signals. J. Neurosci. Meth. 2001;105:65–75. doi: 10.1016/s0165-0270(00)00356-3. [DOI] [PubMed] [Google Scholar]
- [6].Hoagland H. Pacemaker of human brain waves in normal and in general paretics. Am. J. Physiol. 1936;116:R604–R615. [Google Scholar]
- [7].Fritz H, Bauer R, Walter B, Schlonski O, Hoyer D, Zwiener U, Reinhart K. Hypothermia related changes in electrocortical activity at stepwise increase of intracranial pressure in piglets. Exp. Toxicol. Pathol. 1999;51:163–171. doi: 10.1016/S0940-2993(99)80090-6. [DOI] [PubMed] [Google Scholar]
- [8].Burger R, Zuechner M, Bendszus M, Vince G, Roosen K. Moderate hypothermia improves neurobehavioral deficits after an epidural focal mass lesion in rodents. J. Neurotrauma. 2003;20:543–558. doi: 10.1089/089771503767168474. [DOI] [PubMed] [Google Scholar]
- [9].Bernard SA, Jones BM, Home MK. Clinical trial of induced hypothermia in comatose survivors of out-of-hospotal cardiac arrest. Ann. Emerg. Med. 1997;30:146–153. doi: 10.1016/s0196-0644(97)70133-1. [DOI] [PubMed] [Google Scholar]
- [10].H. a. C. A. S. Group Mild therapeutic hypothermia to improve the neurologic outcome after cardiac arrest. N. Engl. J. Med. 2002;346:549–556. doi: 10.1056/NEJMoa012689. [DOI] [PubMed] [Google Scholar]
- [11].Nolan JP, Morley PT, Vanden Hoek TL, Hickey RW. Therapeutic hypothermia after cardiac arrest. Circulation. 2003;108:118–121. doi: 10.1161/01.CIR.0000079019.02601.90. [DOI] [PubMed] [Google Scholar]
- [12].Shannon CE. A mathematical theory of communication. Bell Syst. Tech. J. 1948;27:623–656. [Google Scholar]
- [13].Yordanova J, Kolev V, Rosso OA, Schürmann M, Sakowitz OW, Özgören M, Başar E. Wavelet entropy analysis of event-related potentials indicates modality-independent theta dominance. J. Neurosci. Meth. 2002;117:99–109. doi: 10.1016/s0165-0270(02)00095-x. [DOI] [PubMed] [Google Scholar]
- [14].Mallat S. Theory for multiresolution signal decomposition: the wavelet representation. IEEE Pattern Anal. Mach. Intell. 1989 Jul;11(7):674–693. [Google Scholar]
- [15].Antonini M, Barladu M, Mathieu P, Daubechies I. Image coding using wavelet transform. IEEE Trans. Image Process. 1992 Apr.1(4):205–220. doi: 10.1109/83.136597. [DOI] [PubMed] [Google Scholar]
- [16].Katz L, Ebmeyer U, Safar P, Radovsky A. Outcome model of asphyxial cardiac arrest in rats. J. Cereb. Blood Flow Metab. 1995;15:1032–1039. doi: 10.1038/jcbfm.1995.129. [DOI] [PubMed] [Google Scholar]
- [17].Hickey RW, Ferimer H, Alexander HL, Garman RH, Callaway CW, Hicks S, Safar P, Graham SH, Kochanek PM. Delayed, spontaneous hypothermia reduces neuronal damage after asphyxial cardiac arrest in rats. Crit. Care Med. 2000;28:3511–3516. doi: 10.1097/00003246-200010000-00027. [DOI] [PubMed] [Google Scholar]
- [18].Geocadin RG, Ghodadra R, Kimura T, Lei H, Sherman DL, Hanley DF, Thakor NV. A novel quantitative EEG injury measure of global cerebral ischemia. Clin. Neurophysiol. 2000;111:1779–1787. doi: 10.1016/s1388-2457(00)00379-5. [DOI] [PubMed] [Google Scholar]


