Abstract
We model the stages of a T cell response from initial activation to T cell expansion and contraction using a system of ordinary differential equations. Results of this modeling suggest that state transitions enable the T cell population to detect change and respond effectively to changes in antigen stimulation levels, rather than simply the presence or absence of antigen. A key component of the system that gives rise to this emergent change detector is initial activation of naïve T cells. The activation step creates a barrier that separates the long-term, slow dynamics of naïve T cells from the short-term, fast dynamics of effector T cells. This separation allows the T cell population to compare current, up-to-date changes in antigen levels to long-term, steady state levels. As a result, the T cell population responds very effectively to sudden shifts in antigen levels, even if the antigen were already present prior to the change. This feature provides a mechanism for T cells to react to rapidly expanding sources of antigen stimulation, such as viruses, while maintaining tolerance to constant or slowly fluctuating sources of stimulation, such as healthy tissue during growth.
In addition to modeling T cell activation, we also formulate a model of the proliferation of effector T cells in response to the consumption of positive growth signal, secreted throughout the T cell response. We discuss how the interaction between T cells and growth signal generates an emergent threshold detector that responds preferentially to large changes in antigen stimulation while ignoring small ones. As a final step, we discuss how the de novo generation of adaptive regulatory T cells during the latter phase of the T cell response creates a negative feedback loop that controls the duration and magnitude of the T cell response. Hence, the immune network continually adjusts to a shifting baseline of (self and non-self) antigens, and responds primarily to abrupt changes in these antigens rather than merely their presence or absence.
Keywords: T cell activation, adaptive regulatory T cells, threshold detection, dynamical systems, ordinary differential equations
1 Introduction
Two seemingly disparate questions converge to form the basis of this paper: (1) can the immune system detect change, and (2) why do T cells have states? To address the first question, we develop a mathematical model of the T cell response and present the novel hypothesis that the immune system responds effectively to changes in the level of antigen stimulation, rather than simply responding to the presence or quantity of stimulation. This feature allows the system to tolerate slowly fluctuating, background levels of antigen, while still remaining able to react to shifts in antigen stimulation. Building on this hypothesis, we also propose a mechanism that enables the immune system to function as a change detector.
Interestingly, this mechanism relates to the second principal question of this paper: why do T cells begin in a naïve state and require activation before carrying out immune function? Stated negatively, why do T cells not emerge, instead, as fully functional effectors? Two explanations that may seem straightforward are as follows:
-
First line of protection against autoimmunity.
Activated cytotoxic T cells effectively eliminate pathogens. On the other hand, cytotoxic T cells may occasionally kill healthy cells. Thus, the T cell activation step creates a barrier that reduces the supply of activated T cells into the system under noninfectious conditions.
-
Conservation of resources.
Activated T cells tend to multiply more quickly, consume more resources, and turnover more frequently than their inert counterparts. Therefore, the presence of a T cell resting state reduces unnecessary resource consumption under noninfectious conditions.
In this paper, we go beyond these two immediate explanations and use our mathematical model to propose the novel connection that the presence of a latent T cell state provides a simple, robust mechanism for the T cell response to effectively detect and respond to changes in antigen stimulation levels.
Although we focus on T cells, our modeling and analysis are not restricted to the T cell response, since the motif of immune activation is prevalent in other cell populations throughout the immune system. A variety of immune cells undergo transitions from dormancy to activation when stimulated appropriately. For example, the stimulation of natural killer (NK) cells by type 1 interferon induces elevated cytotoxicity, proliferation, and cytokine secretion [3]. The stimulation of macrophages by type 2 interferon induces activation and upregulation of MHC class I and class II molecules [14, Fig. 8.32]. The stimulation of dendritic cells (DCs) by inflammatory signals induces a transition from an immature (tolerogenic) to a mature (immunogenic) state [14, p. 331]. In addition, the antigen-specific stimulation of naïve T cells induces a transition to the effector T cell state, characterized by rapid proliferation, cytokine secretion, and cytotoxicity [14, pp. 418–419].
Mathematical models of immune interactions have frequently incorporated an activation step, and the phenomenon is often viewed as a fundamental characteristic of immune cell behavior. For example, Merrill formulates a model in which natural killer cells are activated from a pre-NK to an NK state after stimulation with interferon [23]. De Boer et al. present a model in which macrophages progress to a cytotoxic state by interacting with lymphoid factors [9]. Moore and Li formulate a model in which precursor T cells are activated by interactions with cancer cells [26]. Also, Fouchet and Regoes present a model in which precursor T cells activate to effector T cells after interaction with activated antigen-presenting cells (APCs), and non-antigen-bearing APCs transition to antigen-bearing APCs after interacting with free antigen [13].
In all the examples above, immune activation is modeled precisely by the following ordinary differential equation (ODE):
| (1.1) |
where x is the population of dormant immune cells prior to activation, s is the supply rate of dormant immune cells, d is the death rate, and a(t) is the rate at which dormant immune cell become activated due to some stimulating factor. Moreover, the supply and death rates, s and d, are constant in every example above (at least in quasi-steady state for [9]).
Equation (1.1) is merely a small part of more sophisticated mathematical models that include the dynamics of activated immune cells. However, this initial transition is a common kernel among a large number of immune models considering a wide range of distinct mechanisms. From the modeling examples described above, not to mention numerous others, we see that the notion of immune activation is a recurring motif throughout the immune system and that mathematical modelers and experimentalists widely agree on the dynamics of how it works. Perhaps this is not surprising, since the idea is well-understood compared to other immune phenomena and unambiguously simple: an inactivated immune cell changes state under appropriate stimulation.
Returning to our original hypothesis of immune change detection, we ask whether we can learn anything from this simple, yet recurring motif? Our claim is that this elementary phenomenon of activation at the cellular level produces an unexpected, emergent dynamic at the population level that allows the overall immune response to operate as a highly efficient signal processor, specifically a change detector.
The paper is organized as follows. In Section 2, we analyze a simple equation for naïve T cell activation and discuss how the mechanism gives rise to an elementary change detector. In Section 3, we analyze a system of ODEs modeling the secretion and consumption of positive growth signal by effector cells. We then discuss how the system gives rise to a threshold detector that also operates as a stability on/off switch. In Section 4, we analyze a system of ODEs modeling the negative feedback regulation of the T cell response via de novo generated adaptive regulatory T cells that appear during the course of an immune response. We then discuss how the feedback loop causes the system to reliably return to a stable, low-level equilibrium after the immune response. In Section 5, we analyze a system of ODEs modeling the combined system consisting of naïve T cells, effector T cells, positive growth signal, and adaptive regulatory T cells. We discuss how the combined system discriminates between fast and slow changes in antigen stimulation level, elicits an effector response when the rate of change in stimulation exceeds a threshold, and reliably returns to the original equilibrium. In Section 7, we first discuss key assumptions that were used in formulating the model. Then, we broaden our scope to a discussion of how the T cell response can be viewed as a network of interacting signal processors, or functional components, that give rise to useful and unexpected emergent behavior. In addition, we present several possibilities for future work.
2 T cell activation: change detection
T cells, key players in the adaptive immune response, begin in a naïve state and reside primarily in lymph nodes until activated. Naïve T cells can be activated by antigen-specific stimuli, whereupon they mature into activated (effector) T cells and exhibit a significant change of behavior. Whereas naïve T cells are quiescent and long-lived (order of several years [33]), activated T cells proliferate rapidly, secrete molecular signals, and are short-lived (order of a few days [10]). Previously-activated T cells can return to a long-lived, latent state as memory T cells that may later be reactivated upon reinfection by the same antigen. Memory T cells require less stimuli for activation than naïve T cells, but possess similar characteristics of being latent and long-lived, distinguishing them from effector T cells.
Our mathematical model for naïve T cell activation follows the same form as the general equation for immune cell activation, given in (1.1). However, since the lifespan of naïve T cells is very long (half-lives of 4.2 to 6.5 years [33]) compared to the duration of an acute T cell response (a few weeks or less [10]), we make the simplifying assumption that the death rate of naïve T cells is 0. (The dynamics of the model remain essentially the same for all small death rates, and the critical assumption is that this rate is slow compared to the timescale of an acute infection.)
Figure 2.1 shows a state diagram of our model for T cell activation and corresponds to the ordinary differential equation
Figure 2.1.
State diagram for the activation of naïve T cells, N. Naïve T cells are replenished at a constant supply rate s and are stimulated in an antigen-specific manner at rate a(t).
| (2.1) |
where the variable N denotes the concentration of (antigen-specific) naïve T cells, the constant s denotes the supply rate of naïve T cells into the system, and a(t) is the rate at which naïve T cells are stimulated at time t. In the case of T cells, the stimulation rate is primarily determined by the frequency of antigen-specific interactions with mature APCs.
Although naïve T cells have a low death rate [33], Mohri et al. experimentally measure that new naïve T cells are supplied into the system at a rate of 3.3% per day for CD4+ T cells and 4.0% per day for CD8+ T cells, corresponding to a doubling period of approximately one month [25]. (In these numbers, Mohri et al. have already accounted for T cell proliferation rates, which contribute only 0.4% of turnover for CD4+ cells and 0.3% of turnover for CD8+ cells [25].) It follows that normal T cell turnover must be due to other causes than natural death. One possibility is that T cell turnover is partly maintained by low-level, persistent stimulation from low-level cross-reactivity with self antigen [31]. We can capture this phenomenon by requiring that the baseline antigen stimulation level, a(t), always remains above 0.
If we assume a(t) = a is a positive constant, then 2.1 can be solved to obtain
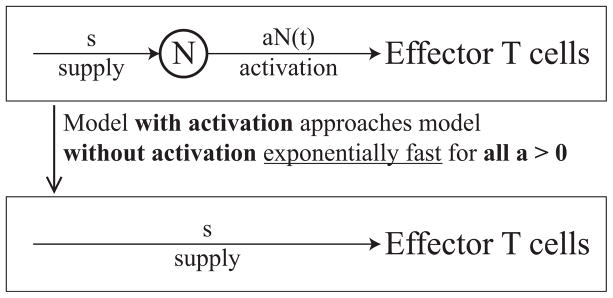
Hence, the activation rate, aN(t), approaches the supply rate, s, for any antigen-specific simulation rate a > 0. Furthermore, the naïve T cell concentration, N(t), stabilizes at s/a, and aN(t) approaches s exponentially fast. This result is intuitive once we realize that to maintain equilibrium, the supply and activation rates must balance. It follows that having a reservoir of naïve T cells does not create a long-term barrier to the steady state supply of effector cells. In fact, the steady state behavior of the model with T cell activation is the same as the behavior of the model without activation (see Figure 2.2).
Figure 2.2.
Dynamics of the model with T cell activation approaches the dynamics of the model without T cell activation exponentially fast for any constant stimulation rate a > 0. At steady state, effector cells are supplied at rate s in either case.
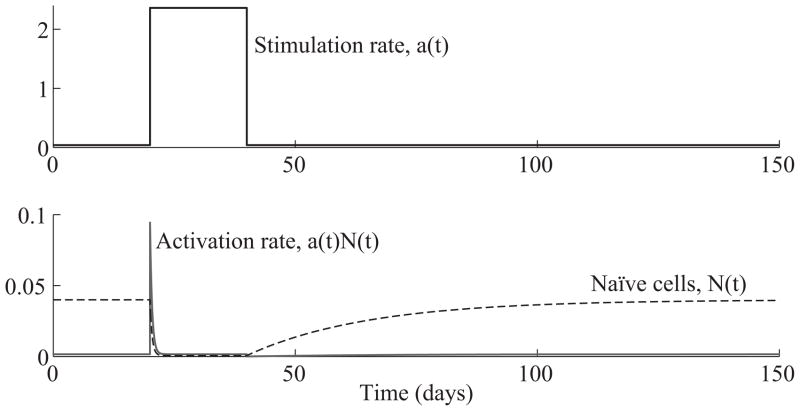
If having an activation step does not provide a long-term barrier against the production of effector cells, what is the advantage of having a reservoir of naïve T cells? We shed light on this question by examining what happens if the activation rate of naïve T cells suddenly changes. Suppose a(t) starts at a steady state value of 0.04/day, which corresponds to the 4.0% daily turnover rate of CD8+ T cells measured in [25]. Then, suppose a(t) suddenly jumps to a value of 2.36/day, which corresponds to a stimulation rate of 90% of naïve T cells per day. Such a rate is plausible during acute infection, since the experiments of Mercado at al. show that nearly all potentially-reactive T cells are stimulated within the first 24 hours of infection by L. monocytogenes [22]. Finally, suppose a(t) returns to its previous value of 0.04 after a short while. To capture this temporary jump, we let a(t) be given by the step function 0.04 + 2.32 · 1[20,40)(t).
In addition, let the initial naïve T cell concentration, N(0), equal 0.04k/μL as estimated in [16]. Let naïve T cells be supplied at a rate of 4% per day (as measured in [25]), so that s = N(0) · 4%/day = 0.0016k/μL day−1. Using these parameters, we can explicitly solve (2.1) to obtain solutions for the naïve T cell population, N(t), and the activation rate, a(t)N(t), which are shown in Figure 2.3.1
Figure 2.3.
(Top) Antigen stimulation rate, a(t) = 0.04 + 2.32 · 1[20,40)(t). (Bottom) Time evolution of the naïve T cell population, N(t), and the activation rate, a(t)N(t). The steady state value of the activation rate is the same as the supply rate s = 0.0016. When the antigen stimulation rate is constant at a, the equilibrium population of naïve T cells equals s/a. The activation rate spikes at the moment that the stimulation rate increases.
In Figure 2.3, we see that when the stimulation rate changes from 0.04 to 2.36 at day 20, the activation rate, a(t)N(t), spikes and gradually restabilizes to steady state. At the same time, the population of naïve T cells drops from s/0.04 = 0.04k/μL to s/2.36 = 0.00068k/μL, showing that nearly all naïve T cells get activated. After the stimulation rate returns to 0.04 on day 40, the naïve T cell population gradually recovers to its original equilibrium.
The spike in T cell activation occurs shortly after day 20 when the stimulation rate jumps from 0.04 to 2.36/day. Furthermore, the area below the activation spike is approximately the difference in equilibrium populations of naïve T cells before and after the change in stimulation. To be precise, if we assume the system starts at steady state with a stimulation rate of a1, which then shifts to a2 at time t0, then the area under the activation spike in the time interval [t0, t0 + τ] is
(See Figure 2.4.)
Figure 2.4.
If we assume the system starts at steady state with a stimulation rate of a1, which then shifts to a2 at time t0, then the area under the activation spike in the time interval [t0, t0 + τ] is .
From the analysis of (2.1), it appears that the presence of an activation step creates a latent reservoir of naïve T cells that rapidly transitions to effector cells in response to a sudden rise in stimulation, e.g., during an infection. Moreover, a sudden rise in antigen-specific stimulation causes the naïve T cell population to deliver an immediate pulse of effector cells at the moment the stimulation rate changes. In this way, the T cell response is tuned to respond particularly to changes in antigen levels and not only to the mere presence or absence of antigen. Responding to changes in antigen levels is, in fact, a more versatile mode of detection, since the introduction of a novel, foreign antigen into the system, would be detected as a change. Furthermore, this mode of detection provides a natural means for the T cell response to tolerate antigens that are constitutively present at high levels or nearly constant levels, such as self antigens during growth.
Because of the T cell activation step, the T cell response functions more as an antigen change detector and not as a static detector of antigen. This change detector responds drastically to shifts in stimulation, but also resets quickly to equilibrium. The capability of the system to return to a neutral mode is an essential characteristic of this change detector, since it allows the T cell response to maintain a memory of the long-term, steady state level of stimulation.
We also stress that change detection is an emergent property of the entire naïve T cell population. No individual cell or cell type possesses an intrinsic change detection mechanism. On the contrary, it is the transition of T cells from the naïve to the effector state that produces this unexpected, emergent signal processor. (See Figure 2.5.)
Figure 2.5.
The T cell activation step gives rise to an elementary change detector that translates antigen signals into activation signals. In particular, a change in the antigen stimulation level from a1 to a2 causes approximately s/a1 − s/a2 naïve T cells to suddenly activate and transition to the effector cell population.
3 Effector proliferation: the stability on/off switch
In Section 2, we hypothesized that the naïve T cell population operates as a signal processor that continually receives antigen-specific stimulation and outputs an activation signal. A natural question is how effector cells should interpret and respond to these activation signals. If there is a substantial pulse in the activation signal, the effector cells should translate the activation pulse into a full-blown immune response. On the other hand, if the pulse falls below a certain threshold, the effector cells should ignore the signal and return to a resting state. To discriminate among activation signals from the naïve T cell population, the dynamics of the effector population should give rise to a second signal processor that measures the intensity of activation pulses and responds accordingly. The system cannot simply amplify all signals uniformly.
To understand how the effector population processes signals from the naïve population, we study the interaction between effector cells and positive growth signal. We use the general term ‘positive growth signal’ to refer to the collection of signals secreted by effector T cells to promote proliferation. A significant part of this role is carried out by the cytokine interleukin-2 (IL-2), although other signals are also involved. Following activation, T cell proliferation is primarily driven by signals, especially IL-2, which are produced by the activated T cells themselves [14, pp. 337–338]. As a result, we have a system in which effector T cells both secrete and consume their own growth signal.
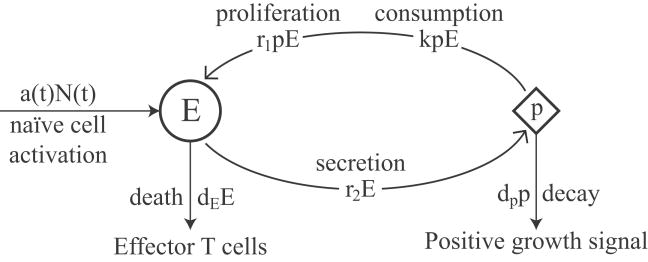
Figure 3.1 shows a state diagram of our model for effector cell proliferation. The model corresponds to the system of ODEs below:
| (3.1) |
Figure 3.1.
State diagram for the proliferation of effector T cells, corresponding to (3.1). Effector cells, E(t), enter the system at rate, a(t)N(t), die at rate dEE(t), and proliferate at rate r1p(t)E(t) in response to positive growth signal. Positive growth signal, p(t), is secreted by effector cells at rate r2E(t), is consumed at rate kp(t)E(t), and decays at rate dpp(t).
In the model, effector cells, E(t), enter the system by the activation of naïve T cells at rate aN(t) as presented in Section 2. In addition, effector cells die at rate dEE(t) and proliferate at rate r1p(t)E(t). Positive growth signal, p(t), is secreted by effector cells at rate r2E(t), is consumed at rate kp(t)E(t), and decays at rate dpp(t). The rates of interaction between effector cells and positive growth signal follow the law of mass action with coefficients r1 and k.
For convenience, we group the effector cells into one population consisting of both CD4+ and CD8+ T cells. This assumption simplifies the model and focuses on fundamental interactions that give rise to the key emergent dynamic presented in this section. However, this simplification does not consider the heterogeneous roles of CD4+ and CD8+ T cells in driving the overall T cell response. In particular, CD4+ T cells are the primary source of positive growth signal, e.g., IL-2, while CD8+ T cells are the primary consumers of positive growth signal and proliferate more extensively than CD4+ T cells [15]. Therefore, in addition to this model, we also develop a more extensive model that includes separate CD4+ and CD8+ subpopulations. The extended model is developed in Section 6, where we show that it exhibits the same change detection behavior and emergent phenomena as the simplified model in this section. At this point, we present the model in Section 6 as a basis for subsequent study. However, an adequate development and investigation of the extended model is beyond the scope of the current paper, and we leave it for a future work.
Returning to the model given by (3.1), we assume that positive growth signal, p, is at quasi-steady state with respect to the effector cell population, E, so we set
In addition, we assume the supply rate, a(t)N(t), of effector cells by naïve cell activation equals the supply rate s of naïve T cells, since this is the steady state behavior of the model under constant stimulation (see Figure 2.2). Hence, we obtain
| (3.2) |
For parameter estimates, we let s = 0.0016k/μL day−1 as estimated in Section 2. De Boer et al. estimate a CD8+ halflife of 2 days during contraction, so we let the effector cell death rate dE = log(2)/2 = 0.35/day [11]. Based on the kinetic interaction rate estimated in [16], we let the kinetic coefficient k = 20(k/μL)−1 day−1. In addition, we suppose the secretion rate r2 of positive growth signal by effector T cells is 100/day and that positive growth signal decays quickly with a halflife of 3 hours, which yields a decay rate dp of log(2)/(3 hours) = 5.5/day.
As the effector population, E, approaches infinity, the effector growth rate (r1r2E)/(dp + kE) − dE from 3.2 increases toward r1r2/k − dE. Thus, we estimate that the proliferation rate r1 of effector cells upon interacting with positive growth signal is given by
We choose this expression of r1, because it allows the maximum effector growth rate (r1r2/k)−dE to equal 4 log(2)), which corresponds to a maximum effector doubling rate of four times per day that coincides with the estimate from [14, p. 19].
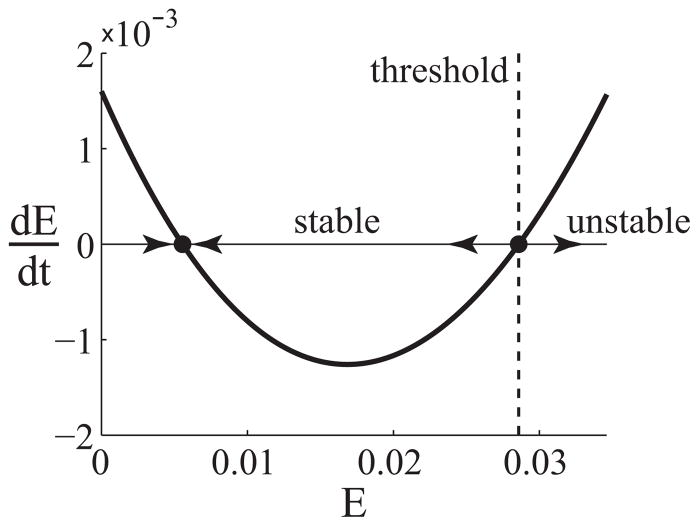
Because of the quadratic form of (3.2), the system may have up to one stable and one unstable fixed point for appropriate parameters. Figure 3.2 shows a plot of the derivative dE/dt given by (3.2) as a function of E for the parameters estimated above.
Figure 3.2.
Plot of dE/dt as a function of E, given by (3.2). For initial values x(0) below the stability threshold, x(t) will move toward the stable fixed point. For initial values x(0) above the threshold, x(t) grows exponentially. Parameters: s = 0.0016, dE = 0.35, k = 20, r1 = 0.62, r2 = 100, dp = 5.5
From Figure 3.2, we predict that the effector population tends to a stable resting state unless a strong activating signal, drives the population above a certain threshold. In this case, the population transitions immediately to instability and grows exponentially. This change in stability causes the system to function like an on/off switch that turns on when the effector population is driven above a certain threshold. This behavior is analogous to a well-studied phenomenon in bacterial dynamics known as quorum sensing and provides a means for a decentralized system to make a collective decision about whether or not to respond to a perceived threat.
In this case of the T cell response, a low population of effector cells produces insufficient positive growth signal to overcome the extracellular decay rate of the signal, causing the population to remain at a low equilibrium. On the other hand, a sufficiently large population of effector cells produces ample positive growth signal to overcome the effects of extracellular decay, causing the population to grow exponentially without bound. As a result, the process of intercellular signaling provides effector cells with a mechanism for simple communication, allowing decisions to be made on a group, rather than an individual, level.
4 Contraction: regulation via adaptive regulatory T cells
In Section 3, we hypothesized that the interaction between effector cells and positive growth signal produces a threshold detector that converts sufficiently large activation signals into unbounded exponential growth of the effector population. Since it is undesirable for the immune system to produce an uncontrolled response, a mechanism must also exist to limit the extent of T cell expansion.
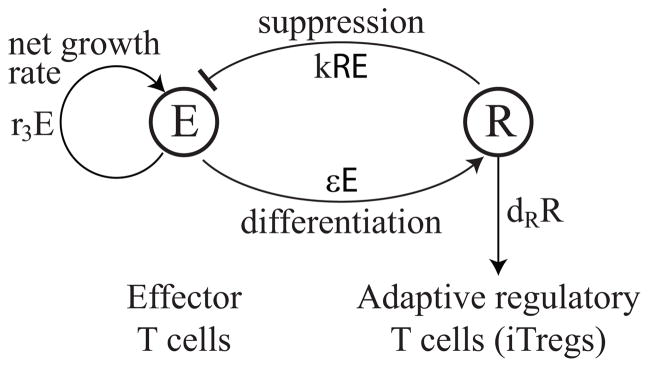
The mechanism of T cell contraction is based on the model developed in [16], which proposes that effector T cell contraction is induced by the appearance of adaptive regulatory T cells (iTregs) that differentiate from effector cells during the course of a T cell response. These iTregs suppress effector cells, creating a negative feedback loop that limits the extent of a T cell response. Figure 4.1 shows a state diagram for a basic model of iTreg-induced contraction and corresponds to the system of ODEs below:
| (4.1) |
Figure 4.1.
State diagram for the iTreg-induced contraction of effector cells, corresponding to (4.1). Effector cells, E(t), have a net growth rate of r3E and are suppressed by interactions with iTregs, R, at rate kRE. The iTregs, R, differentiate from effector cells at rate εE and die at rate dRR.
In the model, effector cells, E, grow at a net rate of r3E and are suppressed by interactions with iTregs at rate kRE. In addition, iTregs, R, differentiate from effector cells at rate εE and die at rate dRR. For simplicity, we assume effector cells and iTregs interact according to the same mass action coefficient, k, as in the proliferation model (3.1).
As discussed in Section 3, we consider a simplified model that groups T cells into one population, rather than separating CD4+ and CD8+ populations. As a result, we make the assumption that iTregs differentiate from the collective effector population. However in Section 6, we formulate an extended model that separates CD4+ and CD8+ populations. In the extended model, iTregs differentiate from CD4+ cells [4, 30, 34], and we show that the feedback loop between nonregulatory and regulatory CD4+ cells gives rise to the same change detection behavior as the simplified model considered here.
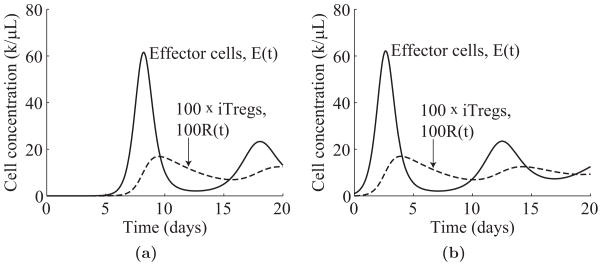
One key feature of our model of T cell regulation is that the peak height of the T cell response is insensitive to the initial concentration of effector T cells. Indeed, for initial concentrations, E(0), ranging from 0.00001 to 1k/μL, the peak height of the effector population only ranges from 61.5 to 62.1k/μL. Instead, the peak height of the effector response depends primarily on the growth rate of effectors, the differentiation rate of iTregs, and the interaction rate between iTregs and effectors.
Figure 4.2 shows simulations of (4.1) for initial effector concentrations, E(0), of 0.00001 and 1k/μL. We see that although the peak of the effector response in Figure 4.2a occurs later than the peak in Figure 4.2b, the heights of the peaks differ by less than 1%. From this example, we see that the regulation mechanism given by (4.1) controls the size of the effector response, almost independently of the initial effector cell concentration.
Figure 4.2.
Time evolution of the effector population, E(t), and iTreg population, R(t), in (4.1). Parameters: r3 = 2.08, k = 20, ε = 0.002, dR = 0.23, R(0) = 0. (a) Time evolution for E(0) = 0.00001k/μL. (b) Time evolution for E(0) = 1k/μL.
Although oscillations appear in the solutions to (4.1), they no longer appear in the combined system presented in Section 5. The oscillations appear because the linearization of (4.1) yields two complex, stable eigenvalues. On the other hand, the stability on/off switch produced by the effector population in the combined system serves as gate that shuts down the system once the effector population returns below the detection threshold after the initial peak in the T cell response.
5 The combined system of activation, proliferation, and regulation
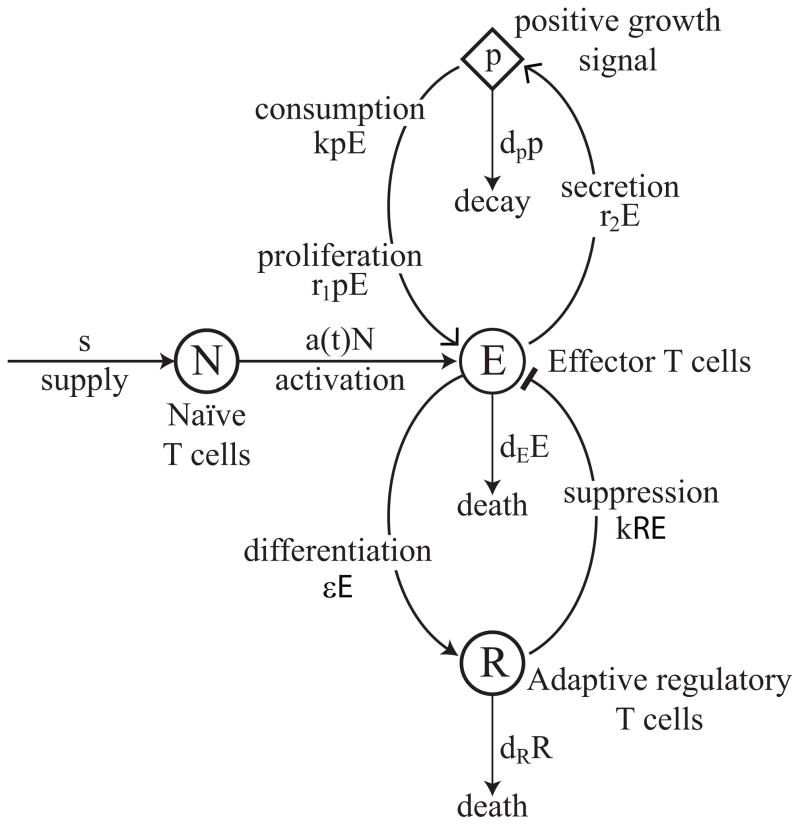
In Sections 2 to 4, we discussed how different components of the T cell response lead to different emergent dynamics. In this section, we will consider how the combined system operates. Figure 5.1 shows a state diagram for the combined model of T cell activation, proliferation, and regulation and corresponds to the system of ODEs below:
| (5.1) |
Figure 5.1.
State diagram for the combined model of T cell activation, proliferation, and regulation, corresponding to (5.1). Naïve T cells are replenished at a constant supply rate s and are activated in an antigen-specific manner to become effector cells at rate a(t)N(t). Effector cells, E(t), die at rate dEE(t), proliferate at rate r1p(t)E(t) upon interacting with positive growth signal, and are suppressed at rate kRE upon interacting with iTregs. Positive growth signal, p(t), is secreted by effector cells at rate r2E(t), is consumed at rate kp(t)E(t), and decays at rate dpp(t). The iTregs, R, differentiate from effector cells at rate εE and die at rate dRR.
In the model, naïve T cells, N(t), are replenished at a constant supply rate s and are activated to the effector state in an antigen-specific manner at rate a(t). Effector cells, E(t), die at rate dEE(t), proliferate at rate r1p(t)E(t) upon interacting with positive growth signal, and are suppressed at rate kRE upon interacting with iTregs. Positive growth signal, p(t), is secreted by effector cells at rate r2E(t), is consumed at rate kp(t)E(t), and decays at rate dpp(t). The iTreg cells, R, differentiate from effector cells at rate εE and die at rate dRR.
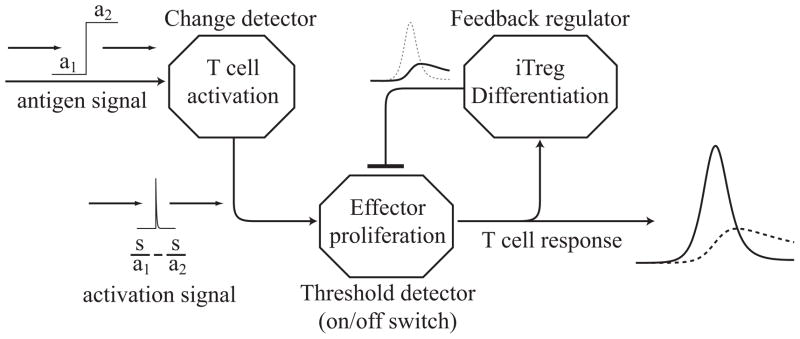
The three components of the T cell response can be viewed as a network of dynamic groups that interact to produce a collective, emergent behavior. In this light, the functional features of the T cell response are the ability to detect change, the ability to proliferate extensively in response to change, and the ability to return to a latent equilibrium. The emergent behavior does not arise from any single cell type or from intrinsic mechanisms within individual cells. Instead, it is the result of shared decision making based on the dynamics of the interacting group. Figure 5.2 depicts the T cell response from the conceptual framework of a collection of signal processors that give rise to a combined control system.
Figure 5.2.
Conceptual diagram depicting the T cell response as a collection of elementary signal processors that interact to produce an emergent group behavior. The system is characterized by three functional features: the ability to detect change, the ability to proliferate extensively in response to change, and the ability to return to a latent equilibrium.
To investigate how the combined system (5.1) responds to different stimuli, we consider the following antigen stimulation function:
| (5.2) |
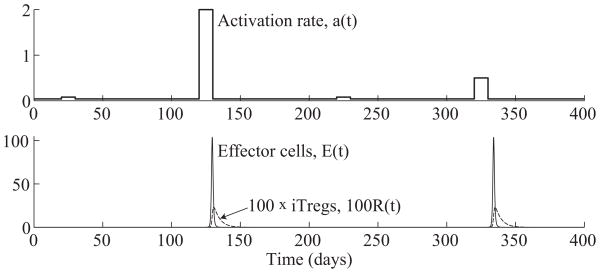
This stimulation function has a steady state value of 0.04/day, interrupted by four jumps on days 20, 120, 220, and 330 to stimulation levels of 0.08, 2.00, 0.08, and 0.50/day, respectively. Each jump lasts for ten days before returning to the baseline value. In our simulations, we use the same parameters estimated in Sections 2 to 4, which are summarized in Table 5.1. In addition, we assume the initial concentrations of each population start at their (stable) steady state values. Figure 5.3 shows a numerical simulation of (5.1) in response to the antigen stimulation function (5.2).
Table 5.1.
Parameters for the combined model given by (5.1). Concentrations are in units of k/μL, and time is measured in days. Initial concentrations of naïve T cells, effector cells, positive growth signal, and iTregs are calculated using parameters given above.
| Parameter | Description | Estimate | |
|---|---|---|---|
| s | Supply rate of naïve T cells | 0.0016k/μL day−1 | |
| a(t), a0 | Antigen stimulation rate, steady state value | a0 = 4%/day | |
| r1 | Effector cell growth rate upon interacting with positive growth signal | 0.62(k/μL)−1 day−1 | |
| r2 | Positive signal secretion rate by effector cells | 100/day | |
| k | Mass action coefficient | 20(k/μL)−1 day−1 | |
| dE | Effector cell death rate | 0.35/day | |
| dp | Positive growth signal decay rate | 5.5/day | |
| dR | iTreg death rate | 0.23/day | |
| ε | iTreg differentiation rate from effector cells | 0.002/day | |
| Initial concentrations | Values | ||
| N(0) | s/a0 | 0.04k/μL | |
| E(0) | Stable solution to | 0.0056k/μL | |
| p(0) |
|
0.010k/μL | |
| R(0) |
|
4.9 × 10⁻⁵k/μL | |
Figure 5.3.
(Top) Antigen stimulation rate, a(t), given by (5.2). (Bottom) Time evolution of effector and iTreg populations, E(t) and R(t), from system (5.1). The system produces an effector response against the second and third jumps beginning on days 120 and 320, but ignores the two smaller jumps beginning on days 20 and 220. The effector cell concentrations, E(t), peak on days 129.6 and 134.6.
In Figure 5.3, we see that the system produces an effector cell response only at the second and fourth jumps in stimulation rate. The system detects and reacts to the larger jumps while ignoring the smaller ones on days 20 and 220. Furthermore, although the second jump is four times as high as the fourth one, the size of the effector cell response is nearly the same in both cases. On the other hand, the effector response to the second jump peaks earlier at 129.6 days, 9.6 days after the start of the second jump in stimulation, while the response to the fourth jump peaks at 134.6 days, 14.6 days after the start of the fourth jump. From this example, we see that the timing the T cell response is influenced by the level of change in stimulation, whereas the size of the response remains roughly constant as long as there is enough stimulus to elicit a full effector response.
We also consider the following antigen function, characterized by gradual increases in stimulation:
| (5.3) |
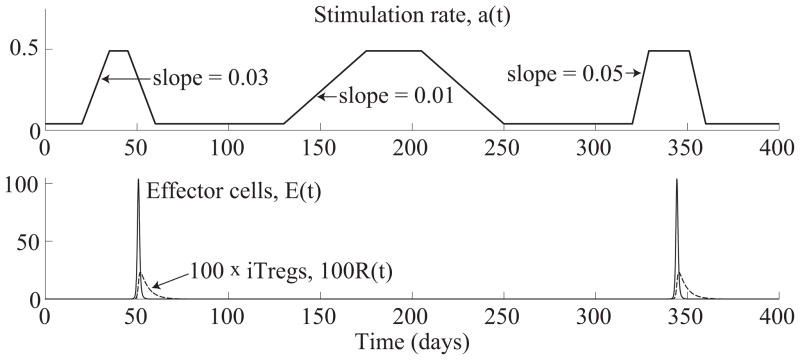
This stimulation function also has a steady state value at 0.04/day, but gradually increases three separate times to a level of 0.49/day. The first and third increases occur with slopes of 0.03 and 0.05, respectively, while the second increase occurs with a lower slope of 0.01. (See Figure 5.4(top) for a graph of a(t).
Figure 5.4.
(Top) Antigen stimulation rate, a(t), given by (5.3). (Bottom) Time evolution of effector and iTreg populations, E(t) and R(t), from system (5.1). The system produces an effector response against the first and third increases in stimulation starting on days 120 and 320. The effector cell concentrations, E(t), peak on days 50.8 and 344.3.
In Figure 5.4, we see that the system produces an effector cell response only at the first and third increases in stimulation rate, while ignoring the second one. As in the previous example, shown in Figure 5.3, the peak heights of the effector responses are nearly the same for both responses. On the other hand, the response to the third increase peaks faster on day 344.3, which is 24.3 days after the start of the increase, whereas the response to the first increase peaks more slowly on day 50.8, which is 30.8 days after the start of the increase. This example corroborates the observations in the first example, shown in Figure 5.3, that more rapidly changing stimulation rates produce earlier T cell responses, whereas T cell responses peak at roughly the same level as long as the stimulus is sufficient to turn the immune response on.
6 Extended model including separate CD4+ and CD8+ T cell populations
In this section, we present an extended model of T cell activation, proliferation, and regulation that incorporates separate CD4+ and CD8+ dynamics. The extended model is given by the following system of ODEs:
| (6.1) |
where H0(t) and K0(t) denote the concentrations of naïve CD4+ (helper) and CD8+ (killer) T cells, H(t) and K(t) denote the concentrations of effector CD4+ and CD8+ T cells, p(t) denotes the concentration of positive growth signal, and R(t) denotes the concentration of iTregs at time t.
The first two equations of (6.1) correspond to the activation of naïve CD4+ and CD8+ T cells. The T cell populations are replenished at constant supply rates of sH and sK, respectively, and are activated at a common antigen stimulation rate of a(t). The second two equations correspond to the dynamics of the effector CD4+ and CD8+ populations. The effector populations are supplied by the activation of naïve T cells at rates a(t)H0 and a(t)K0, respectively. They die at rates dHH and dKK, proliferate at rates rHpH and rKpK upon interacting with positive growth signal, and are suppressed upon interaction with iTregs at rates k1RH and k1RK, respectively. The fifth equation pertains to positive growth signal. Positive growth signal, p, is secreted by effector CD4+ T cells at rate rpH, decays at rate dpp, and is consumed by CD4+ and CD8+ effectors at rate k2(H + K)p. The final equation pertains to iTregs, which differentiate from effector CD4+ T cells at rate εH and die at rate dRR.
Where applicable, we use the same parameters used in the simplified model (5.1), which are summarized in Table 5.1. The typical proportion of of naïve CD4+ to CD8+ cells in the lymph node is 3 to 2 [5], so we estimate the initial concentration, K0(0), of naïve CD8+ cells to be 0.04k/μL according to the previous estimate in Section 2, and we set the initial concentration, H0(0) of naïve CD4+ cells to be 0.06k/μL. As before, we assume that the steady state turnover of naïve T cells is 4%/day and set the naïve cell supply rates accordingly. For simplicity, we set the initial concentrations of all other cells and signals to by 0, and let the numerical solver determine the correct quilibrium concentrations. This simplification does not pose a problem, because the first change in antigen stimulation does not occur until day 20, and the numerical solution of the system has converged to a steady state by then. All other parameter estimates are reported in Table 6.1.
Table 6.1.
Parameters for the combined model given by (6.1). Concentrations are in units of k/μL, and time is measured in days.
| Parameter | Description | Estimate |
|---|---|---|
| sH | Supply rate of naïve CD4+ T cells | 0.0024k/μL day−1 |
| sK | Supply rate of naïve CD8+ T cells | 0.0016k/μL day−1 |
| a(t), a0 | Antigen stimulation rate, steady state value | a0 = 4%/day |
| rH | effector CD4+ growth rate upon interacting with positive growth signal | 0.33(k/μL)−1 day−1 |
| rK | effector CD8+ growth rate upon interacting with positive growth signal | 0.5(k/μL)−1 day−1 |
| rp | Positive signal secretion rate by effector CD4+ cells | 100/day |
| k1 | Mass action coefficient for iTreg-suppression of effector cells | 20(k/μL)−1 day−1 |
| k2 | Mass action coefficient for consumption of growth signal by effectors | 2(k/μL)−1 day−1 |
| dH | Effector CD4+ cell death rate | 0.23/day |
| dK | Effector CD8+ cell death rate | 0.35/day |
| dR | iTreg death rate | 0.23/day |
| dp | Positive growth signal decay rate | 5.5/day |
| ε | iTreg differentiation rate from effector cells | 0.01/day |
| Initial concentrations | Values | |
| H0(0) | sH/a0 | 0.06k/μL |
| K0(0) | sK/a0 | 0.04k/μL |
| H(0) | 0 (for simplicity) | |
| K(0) | 0 (for simplicity) | |
| p(0) | 0 (for simplicity) | |
| R(0) | 0 (for simplicity) | |
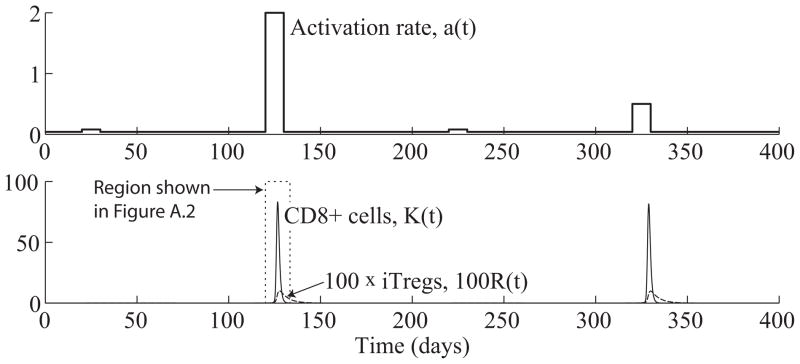
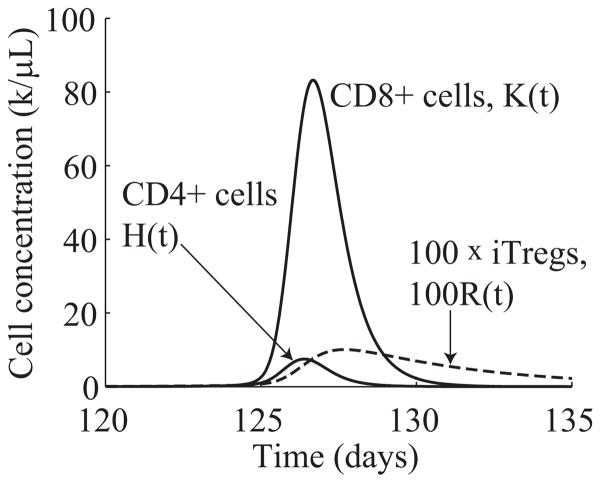
For ease of comparison, we simulate the response of the extended model (6.1) to the same stimulation function (5.2) used in Section 5. Figure 6.1 shows the results of the numerical simulation. From Figure 6.1, we see that the extended system exhibits the same type of change detection behavior of the simplified system shown in Figure 5.3. In particular, the effector CD8+ population only expands in response to the larger jumps in stimulation level starting on days 120 and 320. Furthermore, the magnitudes of the effector CD8+ responses are nearly the same in both cases, regardless of the size of the jump in stimulation. As a result of this preliminary investigation, we conclude that the extended system exhibits the same type of emergent behavior discussed in Section 5. Figure 6.2 shows a magnified portion of the graph in Figure 6.1(bottom) to better display the time evolutions of the effector CD4+, CD8+, and iTreg populations.
Figure 6.1.
(Top) Antigen stimulation rate, a(t), given by (5.2). (Bottom) Time evolution of CD8+ effector (K(t)) and iTreg (R(t)) populations from system (6.1). The system produces an effector response against the first and third increases in stimulation starting on days 120 and 320. The effector cell concentrations, K(t), peak on days 126.7 and 328.9.
Figure 6.2.
Time evolution of CD4+ effector (H(t)), CD8+ effector (K(t)), and iTreg (R(t)) populations from system (6.1).
7 Discussion
7.1 Modeling assumptions
Throughout the paper, we make several assumptions that influence the structure of our models. Some key assumptions are summarized below:
ODEs are a good representation of the dynamics in the system.
The immune dynamics considered in this paper can be captured by a deterministic model.
Interactions between agents in the system can be modeled using mass action kinetics.
The first assumption is that ODEs provide an appropriate basis for capturing the dynamics considered in the system. In reality, numerous mathematical and computational approaches are possible and have been developed to study immune dynamics. For example, apart from ODEs, there are age-structured partial differential equations [2], cellular automata [28] and agent-based modeling [18], Boolean networks [32, 35], and a relatively recent formulation known as stochastic stage-structured modeling [6, 7].
As discussed in [28], a standardized framework for modeling immune dynamics has not yet been established. However, ODE systems have emerged as a conventional modeling technique. For example, ODE models have been widely applied to a range of phenomena, including T cell dynamics (primary response kinetics and immunodominance) [10, 27, 28, 36], cancer immunology [9, 12, 17, 26], T cell and HIV interactions [1, 29], the immune response to influenza [19], and Treg dynamics [20, 21]. As a result, ODE systems serve as a reasonable starting point for immune modeling. Nonetheless, it will be fruitful to consider alternative modeling frameworks as a future direction.
The second key assumption is that the immune response considered in this paper can be accurately captured with a deterministic model. Although a large number of models have simulated the immune response as a deterministic system, a recent paper by Milutinovic and de Boer has brought this fairly standard assumption into question [24]. Comparing modeling results to experimental data, they challenge the notion that deterministic models, particularly ODEs, are appropriate for modeling the immune response. Instead, they propose that a certain level of stochasticity, called process noise, is inherent in the immune system and should be taken into account when developing mathematical models.
Based on these results, a relevant extension of our model would be to incorporate process noise into the dynamics. The addition of process noise might cause the change detection behavior of our model to produce a smoother transition between tolerance and immunity, i.e. more like a sigmoidal function rather than a binary, switch-like transition. Furthermore, as implied by [24], the addition of process noise could make the quantitative behavior of the model more accurate with regard to experimental T cell data. In the current work, we assume, however, that a deterministic formulation captures the principal dynamics of the T cell response, but as a future extension, one could consider the influence of process noise.
The third assumption is that the dynamics of cell-to-cell or cell-to-signal interactions follows the law of mass action. Mass action, a principle in chemical kinetics, has been frequently invoked in immunological modeling, e.g., see [28]. The law states that the rate of interaction between two agents in the system is proportional to the product of the concentrations of the agents. The application and analysis of the law of mass action is discussed extensively in [8], which also proves several important results such as the nonnegativity of solutions to such systems.
7.2 The immune system as a network of change detectors
One of the questions motivating this paper was ”Why do T cells have states?” In addition, we hypothesized that the immune system can detect changes in antigen levels rather than merely presence or absence of certain antigens. From our mathematical model, a novel prediction emerges that integrates this question and hypothesis: the T cell network is organized in such a way that the immune system responds not only to the presence or absence of antigens, but also to excessive perturbations in ambient antigen levels.
This change detection mechanism is, in fact, a product of the collective behavior of antigen-specific naïve T cells transitioning rapidly into the effector state when stimulated by a detectable increase in specific antigen levels. As a result, although T cell activation is a phenomenon at an individual cell level, change detection is a phenomenon at the population level. No single T cell makes the “decision” about whether a perceived change in antigen level is a threat. Instead, the decision is made as an emergent group phenomenon.
Nonetheless, the overall T cell response depends on more than T cell activation, for the activation step alone is not a sufficient mechanism to differentiate between large perturbations, which may constitute a real threat, and small perturbations, which may be caused by noise or transient fluctuations in ambient antigen levels. The effector population, which secretes and consumes positive growth signal in an autocrine and paracrine manner, gives rise to a simple and robust threshold detector that differentially converts large activation signals into fully committed T cell responses, while ignoring small signals. The detection threshold that leads to a full T cell response depends primarily on the rate of secretion of positive growth signal, the decay rate of extracellular growth signal, and the rate of effector cell division in response to growth signal.
If a stimulus elicits a full effector response, a population of adaptive regulatory T cells appears later in the T cell response to limit the extent of effector proliferation and to induce a timely contraction phase that returns the effector population to a low-level resting state that reduces the chance potential autoimmunity and re-enables the system to respond effectively to future stimulation.
The interaction among naïve, effector, regulatory T cells, and positive growth signal gives rise to a system that detects and reacts to antigen presentation levels in a dynamic instead of a static manner. This dynamic detection method provides a natural means by which the T cell response learns to tolerate constitutively presented self-antigen and some long-term chronic infections, while at the same time, reacting drastically to more virulent immune challenges, such as viral or bacterial infections and even some early-stage tumors.
A natural extension of this model is to separate the collective effector T cell population into separate effector CD4+ and CD8+ populations. We present an initial extension of this type in Section 6 and show that the change detection, threshold detection, and negative feedback mechanisms exhibit the same qualitative behavior as the simplified model considered throughout this paper. The main advantage of considering the simplified model is to focus on the three specific mechanisms (activation of naïve T cells, secretion and consumption of positive growth signal, and negative feedback via iTregs) that produce the underlying change detection behavior of the system without isolating the separate roles of CD4+ and CD8+ T cells. Nonetheless, as a future work, we intend to separate the CD4+ and CD8+ T cell populations and conduct a more comprehensive and thorough analysis of the system presented in Section 6.
As a final point, there is no intrinsic biological mechanism within individual cells that leads to change detection, rather it is a variety of phenomena operating at the population level that gives rise to the overall behavior of the system. Although we focus on the transition from naïve to effector T cells, subsequent T cell responses to the same antigen are governed by state transitions from memory to effector T cells. Since memory T cells respond to less stimuli, develop more rapidly into cytotoxic effectors, and proliferate more extensively than naïve T cells, memory activation produces another change detector that may exhibit a similar structure to the one considered in this paper, but that operates with a different, possibly more sensitive, detection threshold.
In addition, our modeling and analysis are not restricted to T cells, since a variety of immune cells exist in both latent and activated states. In particular, dendritic cells (DCs) present antigen in either tolerogenic or immunogenic manners, eliciting different types of immune responses. The transition of DCs from tolerogenic to immunogenic states is mediated by interactions with inflammatory signals released by innate immune cells during an infection. Thus, in the same fashion as for T cells, the transition of DCs from tolerogenic to immunogenic states gives rise to a signal processor that detects temporal changes in inflammation level. Since naïve T cells are activated by contact with immunogenic DCs, the interaction of T cells and DCs leads to a cascade of change detectors, one signal processor triggering another. Therefore, one future direction of this work is to study the dynamics of interacting change detectors and other emergent signal processors that build the overall structure of the immune network.
Acknowledgments
The work of PSK was supported in part by the NSF Research Training Grant and the Department of Mathematics at the University of Utah. The work of PPL was supported in part by Grant Number R01CA130817 from the National Cancer Institute. The content is solely the responsibility of the authors and is does not necessarily represent the official views of the National Cancer Institute or the National Institute of Health.
Footnotes
All plots are generated in Matlab R2008a, and all numerical simulations are obtained using the Matlab ODE solver ’ode45’.
Publisher's Disclaimer: This is a PDF file of an unedited manuscript that has been accepted for publication. As a service to our customers we are providing this early version of the manuscript. The manuscript will undergo copyediting, typesetting, and review of the resulting proof before it is published in its final citable form. Please note that during the production process errors may be discovered which could affect the content, and all legal disclaimers that apply to the journal pertain.
Contributor Information
Peter S. Kim, Email: kim@math.utah.edu.
Peter P. Lee, Email: ppl@stanford.edu.
References
- 1.Altes HK, Wodarz D, Jansen VA. The dual role of CD4 T helper cells in the infection dynamics of HIV and their importance for vaccination. J Theor Biol. 2002 Feb;214:633–646. doi: 10.1006/jtbi.2001.2483. [DOI] [PubMed] [Google Scholar]
- 2.Antia R, Bergstrom CT, Pilyugin SS, Kaech SM, Ahmed R. Models of CD8+ responses: 1. What is the antigen-independent proliferation program. J Theor Biol. 2003;221(4):585–598. doi: 10.1006/jtbi.2003.3208. [DOI] [PubMed] [Google Scholar]
- 3.Biron CA, Nguyen KB, Pien GC, Cousens LP, Salazar-Mather TP. Natural killer cells in antiviral defense: function and regulation by innate cytokines. ARI. 1999;17:189–220. doi: 10.1146/annurev.immunol.17.1.189. [DOI] [PubMed] [Google Scholar]
- 4.Cantor H, Shen FW, Boyse EA. Separation of helper T cells from suppressor T cells expressing different Ly components. II. Activation by antigen: after immunization, antigen-specific suppressor and helper activities are mediated by distinct T-cell subclasses. J Exp Med. 1976;143:1391–1340. doi: 10.1084/jem.143.6.1391. [DOI] [PMC free article] [PubMed] [Google Scholar]
- 5.Catron DM, Itano AA, Pape KA, Mueller DL, Jenkins MK. Visualizing the first 50 hr of the primary immune response to a soluble antigen. Immunity. 2004;21(3):341–347. doi: 10.1016/j.immuni.2004.08.007. [DOI] [PubMed] [Google Scholar]
- 6.Chao DL, Davenport MP, Forrest S, Perelson AS. A stochastic model of cytotoxic T cell responses. J Theor Biol. 2004 May;228:227–240. doi: 10.1016/j.jtbi.2003.12.011. [DOI] [PubMed] [Google Scholar]
- 7.Chao DL, Forrest S, Davenport MP, Perelson AS. Stochastic stage-structured modeling of the adaptive immune system. Proc IEEE Comput Soc Bioinform Conf. 2003;2:124–131. [PubMed] [Google Scholar]
- 8.Chen W, Jin W, Hardegen N, Lei KJ, Li L, Marinos N, McGrady G, Wahl SM. Modeling and analysis of mass-action kinetics. IEEE Control Systems Magazine. 2009 Aug;:60–78. [Google Scholar]
- 9.De Boer RJ, Hogeweg P, Dullens HF, De Weger RA, Den Otter W. Macrophage T lymphocyte interactions in the anti-tumor immune response: a mathematical model. JI. 1985 Apr;134:2748–2758. [PubMed] [Google Scholar]
- 10.De Boer RJ, Homann D, Perelson AS. Different dynamics of CD4+ and CD8+ T cell responses during and after acute lymphocytic choriomeningitis virus infection. J Immunol. 2003;171(8):3928–3935. doi: 10.4049/jimmunol.171.8.3928. [DOI] [PubMed] [Google Scholar]
- 11.De Boer RJ, Oprea M, Antia R, Murali-Krishna K, Ahmed R, Perelson AS. Recruitment times, proliferation, and apoptosis rates during the CD8(+) T-cell response to lymphocytic choriomeningitis virus. J Virol. 2001 Nov;75:10663–10669. doi: 10.1128/JVI.75.22.10663-10669.2001. [DOI] [PMC free article] [PubMed] [Google Scholar]
- 12.de Pillis LG, Radunskaya AE, Wiseman CL. A validated mathematical model of cell-mediated immune response to tumor growth. Cancer Res. 2005;65(17):7950–7958. doi: 10.1158/0008-5472.CAN-05-0564. [DOI] [PubMed] [Google Scholar]
- 13.Fouchet D, Regoes R. A population dynamics analysis of the interaction between adaptive regulatory T cells and antigen presenting cells. PLoS ONE. 2008;3(5):e2306. doi: 10.1371/journal.pone.0002306. [DOI] [PMC free article] [PubMed] [Google Scholar]
- 14.Janeway CA, Jr, Travers P, Walport M, Shlomchik MJ. Immunobiology: the immune system in health and disease. 6. Garland Science Publishing; New York, NY: 2005. [Google Scholar]
- 15.Kasaian MT, Leite-Morris KA, Biron CA. The role of CD4+ cells in sustaining lymphocyte proliferation during lymphocytic choriomeningitis virus infection. J Immunol. 1991;146(6):1955–1963. [PubMed] [Google Scholar]
- 16.Kim PS, Lee PP, Levy D. Emergent group dynamics governed by regulatory cells produce a robust primary T cell response. Bull Math Biol. 2010 Apr;72:611–644. doi: 10.1007/s11538-009-9463-1. [DOI] [PMC free article] [PubMed] [Google Scholar]
- 17.Kirschner D, Panetta JC. Modeling immunotherapy of the tumor-immune interaction. J Math Biol. 1998 Sep;37:235–252. doi: 10.1007/s002850050127. [DOI] [PubMed] [Google Scholar]
- 18.Kirschner DE, Chang ST, Riggs TW, Perry N, Linderman JJ. Toward a multiscale model of antigen presentation in immunity. Immunol Rev. 2007 Apr;216:93–118. doi: 10.1111/j.1600-065X.2007.00490.x. [DOI] [PubMed] [Google Scholar]
- 19.Lee HY, Topham DJ, Park SY, Hollenbaugh J, Treanor J, Mosmann TR, Jin X, Ward BM, Miao H, Holden-Wiltse J, Perelson AS, Zand M, Wu H. Simulation and prediction of the adaptive immune response to influenza A virus infection. J Virol. 2009;83(14):7151–7165. doi: 10.1128/JVI.00098-09. [DOI] [PMC free article] [PubMed] [Google Scholar]
- 20.León K, Lage A, Carneiro J. How regulatory CD25+CD4+ T cells impinge on tumor immunobiology: the differential response of tumors to therapies. J Immunol. 2007;179(9):5659–5668. doi: 10.4049/jimmunol.179.9.5659. [DOI] [PubMed] [Google Scholar]
- 21.León K, Peréz R, Lage A, Carneiro J. Modelling T-cell-mediated suppression dependent on interactions in multicellular conjugates. J Theor Biol. 2000;207(2):231–254. doi: 10.1006/jtbi.2000.2169. [DOI] [PubMed] [Google Scholar]
- 22.Mercado R, Vijh S, Allen SE, Kerksiek K, Pilip IM, Pamer EG. Early programming of T cell populations responding to bacterial infection. J Immunol. 2000;165(12):6833–6839. doi: 10.4049/jimmunol.165.12.6833. [DOI] [PubMed] [Google Scholar]
- 23.Merrill SJ. A model of the role of natural killer cells in immune surveillance - I. J Math Biol. 1981;12:363–373. doi: 10.1007/BF00276923. [DOI] [PubMed] [Google Scholar]
- 24.Milutinovic D, De Boer RJ. Process noise: an explanation for the fluctuations in the immune response during acute viral infection. Biophys J. 2007 May;92:3358–3367. doi: 10.1529/biophysj.106.094508. [DOI] [PMC free article] [PubMed] [Google Scholar]
- 25.Mohri H, Perelson AS, Tung K, Ribeiro RM, Ramratnam B, Markowitz M, Kost R, Hurley A, Weinberger L, Cesar D, Hellerstein MK, Ho DD. Increased turnover of T lymphocytes in HIV-1 infection and its reduction by antiretroviral therapy. J Exp Med. 2001;194(9):1277–1287. doi: 10.1084/jem.194.9.1277. [DOI] [PMC free article] [PubMed] [Google Scholar]
- 26.Moore Helen, Li Natasha K. A mathematical model for chronic myelogenous leukemia (CML) and T cell interaction. J Theor Biol. 2004;225(4):513–523. doi: 10.1016/j.jtbi.2003.11.024. [DOI] [PubMed] [Google Scholar]
- 27.Nowak MA. Immune responses against multiple epitopes: a theory for immunodominance and antigenic variation. Seminars in Virology. 1996;7:83–92. [Google Scholar]
- 28.Perelson AS, Weisbuch G. Immunology for physicists. Rev Mod Phys. 1997;69(4):1219–1267. [Google Scholar]
- 29.Rong L, Perelson AS. Modeling latently infected cell activation: viral and latent reservoir persistence, and viral blips in HIV-infected patients on potent therapy. PLoS Comput Biol. 2009 Oct;5:e1000533. doi: 10.1371/journal.pcbi.1000533. [DOI] [PMC free article] [PubMed] [Google Scholar]
- 30.Sakaguchi S, Yamaguchi T, Nomura T, Ono M. Regulatory t cells and immune tolerance. Cell. 2008;133(5):775–787. doi: 10.1016/j.cell.2008.05.009. [DOI] [PubMed] [Google Scholar]
- 31.Stephens LA, Gray D, Anderton SM. CD4+CD25+ regulatory T cells limit the risk of autoimmune disease arising from T cell receptor crossreactivity. Proc Natl Acad Sci USA. 2005 Nov;102:17418–17423. doi: 10.1073/pnas.0507454102. [DOI] [PMC free article] [PubMed] [Google Scholar]
- 32.Thakar J, Albert R. Boolean models of within-host immune interactions. Curr Opin Microbiol. 2010 Jun;13:377–381. doi: 10.1016/j.mib.2010.04.003. [DOI] [PubMed] [Google Scholar]
- 33.Vrisekoop N, den Braber I, de Boer AB, Ruiter AF, Ackermans MT, van der Crabben SN, Schrijver EH, Spierenburg G, Sauerwein HP, Hazenberg MD, de Boer RJ, Miedema F, Borghans JA, Tesselaar K. Sparse production but preferential incorporation of recently produced naive T cells in the human peripheral pool. Proc Natl Acad Sci USA. 2008 Apr;105:6115–6120. doi: 10.1073/pnas.0709713105. [DOI] [PMC free article] [PubMed] [Google Scholar]
- 34.Walker MR, Carson BD, Nepom GT, Ziegler SF, Buckner JH. De novo generation of antigen-specific CD4+CD25+ regulatory T cells from human CD4+CD25− cells. Proc Natl Acad Sci USA. 2005;102(11):4103–4108. doi: 10.1073/pnas.0407691102. [DOI] [PMC free article] [PubMed] [Google Scholar]
- 35.Weisbuch G, Atlan H. Control of the immune response. Journal of Physics A Mathematical General. 1988 February;21:L189–L192. [Google Scholar]
- 36.Wodarz D, Thomsen AR. Effect of the CTL proliferation program on virus dynamics. Int Immunol. 2005;17(9):1269–1276. doi: 10.1093/intimm/dxh303. [DOI] [PubMed] [Google Scholar]


