

Abstract
Whereas serious health consequences of widespread consumption of groundwater elevated in As have been documented in several South Asian countries, the mechanisms responsible for As mobilization in reducing aquifers remain poorly understood. We document here a previously unrecognized and consistent relationship between dissolved As concentrations in reducing groundwater and the phosphate-mobilizable As content of aquifer sediment for a set of precisely depth-matched samples from across Bangladesh. The relationship holds across nearly 3 orders of magnitude in As concentrations and suggests that regional as well as local patterns of dissolved As in shallow groundwater are set by the solid phase according to a remarkably constant ratio of ∼250 μg/L dissolved As per 1 mg/kg P-mobilizable As. We use this relationship in a simple model of groundwater recharge to propose that the distribution of groundwater As in shallow aquifers of the Bengal Basin could primarily reflect the different flushing histories of sand formations deposited in the region over the past several thousand years.
Short abstract
Evidence of adsorptive equilibration of As between groundwater and aquifer particles constrains the time scale over which Bangladesh aquifers no longer present a health risk.
Introduction
Despite more than a decade of research since it became apparent that groundwater pumped from millions of tubewells tapping Holocene aquifers of the Bengal Basin contain carcinogenic levels of dissolved As, a broad consensus on the underlying mechanisms has yet to emerge. The hypothesis that As mobilization is linked to microbially mediated reduction of Fe oxyhydroxides (1−6) currently enjoys considerable support, but a number of critical issues have yet to be addressed. First, the basic question of the origin of the organic matter that drives Bengal Basin aquifers toward reducing conditions conducive to As mobilization remains unresolved. Proposed sources have included plant material deposited along with aquifer sands, dissolved organic matter released by peat deposits, or younger dissolved organic matter drawn from the surface by irrigation pumping (2,4,7,8). A second open question is the extent to which As contained in shallow deposits, possibly in the form of sulfides, could have been recently mobilized and contributed to the broad-scale maximum in groundwater As concentrations centered at depths of 20−30 m in several regions of Bangladesh (9).
The present study focuses on the fate of As in shallow (<30 m) aquifers of Holocene age that are tapped by approximately half the existing ∼10 million tubewells in Bangladesh (2). This is an appropriate depth interval for exploring the mechanisms of As mobilization because the As content of groundwater from these wells spans the 1−1000 μg/L range, i.e. from one-tenth to 100-fold the World Health Organization (WHO) guideline for As in drinking water of 10 μg/L. It is also an important interval from a practical perspective because millions of households have switched their water consumption to the subset of wells identified as low in arsenic during a massive field campaign conducted over several years under the auspices of the Bangladesh Arsenic Mitigation and Water Supply Program (10). A large fraction of these low-arsenic wells are shallow and the likelihood that they will remain safe in the face of human perturbation of the hydrological cycle in Bangladesh, primarily through irrigation pumping, needs to be determined. A distinguishing feature of the present study is the use of a simple device, the needle-sampler, that simultaneously collects groundwater and aquifer sediment from precisely the same depth horizon (11). The device was deployed across three regions of Bangladesh to determine if a consistent relationship between As concentrations in the dissolved and particulate phase could be identified from well-matched samples, following previous unsuccessful attempts to do so by the usual practice of separately collecting groundwater by pumping wells and collecting aquifer sediment by drilling.
Methods
Site Selection
A landmark survey of ∼3500 tubewells distributed across the country (2) shows that shallow sandy aquifers, defined here somewhat arbitrarily as aquifers <30 m deep, are not accessible everywhere in Bangladesh (Figure 1). The two main regions where shallow tubewells predominate are the northwestern alluvial plains of the Jamuna River (named the Brahmaputra in India) and the Tista River, as well as the southern delta-plain and coastal aquifers at the confluence of the Padma (Ganges), Jamuna, and Meghna rivers. Most shallow wells in northwestern Bangladesh contain <5 μg/L As, with the exception of a band of tubewells along the course of the Jamuna containing 50 μg/L or more As (Figure 1). In contrast, groundwater As concentrations in shallow tubewells are nearly uniformly high in southern Bangladesh, with the exception of a strip of recently reclaimed land close to the coast. In this report, we present two new profiles of groundwater and sediment properties from each of these two regions (Birganj and Lakshmipur, respectively) and compare these results with existing data from Araihazar, within the floodplain of the Old Brahmaputra River 30 km east of Dhaka, where much of our previous arsenic-related work has been concentrated (12). Within each of the three areas, we selected a pair of profiles that span the entire range of conditions that were encountered.
Figure 1.

Map of dissolved As in shallow groundwater of Bangladesh based on a survey of 1500 tubewells <30 m deep out of a total of 3500 sampled across the country (2). The location of tubewells >30 m deep is indicated by white circles. Labeled triangles indicate the location of 6 needle-sample profiles collected in Birganj (NS19 and 20), Araihazar (NS6 and 7), and Lakshmipur (NS21 and NS23). Only in Birganj can the locations of the two profiles be distinguished at this scale.
The three sampled regions, Birganj, Araihazar, and Lakshmipur, reflect a typical downstream sequence of fluvio-deltaic settings beginning with an alluvial fan, transitioning into a lowland floodplain, and eventually a tidally influenced estuarine delta-plain. These geomorphically distinct environments give rise to a systematic change in surface elevation and topographic relief, which decreases from 45±7 to 7±4 and 3±2 m among the three sites, respectively (13). Despite differences in surface morphology, the stratigraphy of shallow aquifers in the three sampled regions is comparable. At each site, extensive sand deposits comprising the shallow aquifer were formed by braided river channels at Birganj and Araihazar and by high-energy fluvio-tidal channels at Lakshmipur (14). As these channels subsequently were abandoned, muddy overbank sediment capped the sandy deposits in all three areas with a relatively impermeable layer 1−10 m thick. Radiocarbon dating in Araihazar (15) and Lakshmipur (2) and optically stimulated luminescence dating in Birganj (unpublished data, A. Singhvi) indicate that shallow aquifer sediments are a few thousand years old at all three sites.
In Birganj, profile NS19 was collected near one of the very few wells in the region sampled by BGS/DPHE (2) that contained As concentrations slightly over 50 μg/L (Figure 1). NS20 was obtained in an area 15 km to the west of NS19 where not only As but also dissolved Fe concentrations in shallow wells were systematically very low (<0.1 mg Fe/L). In Lakshmipur, profiles NS21 and NS23 are only a few hundred meters apart and are located in the core of the region where As concentrations in shallow wells are particularly high (Figure 1). The two sites in Araihazar, NS6 and NS7, encompass the wide spectrum of conditions previously documented in this area (12), and nearly span the range of physical characteristics observed between Birganj and Lakshmipur. Profile NS6 is located in a village where nearly all wells are very low in As, and NS7 in a village where shallow groundwater concentrations are particularly high (12). To document the geological context of the different sites, and specifically the grain size of the sandy aquifers, wash borings were collected while drilling at all 6 sites. These samples represent the high-end of the grain-size distribution of the underlying aquifers because the material is recovered by settling.
Sampling and Analyses
Groundwater obtained with the needle sampler was filtered under nitrogen immediately after collection (11). Acidified samples of filtered groundwater from the 6 needle-sampler profiles were analyzed for As, Fe, Mn, S, Na, Mg, Ca, and K by high-resolution inductively coupled plasma-mass spectrometry (HR ICP-MS; (16)). On the day of collection, sediment recovered from each deployment of the needle sampler was subjected to two different extractions : (1) a hot 10% HCl leach for 30 min (17) and (2) an extraction at room temperature in a N2-purged 1 M NaH2PO4 solution (pH∼5) for 24 h (18,19). The acid leachate was analyzed immediately for dissolved Fe(II) and Fe(III) by colorimetry. The phosphate extract from all 6 profiles was analyzed for As by HR ICP-MS. The grain-size distribution of the wash borings was measured in triplicate using a Malvern Mastersizer 2000 laser-diffraction particle-size analyzer.
Results
Dissolved As and Fe
The depth profiles of As in groundwater obtained with the needle sampler are consistent with the general characteristics of the three study areas (Figure 1). In Birganj, As concentrations in groundwater averaged 6±7 μg/L (n = 14, see Supporting Information). The highest dissolved As concentration of 27 μg/L was measured in groundwater from profile NS19 collected beneath an 18-m-thick layer of fine silt and clay (Figure 2a). At NS20, dissolved As concentrations did not exceed 4 μg/L even though dissolved Fe concentrations as high as 10 mg/L were measured in some of the same intervals.
Figure 2.

Vertical profiles of 3 groundwater and 2 aquifer-solid properties in (a) Birganj, (b) Araihazar, and (c) Lakshmipur obtained with the needle sampler. Median grain-size data were obtained from wash borings collected during drilling (the larger connected symbols indicate samples with a median grain size >50 μm collected within 1 m depth of a groundwater sample collected with the needle sampler). Beyond the ranges selected for presenting the profiles are data for the 33-m interval at NS19, major cation concentrations of 55 and 47 meq/L for the 6-m interval at NS7 and the 22.5-m interval at NS21, respectively, and a P-mobilizable As concentrations of 7.1 mg/kg for the 4.5-m interval at NS21 (see Supporting Information).
At the other end of the spectrum, dissolved As concentrations collected with the needle sampler in Lakshmipur averaged 500 ± 260 μg/L (n = 14). Groundwater As concentrations were >400 μg/L in all but 3 samples, which still contained ∼100 μg/L (Figure 2c). The groundwater profile at NS21 indicates a rapid increase in As concentrations to a maximum of 920 μg/L at 6 m depth. At NS23, the rise in groundwater As concentrations is more gradual and reaches 750 μg/L at 17 m depth.
In the intermediate area of Araihazar, As concentrations were <10 μg/L for all but one sample at NS6 (Figure 2b). Profiles of dissolved As and Fe concentrations at this location bear a strong resemblance to those of NS19 in Birganj. At NS7, instead, As concentrations exceeded 200 μg/L in all but 1 out of 8 samples. In this second location within Araihazar, As and Fe profiles more closely resemble the situation documented at NS23 in Lakshmipur.
Redox Conditions
Dissolved Mn concentrations >0.1 mg/L (Supporting Information) measured in all but the three shallowest groundwater samples from NS6 indicate that anoxia prevails in shallow aquifers of all three regions. Reducing conditions are also suggested by dissolved S concentrations in groundwater of all three areas that are well below that in rivers of the region (2), with the exception of a few outliers in Araihazar (Supporting Information). Reducing conditions are confirmed by acid-leachable Fe(II)/Fe ratios >0.3 in the solid phase at all sampled intervals, with the exception of the three shallowest intervals at NS6 (Figure 2b). There is no systematic regional trend between average leachable Fe(II)/Fe ratios of 0.68±0.1 (n = 17) in Birganj, 0.56±0.2 (n = 17) in Araihazar, and 0.79±0.1 (n = 14) in Lakshmipur that is related to the regional pattern of groundwater As in the same shallow aquifers.
Sediment Properties
In contrast to redox conditions, which do not vary regionally, there are clear trends in the grain size as well as the As content of aquifer sediments. The grain-size data are represented by the median grain diameter (d50) defined as the size of the sieve that separates 50% of a sample (20). The median grain diameter of wash borings collected from sandy intervals decreases more than 3-fold from 520±90 μm (n = 7) in Birganj to 170±70 μm (n = 18) in Lakshmipur (Figure 2). Average concentrations of As in the solid phase extractable in a 1 M phosphate solution, taken here to represent the fraction of As that is available for mobilization, span an order of magnitude, starting from 0.1±0.1 mg/kg (n = 15) in the northwest and increasing to 1.1±0.4 (n = 14) mg/kg in the south (Figure 2). Whereas average downcore values of P-mobilizable As concentrations and median grain-size for paired profiles within Birganj and Lakshmipur are not markedly different, this is not the case for the two contrasting profiles spanning the range of conditions observed in Araihazar. In this more variable area, shallow aquifer sands are considerably coarser at NS6 than at NS7 (320±60 μm vs 180±40 μm) and the P-mobilizable As concentrations are correspondingly lower at NS6 than at NS7 (0.3±0.2 vs 0.7±0.4 mg/kg).
Discussion
Partitioning of As Phases
The observations reported here establish two new and significant relationships between dissolved As and other aquifer characteristics across a broad range of conditions. Most revealing are covarying mobilizable As concentrations in aquifer particles and dissolved As concentration in groundwater from the same horizon (Figure 3a). The depth-matched samples show a remarkably consistent trend across 3 orders of magnitude in concentrations between dissolved As in groundwater and mobilizable As in aquifer particles across the three regions, between pairs of profiles within each region, and often within a single profile (Figure 3a).
Figure 3.

Scatter plots of groundwater and aquifer-solid properties for material collected with the needle sampler in three regions of Bangladesh. Note the logarithmic scale of all properties, with the exception of leachable Fe(II)/Fe. Grey symbols identify 16 out of 45 less reducing intervals characterized by either leachable Fe(II)/Fe <0.5 or dissolved Fe <0.2 mg/L and dissolved As < 10 μg/L that were excluded from the regression.
The outliers that do not fit this relationship are all relatively shallow samples from NS6 and NS20 that contain <0.2 mg/L dissolved Fe (Figure 3b). Sediment from half of these intervals is also characterized by Fe(II)/Fe ratios <0.5, which are indicative of less reducing conditions (17). Linear regression of the log transform of dissolved As in groundwater as a function of the log transform of P-mobilizable As in aquifer particles (the log transform weighs the data more equally across the spectrum) indicates an essentially fixed ratio of ∼250 μg/L dissolved As per 1 mg/kg P-mobilizable As across 3 orders of magnitudes: log (diss As) = 1.00±0.07 log (P-extr As) + 2.42±0.06 (r2 = 0.88 for 29 paired samples). The relationship, which is equivalent to a linear adsorption isotherm, excludes 6 less reducing intervals characterized by Fe(II)/Fe ≤ 0.5 and another 7 pairs of samples with dissolved Fe <0.2 mg/L and diss As <10 μg/L (the combination of low Fe and high As concentrations do not indicate less reducing conditions). The inferred ratio is equivalent to 3% of the As in the aquifer being present in the dissolved phase, assuming a typical porosity of 0.25.
The observed relationship suggests adsorptive equilibrium of As between the dissolved and the particulate phase that is rapid relative to the time scale of groundwater flow. This is consistent with independent observations of release of As from Bangladesh aquifer material without addition of organic substrate (7,9,21,22), as well as the rate of increase of groundwater As concentrations with groundwater age in shallow aquifers determined by 3H−3He dating (23). It is noteworthy that our field data show that concentrations of As in Bangladesh groundwater cross the 10 μg/L health threshold without any clear change in Fe chemistry in the solid or dissolved phase. As noted previously (2), there is no consistent relationship between dissolved As and Fe concentrations: Fe concentrations span essentially the same 0.01−20 mg/L range for groundwater containing 10 μg/L and >100 μg/L As in the three regions (Figure 3b). The overall pattern supports the notion that reduction of Fe hydroxides is a necessary but not a sufficient condition for elevated As concentrations in groundwater in Holocene aquifers (12,17,24). The lack of a correlation between As and Fe concentrations in groundwater may indicate that both elements are initially associated in the solid phase but that a new Fe(II)-containing phase acts as a sink for Fe and not for As (7,12,22,24−26).
Effect of Grain Size
Our second significant observation is the general inverse relationship between As concentrations and the median grain size of aquifer sediments (Figure 2). This association could be interpreted as an indication that the initial As content of aquifer particles is determined by grain size and/or differences in depositional environment reflected by grain size (2,8). There are, however, no obvious mineralogical differences between the sampled regions that might account for the variability in dissolved As concentrations. The coarser wash borings collected at Birganj contain more quartz and less plagioclase (61±4 and 14±3%; n = 6) compared to Araihazar and Lakshmipur (48±3 and 23±1%; n = 12), but the chemical composition of wash borings from all sites does not differ enough to discern distinct provenances (see Supporting Information). Significantly, the mineralogy and elemental composition of wash borings from site NS6 in Araihazar, where groundwater As concentrations are low, is not systematically different from that of sites NS21, 23, and 7, where dissolved As is elevated. A potential effect of grain size on surface area and therefore As adsorption cannot be ruled out, but it is worth noting that the concentrations of P-mobilizable As vary across 3 orders of magnitude in the three study areas whereas the surface area of median-sized aquifer particles varies by only a factor of 9. The alternative explanation we wish to put forth is that grain size affects hydraulic conductivity and groundwater flow and, therefore, the rate at which mobilizable As is flushed out of an aquifer.
The difference in median grain size from Birganj to Lakshmipur alone corresponds to a 6-fold difference in hydraulic conductivity, assuming the sandy deposits are well-sorted (20). Add to this the likely effect of differing topography and local relief (45±7 m vs 3±2 m) on the hydraulic gradient at these sites (2) and it is entirely reasonable to expect that the rate of flushing of shallow aquifers differs by at least an order of magnitude between northern and southern Bangladesh. In the case of Araihazar, a wide range of recharge rates has actually been documented for villages separated by only a few kilometers on the basis of 3H−3He dating of shallow groundwater (23).
According to the observed ratio between As in the dissolved and particulate phase, and assuming rapid exchange, a simple calculation shows that reducing dissolved As by a factor of 100 requires flushing of an aquifer with ∼150 pore volumes of water that does not contain As. Assuming similar initial concentrations of As in aquifer particles and comparable aquifer ages, more flushing of shallow aquifers in northwestern Bangladesh over the past several thousand years could therefore have plausibly depleted the amount of mobilizable As much sooner than in southern Bangladesh. Within Araihazar, such differences in local hydrogeology appear to dictate the As content of aquifer particles and thefore groundwater As on even smaller spatial scales (12,23).
Difference in hydrogeological regimes of the three sampled regions and within each region are consistent with a broad relation between grain size and the concentration of dissolved major cations. The build-up of major cation concentrations in groundwater is often interpreted as an indication of the extent of weathering and therefore, to a first approximation, an indication of groundwater age relative to recharge (27). In Birganj, the sum of major cation concentrations averages 1.3±0.3 meq/L (n = 14), with no detectable difference between NS19 and NS20 (Figure 2a). In Araihazar, the concentration of major cations in groundwater is significantly lower at the site with low As concentrations (NS6: 2.4±1.5 meq/L, n = 9) than at the site elevated in dissolved As (NS7: 8.0±1.9 meq/L; n = 7), even if a potentially anomalous very high cation concentration at the shallowest sampled depth is excluded. In Lakshmipur, the combined concentration of major cations is much higher than in either of the two other regions (21±16 meq/L; n = 14), but due to the local imprint of seawater. However, the intervals with generally lower As concentrations at NS23 are nevertheless associated with relatively low major cation concentrations. Major cations concentrations in groundwater therefore provide supporting evidence for both regional and local contrasts in hydrogeology that impact the distribution of As in shallow aquifers.
Flushing Model
We use a one-dimensional advection-dispersion model to show that flushing history, combined with a linear isotherm dictating the equilibration of As between the dissolved and particulate phases, could explain regional as well as local patterns in the distribution of As in shallow aquifers. We start from the governing equation for steady state:
where C is the concentration of As in the dissolved phase, x is the distance along the flow path, v is the advection velocity, D is a hydraulic dispersion coefficient, and R is the retardation factor, which is related to the distribution coefficient Kd by the following expression:
where ρ is the aquifer bulk density, Kd is the ratio of the As concentration in the solid phase per mass of sediment divided by the As concentration in the dissolved phase, and θ is the aquifer porosity. Assuming that dissolved and solid-phase As concentrations are initially equilibrated along the entire flow path at a concentration Ci and that recharge water entering the aquifer at one end of the flow path contains no As, the solution (28) for a point at a distance x along the flow path and at time t is
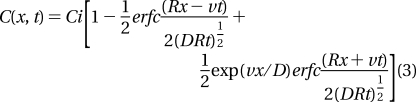 |
We consider a generic flow path leading from an area of recharge to the depth range of shallow aquifers and eventually to a discharge area, typically a local stream (2,7,23,29). The 50−500 m range is a plausible range of lengths for flow-paths through shallow (<30 m) aquifers. The central scenario assumes a groundwater flow velocity along this path of 5 cm/d (5.8 × 10⁻⁷ m/s), which corresponds to a hydraulic gradient of 0.5 × 10⁻³, a hydraulic conductivity of 3 × 10⁻⁴ m/s, and a typical porosity of 0.25 (2,23). As a sensitivity test, we also explore the effect of increasing and reducing this velocity by a factor of 10 to reflect the dependence of hydraulic conductivity on grain size and a regional decline in hydraulic gradients from north and to south (2). To estimate the dispersion coefficient D = 5.8 × 10⁻⁶ m2/s for the central scenario, the velocity is multiplied by a dispersivity of 10 m, which is representative of sandy aquifers across spatial scales of ∼100 m (30). The effect of increasing or decreasing this parameter by a factor of 10 is also explored. The retardation factor R = 36.8 is calculated from an aquifer bulk density of 2.24 g/cm3, derived in turn from a porosity of 0.25 and a particle density of 2.65 g/cm3, and a Kd of 4 cm3/g, which corresponds to a ratio of 1 mg/kg As in the solid phase to 250 ug/L As in groundwater.
A dissolved As concentration of 1000 μg/L was selected to represent the upper limit in Bangladesh groundwater today. The corresponding concentration of P-mobilizable As dictated by the model is 4 mg/kg along the entire flow path. We start by comparing the predicted distributions of As along the flow path under the central scenario after 50, 500, and 5000 years of flushing (Figure 4). The model suggests that only the shallowest layers of the aquifer in an area of recharge are significantly flushed of a portion of their As content after 50 years. After 500 and 5000 years, however, As concentrations are reduced to <10 ug/L within the first 100 and 2000 m of the flowpath, respectively. The implication is that flow-paths at the low end of the 50−500 m range corresponding to shallow aquifers could be significantly depleted of As by 500 years and almost entirely so by 5000 years.
Figure 4.

Predicted decrease in groundwater As concentrations according to the analytical solution of the advection-dispersion transport model (28). The various scenarios corresponding to a range of flushing times, advection velocities, dispersion coefficients, and retardation factors are described in the text. Note the logarithmic scale of distance along the flow path.
Additional calculations show that the distribution of As along the flow path after 500 years is only moderately sensitive to variations in the dispersion coefficient. The effect of changing the groundwater velocity is to a first approximation inversely proportional to that of changing the flushing time. For instance, the distributions of As after flushing at 5 cm/d for 500 years or 0.5 cm/d over 5000 years are comparable (Figure 4). There is a second-order effect of increasing the flushing time at a lower velocity, however, that is akin to increasing the dispersion factor by a factor of 10 and therefore a spreading of the transition from low- to high-As aquifers along the flow path (Figure 4). Conversely, increasing the velocity to 50 cm/day produces a distribution of As after only 50 years that is comparable to that after 500 years at 5 cm/d, but with a steeper transition.
The purpose of these calculations is to show that a wide range of As distributions in the shallow aquifers of Bangladesh can be reached by simply using the new constraint on partitioning between dissolved and P-mobilizable As derived from the needle-sampler data and a plausible range of hydrogeological conditions. If a velocity of 50 cm/d is representative of northwestern Bangladesh, the model suggests that As concentrations in shallow aquifers of that region may have dropped to systematically low levels only a few centuries after their deposition. The same model suggests that, in contrast, flushing As out of the shallow aquifers of Laksmipur at 0.5 cm/d may require another several thousand years (Figure 4). The model can also explain how tubewells within adjacent villages where the rate of local recharge is known to differ by an order of magnitude can result in very different As concentrations in shallow aquifers (12,23).
The notion that flushing by recharge could over time deplete an aquifer of its mobilizable As content is not new (2,4,6,15,31). Our main contribution here is to quantify a surprisingly consistent relationship between dissolved and particulate As levels over a wide range of conditions that allows us to translate this hypothesis into a prediction of changes in groundwater As over time. We do not claim to understand the precise nature of partitioning of As between the dissolved and particle phases. We do believe, however, that small-scale spatial variability in a complex fluvio-deltaic setting, combined with the traditionally separate sampling of sediment and groundwater, may be one reason why such a relationship has not been recognized previously. At this point, we cannot rule out that aquifer particles may initially contain different levels of As when deposited in different environments (8). However, we do show that such a mechanism is not needed to explain regional as well as local patterns in the distribution of As in shallow groundwater. It is sufficient to consider plausible groundwater flow velocities as well as the geological history and physical character of shallow aquifers at the local to (102 m) and regional (104 m) scales (4,6). Finally, the notion that codeposition of As and organic matter, acting as a reductant, plays a dominant role in controlling the distribution of As (8) does not seem to apply to shallow aquifers of Bangladesh, where comparable redox conditions are observed in the northwestern and southern portions of the country but the distribution of As is very different.
Implications
Besides providing an alternative explanation for regional and local patterns in the distribution of As in shallow aquifers, our observations have two practical implications. The first is that even if groundwater withdrawals were to result in an enhanced supply of organic matter to shallow aquifers (7,31), the biogeochemical impact on As mobilization could be offset by increased flushing resulting in lower As concentrations in aquifer particles and therefore in groundwater (23). Second, our observations suggest that groundwater As concentrations in reducing aquifers can be predicted within an order of magnitude from the P-mobilizable As content of aquifer sands. Under the reasonable assumption that the composition of wash borings is related to that of aquifer sands at the bottom of a drill hole, analysis of wash borings for mobilizable As with a field kit while drilling might help drillers more successfully install wells that provide groundwater that is low in As.
Acknowledgments
Expansion of arsenic studies beyond our initial study area of Araihazar, Bangladesh, was supported by NSF grant EAR 0345688. Overall support for our work in Bangladesh was provided by NIEHS Superfund Basic Research Program grant NIH 1 P42 ES10349. The manuscript benefited from discussions with Kathleen Radloff and Jacob Mey. We thank Dr. Ashok Singhvi from the Physical Research Laboratory in Ahmedabad, India, for sharing unpublished OSL data. We are also grateful to our team of drillers led by Abu Taleb and Shaidullah for their tireless work within Araihazar and beyond.
Supporting Information Available
Groundwater and solid phase data for slurries collected with the needle sampler, as well as grain-size and XRF and XRD data for wash borings. This information is available free of charge via the Internet at http://pubs.acs.org
Funding Statement
National Institutes of Health, United States
Supplementary Material
References
- Nickson R. T.; McArthur J. M.; Burgess W. G.; Ahmed K. M.; Ravenscroft P.; Rahman M. Arsenic poisoning of Bangladesh groundwater. Nature 1998, 395, 338. [DOI] [PubMed] [Google Scholar]
- BGS and DPHE.Arsenic contamination of groundwater in Bangladesh, Final Report. British Geological Survey Report WC/00/19; Kinniburgh D. G., Smedley P. L., Eds.; British Geological Survey: Keyworth, 2001. [Google Scholar]
- Akai J. K.; Izumi H.; Fukuhara H.; Masuda S.; Nakano T.; Yoshimura H.; Ohfuji H.; Anawar M.; Akai K. Mineralogic and geomicrobiologic investigations on groundwater arsenic enrichment in Bangladesh. Appl. Geochem. 2004, 19, 215–230. [Google Scholar]
- McArthur J. M.; Banerjee D. M.; Hudson-Edwards K. A.; Mishra R.; Purohit R.; Ravenscroft P.; Cronin A.; Howarth R. J.; Chatterjee A.; Talukder T.; Lowry D.; Houghton S.; Chahda D. K. Natural organic matter in sedimentary basins and its relation arsenic in anoxic ground water: the example of West Bengal and its worldwide implications. Appl. Geochem. 2004, 19, 1255–1293. [Google Scholar]
- Islam F. S.; Gault A. G.; Boothman C.; Polya D. A.; Charnock J. M.; Chatterjee D.; Lloyd J. R. Role of metal-reducing bacteria in arsenic release from Bengal delta sediments. Nature 2004, 430, 68–71. [DOI] [PubMed] [Google Scholar]
- Ravenscroft P.; Burgess W. G.; Ahmed K. M.; Burren M.; Perrin J. Arsenic in groundwater of the Bengal Basin, Bangladesh: Distribution, field relations, and hydrogeological setting. Hydrogeol. J. 2005, 13, 727–751. [Google Scholar]
- Harvey C. F.; Swartz C. H.; Baruzzaman A. B. M.; Keon-Blute N.; Yu W.; Ali M. A.; Jay J.; Beckie R.; Niedan V.; Brabander D.; Oates P. M.; Ashfaque K. N.; Islam S.; Hemond H. F.; Ahmed M. F. Arsenic mobility and groundwater extraction in Bangladesh. Science 2002, 298, 1602–1606. [DOI] [PubMed] [Google Scholar]
- Meharg A. A.; Crimgeour C. S.; Hossain S. A.; Fuller K.; Cruickshank K.; Williams P. N.; Kinniburgh D. G. Codeposition of organic carbon and arsenic in Bengal Delta aquifers. Environ. Sci. Technol. 2006, 40, 4928–4935. [DOI] [PubMed] [Google Scholar]
- Polizzotto M. L.; Harvey C. F.; Sutton S. R.; Fendorf S. Processes conducive to the release and transport of arsenic into aquifers of Bangladesh. Proc. Natl. Acad. Sci., U.S.A. 2005, 102, 18819–18823. [DOI] [PMC free article] [PubMed] [Google Scholar]
- Ahmed M. F.; Ahuja S.; Alauddin M.; Hug S. J.; Lloyd J. R.; Pfaff A.; Pichler T.; Saltikov C.; Stute M.; van Geen A. Ensuring safe drinking water in Bangladesh. Science 2006, 314, 1687–1688. [DOI] [PubMed] [Google Scholar]
- van Geen A.; Protus T.; Cheng Z.; Horneman A.; Seddique A. A.; Hoque M. A.; Ahmed K. M. Testing groundwater for arsenic in Bangladesh before installing a well. Environ. Sci. Technol. 2005, 38, 6783–6789. [DOI] [PubMed] [Google Scholar]
- van Geen A.; Zheng Y.; Cheng Z.; Aziz Z.; Horneman A.; Dhar R. K.; Mailloux B.; Stute M.; Weinman B.; Goodbred S.; Seddique A. A.; Hoque M. A.; Ahmed K. M. A transect of groundwater and sediment properties in Araihazar, Bangladesh: Further evidence of decoupling between As and Fe mobilization. Chem. Geol. 2006, 228, 85–96. [Google Scholar]
- SWMC. Digital Elevation Model of Bangladesh; Surface Water Modelling Centre: Dhaka, Bangladesh, 2001.
- Allison M. A.; Khan S. R.; Goodbred S. L.; Kuehl S. A. Stratigraphic evolution of the late Holocene Ganges-Brahmaputra lower delta plain. Sediment. Geol. 2003, 155, 317–342. [Google Scholar]
- Zheng Y.; van Geen A.; Stute M.; Dhar R.; Mo Z.; Cheng Z.; Horneman A.; Gavrieli I.; Simpson H. J.; Versteeg R.; Steckler M.; Grazioli-Venier A.; Goodbred S.; Shahnewaz M.; Shamsudduha M.; Hoque M.; Ahmed K. M. Geochemical and hydrogeological contrasts between shallow and deeper aquifers in two villages of Araihazar, Bangladesh: Implications for deeper aquifers as drinking water sources. Geochim. Cosmochim. Acta 2005, 69, 5203–5218. [Google Scholar]
- Cheng Z.; Zheng Y.; Mortlock R.; van Geen A. Rapid multi-element analysis of groundwater by high-resolution inductively coupled plasma mass spectrometry. Anal. Bioanal. Chem. 2004, 379, 513–518. [DOI] [PubMed] [Google Scholar]
- Horneman A.; van Geen A.; Kent D.; Mathe P. E.; Zheng Y.; Dhar R. K.; O’Connell S.; Hoque M.; Aziz Z.; Shamsudduha M.; Seddique A.; Ahmed K. M. Decoupling of As and Fe release to Bangladesh groundwater under reducing conditions. Part I: Evidence from sediment profiles. Geochim. Cosmochim. Acta 2004, 68, 3459–3473. [Google Scholar]
- Keon N. E.; Swartz C. H.; Brabander D. J.; Harvey C.; Hemond H. F. Validation of an arsenic sequential extraction method for evaluating mobility in sediments. Environ. Sci. Technol. 2001, 35, 2778–2784. [DOI] [PubMed] [Google Scholar]
- Jung H. B.; Zheng Y. Enhanced recovery of arsenite sorbed onto synthetic oxides by l-ascorbic acid addition to phosphate solution: calibrating a sequential leaching method for the speciation analysis of arsenic in natural samples. Water Res. 2006, 40, 2168–2180. [DOI] [PubMed] [Google Scholar]
- Masch F. D.; Denny J. Grain-size distribution and its effect on the permeability of unconsolidated sands. Water Resour. Res. 1966, 2, 665–677. [Google Scholar]
- van Geen A.; Thoral S.; Rose J.; Garnier J. M.; Zheng Y.; Bottero J. Y. Decoupling of As and Fe release to Bangladesh groundwater under reducing conditions. Part II: Evidence from sediment incubations. Geochim. Cosmochim. Acta 2004, 68, 3475–3486. [Google Scholar]
- Radloff K. A.; Cheng Z.; Rahman M. W.; Ahmed K. M.; Mailloux B. J.; Juhl A. R.; Schlosser P.; van Geen A. Mobilization of arsenic during one-year incubations of grey aquifer sands from Araihazar, Bangladesh. Environ. Sci. Technol. 2007, 41, 3639–3645. [DOI] [PMC free article] [PubMed] [Google Scholar]
- Stute M.; Zheng Y.; Schlosser P.; Horneman A.; Dhar R. K.; Hoque M. A.; Seddique A. A.; Shamsudduha M.; Ahmed K. M.; van Geen A. Hydrological control of As concentrations in Bangladesh groundwater. Water Resour. Res. 2007, 43, W09417, doi:10.1029/2005WR004499. [Google Scholar]
- Zheng Y.; Stute M.; van Geen A.; Gavrieli I.; Dhar R.; Simpson H. J.; Schlosser P.; Ahmed K. M. Redox control of arsenic mobilization in Bangladesh groundwater. Appl. Geochem. 2004, 19, 201–214. [Google Scholar]
- Swartz C. H.; Blute N. K.; Badruzzman B.; Ali A.; Brabander D.; Jay J.; Besancon J.; Islam S.; Hemond H. F.; Harvey C. F. Mobility of arsenic in a Bangladesh aquifer: Inferences from geochemical profiles, leaching data, and mineralogical characterization. Geochim. Cosmochim. Acta 2004, 68, 4539–4557. [Google Scholar]
- Coker V. S.; Gault A. G.; Pearce C. I.; van der Laan G.; Telling N. D.; Charnock J. M.; Polya D. A.; Lloyd J. R. XAS and XMCD evidence for species-dependent partitioning of arsenic during microbial reduction of ferrihydrite to magnetite. Environ. Sci. Technol. 2006, 40, 7745–7750. [DOI] [PubMed] [Google Scholar]
- Freeze R. A.; Cherry J. A.. Groundwater; Prentice Hall: Englewood Cliffs, NJ, 1979. [Google Scholar]
- van Genuchten M. Th.; Alves W. J.. Analytical solutions of the one-dimensional convective-dispersive solute transport equation; USDA ARS Technical Bulletin 1661;U.S. Salinity Laboratory: Riverside, CA, 1982; http://ars.usda.gov/sp2UserFiles/Place/53102000/pdf_pubs/P0753.pdf.
- Harvey C. F.; Ashfaque K. N.; Yu W.; Badruzzaman A. B. M.; Ali M. A.; Oates P. M.; Michael H. A.; Neumann R. B.; Beckie R.; Islam S.; Ahmed M. F. Groundwater dynamics and arsenic contamination in Bangladesh. Chem. Geol. 2006, 228, 112–136. [Google Scholar]
- Gelhar L. W.; Welty C.; Rehfeldt K. R. A critical review of data on field-scale dispersion in aquifers. Water Resour. Res. 1992, 28, 1955–1974. [Google Scholar]
- Klump S.; Kipfer R.; Cirpka O. A.; Harvey C. F.; Brennwald M. S.; Ashfaque K. N.; Badruzzaman A. B. M.; Hug S. J.; Imboden D. M. Groundwater dynamics and arsenic mobilization in Bangladesh assessed using noble gases and tritium. Environ. Sci. Technol. 2006, 40, 243–250. [DOI] [PubMed] [Google Scholar]
Associated Data
This section collects any data citations, data availability statements, or supplementary materials included in this article.