Abstract
A three-dimensional model of the human cerebrospinal fluid (CSF) spaces is presented. Patient-specific brain geometries were reconstructed from magnetic resonance images. The model was validated by comparing the predicted flow rates with Cine phase-contrast MRI measurements. The model predicts the complex CSF flow patterns and pressures in the ventricular system and subarachnoid space of a normal subject. The predicted maximum rostral to caudal CSF flow in the pontine cistern precedes the maximum rostral to caudal flow in the ventricles by about 10% of the cardiac cycle. This prediction is in excellent agreement with the subject-specific flow data. The computational results quantify normal intracranial dynamics and provide a basis for analyzing diseased intracranial dynamics.
Keywords: Intracranial dynamics, cerebrospinal fluid, computational fluid dynamics, three-dimensional modeling, fluid-structure interaction
1. Introduction
CSF, a clear plasma-like fluid surrounding the cerebrum and spinal cord, is produced mainly by the choroid plexus and flows through the ventricles to the subarachnoid space where it is absorbed into the blood stream via the sagittal sinus [1]. Disturbances in the natural CSF flow patterns are often associated with diseases like hydrocephalus, syringomyelia, or Chiari malformation [2–3]. The modeling approach presented here provides a basis for creating a quantitative understanding of changes in flow patterns associated with the diseased brain. By incorporating subject-specific geometric data into our model, the CSF flow and pressure gradients in the brain can be quantified. Through rigorous modeling, we intend to reproduce the dynamic mechanical behavior of an individual human brain, and by doing so, we aim to explain quantitative relationships between cerebral blood flow, CSF pressures, and flow rates.
Previously, we have devoted much effort to reconstructing the CSF flow in two-dimensions [4–5]. However, a two-dimensional approach has the disadvantage that it does not render the volume relationships accurately. For instance, when considering only a two-dimensional cross-section along the longitudinal fissure of the brain, one either misses the cerebral ventricles completely or does not correctly render the space between the two hemispheres. Moreover, the spatial relationship between the pontine cistern and the ventricular space can not be properly rendered in a two-dimensional model. The correct relationship between all fluid spaces in the cranium can only be studied properly when using a three-dimensional model.
Several three-dimensional models of cerebrospinal fluid flow have been reported in the literature. Jacobson et al. have studied the flow and pressure dynamics of the cerebral aqueduct [6–7]. More advanced aqueductal models accounted for the aqueduct’s deformability [8]. Three-dimensional CSF flow studies inside the third ventricle have also been reported [9–10]. Gupta et al. investigated the CSF flow in the lower region of the subarachnoid space, caudal to the lateral and third ventricles [11]. More recently, Linge et al. proposed a three-dimensional CSF flow model of the lower subarachnoid space and cervical region of the spinal canal [12]. However, none of the prior models described the CSF flow in the entire ventricular system and the subarachnoidal spaces.
The models described above were developed to increase knowledge about normal and diseased CSF dynamics. We agree with those researchers who point out that computational modeling of the CSF spaces is needed for improving shunt design for hydrocephalic patients and for improving methods of intraventricular and intrathecal drug delivery [9,11]. To this end, this article presents a three-dimensional flow model of the human cranial fluid space. As an advancement of the prior models mentioned above, the current model includes the entire cranial subarachnoid space as well as the entire ventricular system. The model is used to predict the CSF flow field and intracranial pressures resulting from brain tissue displacement.
The next section describes our methodology and presents the governing equations and boundary conditions used in our simulations. The Results section presents model predictions of CSF flow rates and intracranial pressures for a subject with average-sized ventricles and a patient with enlarged cerebral ventricles. This report closes with a discussion of our findings as well as a critical assessment of the current model.
2. Methods
2.1. CSF and blood flow measurements
Cine phase-contrast magnetic resonance imaging (CINE-MRI) was used to measure cranial CSF velocities in a normal subject and a patient diagnosed with communicating hydrocephalus. Additional measurements included change in lateral ventricle size, CSF flow rate in the third ventricle and at the junction of the aqueduct and fourth ventricle, and the blood flow rate in the basilar artery. The participants signed consent forms approved by the Institutional Review Board. Detailed flow results and data acquisition methods were described previously [4–5,13].
2.2. Image reconstruction and model development
T2-weighted MR images of the cranium were manually segmented using image reconstruction software, Mimics 12.11 (Materialise, Belgium). The manual segmentation process resulted in patient-specific, three-dimensional triangulated surface meshes of a normal subject and a patient with communicating hydrocephalus. The crude image displayed in the left panel of Fig. 1 displays the actual reconstruction of the ventricular and cranial subarachnoid spaces obtained from the T2 images for the normal subject. Because of the finite resolution of the MRI data, the crude reconstruction has rough surfaces with many discontinuous faces. The coarse surface may cause artificial flow effects along uneven interfaces. In an effort to overcome this deficiency, the rough surfaces were removed using Laplacian smoothing [14]. During the smoothing process, the quantity of triangular faces defining the surface mesh was reduced and the surface quality improved by normalizing the triangles’ height to base ratio. These filtering techniques were provided by Mimics to obtain the improved surface reconstruction shown on the right in Fig. 1. After improving the reconstructed brain and ventricular surfaces, the surface meshes were imported into ADINA-FSI 8.6. In ADINA-FSI the meshes were discretized using Delaunay triangulation for the inner domain and the advancing front algorithm for the domain boundary. The normal brain shown in Fig. 2 required 765,062 tetrahedral fluid elements and 486,542 tetrahedral solid elements. The three-dimensional model and a summary of boundary conditions are shown in Fig. 2. Material parameters and a list of boundary conditions are given in Table 1 and in the Appendix.
Fig. 1.
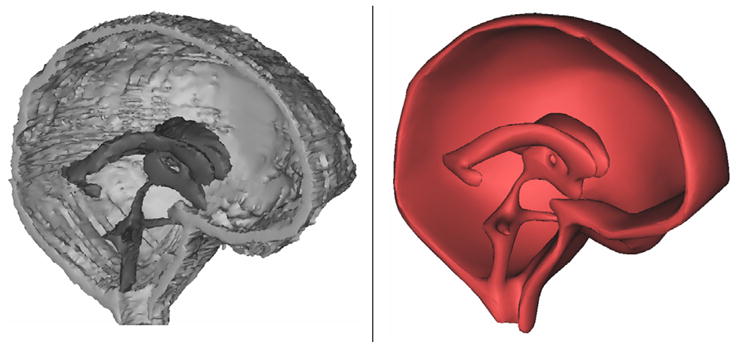
Manual segmentation of the CSF-filled spaces of the cranium resulted in the initially crude surface shown on the left. Advanced filtering techniques such as surface smoothing and triangle reduction resulted in the improved, more realistic surface displayed on the right.
Fig. 2.
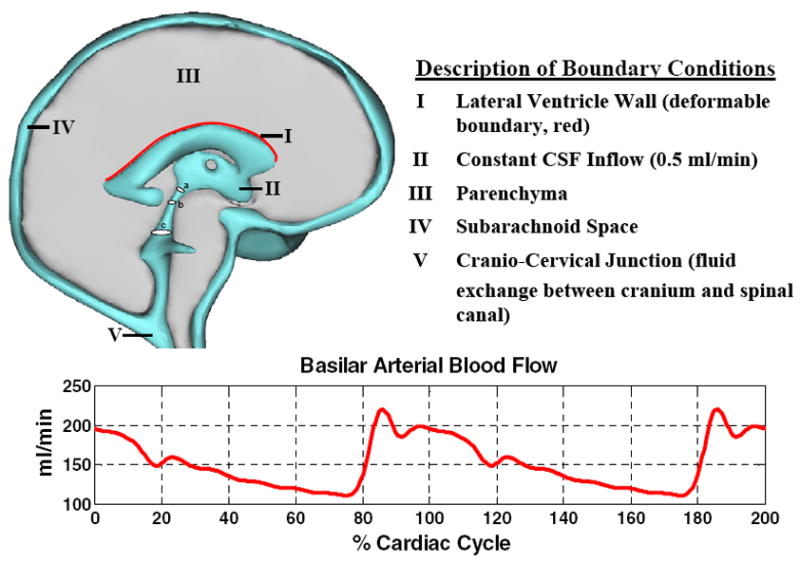
Three-dimensional model of the human cranium. Deformation occurs along the upper surface of the lateral ventricle wall, highlighted in red. The blood flow waveform in the basilar artery, bottom graph, was used as a boundary condition for pulsatile CSF flow; described in Methods section. Circular cross sections a, b, and c in the ventricular system indicate locations where the Womersley numbers were calculated.
Table 1.
List of boundary conditions and material parameters.
| Location | Boundary Condition | Material parameters |
|---|---|---|
| Lateral & 3rd Ventricle | CSF inflow, 0.5 ml/min | - |
| Upper subarachnoid space | Pressure, 500 Pa | - |
| Arachnoid layer | no slip, u=v=w=0 | - |
| CSF pathways | divergence free | density, 998.2 kg/m3; viscosity, 0.001003 kgm−1s−1 |
| Brain tissue | fluid structure interaction along lateral ventricle wall and near pontine cistern | Young’s modulus, 10 kPa; Shear modulus, 3.4 kPa; Poisson ratio, 0.45 |
2.3. Fluid-solid boundary conditions
The mathematical models adopt physiologically relevant boundary conditions accounting for CSF production and pulsatility. The total CSF production, Sf, is a fluid generation term matching experimental data for average CSF production in adult humans, approximately 0.5 ml/min [15]. CSF is treated as a Newtonian fluid with viscosity and density similar to water. Assuming fluid incompressibility, continuity for CSF flow in the ventricles is written,
| (1) |
Outside the ventricles no CSF is produced; accordingly the continuity equation reduces to ∇ · u⃗ = 0. CSF motion inside the fluid-filled spaces is governed by the Navier-Stokes equations given in eq. (2), written in vector form.
| (2) |
In eqs. (1) and (2), ρf is CSF density; u⃗ is CSF velocity; ∇→p is the pressure gradient; μ is fluid viscosity.
Pulsating cerebral blood flow drives pulsatile CSF flow within the central nervous system (CNS). The process is driven by blood supply to the brain causing compliant arteries and arterioles to expand. Vascular expansion causes brain tissue stresses and displacements. In our model, tissue displacement compresses the lateral ventricles, forcing CSF into the subarachnoid space. Because the cranial volume remains constant, the total vascular expansion is matched by the sum of the CSF stroke volume expelled into the distensible spinal canal and the blood which leaves the cranium through the venous sinuses [16]. As the cerebral vasculature returns to its diastolic resting lumen, CSF expelled during cardiac systole flows back from the spinal canal to the cranial subarachnoid space.
To account for the blood-CSF interaction in our model, volumetric expansion terms embedded in the parenchyma mimic arterial expansion and contraction. These volumetric expansions, SV, are transmitted to the CSF-filled spaces. The magnitude and timing of the source terms, SV, follow the measured cerebral blood flow wave pattern shown in Fig. 2. The signal was discretized with a Fourier series, eq. (3), where , ck = (ak ± ibk)/2. The sign of the complex part, ibk , is taken as plus when k is positive, and negative when k is negative. The value index zero, c0, and coefficients ak, bk are listed in Table 2.
Table 2.
Mean value, c0 and coefficients ak, bk , k = 1,2,...,8 of the Fourier series in eq. (3) which captures the cerebral vascular pulsations.
| Coefficient | Value [ml/min] |
|---|---|
| c0 | 169.7760 |
| a1 | 27.9791 |
| a2 | 12.3427 |
| a3 | 14.9403 |
| a4 | −5.3310 |
| a5 | −5.4838 |
| a6 | −1.6638 |
| a7 | 2.2920 |
| a8 | 4.5670 |
| b1 | 9.5584 |
| b2 | −6.9098 |
| b3 | −6.8080 |
| b4 | −0.6282 |
| b5 | 3.7181 |
| b6 | 4.2953 |
| b7 | 1.6978 |
| b8 | −0.1358 |
| (3) |
As indicated in Table 2 and by eq. (3), seventeen terms were used to reconstruct the blood flow waveform measured at the basilar artery. We found that seventeen terms are a sufficient number of coefficients to reproduce the waveform accurately. The use of additional Fourier coefficients did not further improve the quality of the reconstructed waveform.
Tissue displacement and ventricular wall movement is governed by eq. (4), where ρs is the density of the solid phase, d⃗ is the displacement vector of the solid cell matrix, G is the shear modulus, ν is the Poisson ratio, and εv is the volumetric strain.
| (4) |
Fluid-structure interaction constraints are applied along the upper wall of the lateral ventricle. These constraints ensure equal displacement of solid and fluid elements along the ventricular surface as well as equal but opposite forces normal to the fluid-solid interface. At non-deformable interfaces, no-slip boundary conditions apply for the fluid.
2.4. Fluid pressure boundary conditions
Normal intracranial pressure (ICP) is about 500 Pa (4 mmHg above venous pressure). Accordingly, we set a baseline ICP of 500 Pa. For the pathological case, we set the baseline ICP at 2700 Pa [5]. These baseline pressures were applied at the sagittal sinus. The sagittal sinus represents as a porous structure surrounding the cranial subarachnoid space through which CSF reabsorption occurs.
2.5. Grid independence studies
To ensure accurate solutions of the fluid flow simulations, mesh independence studies were conducted. The velocity magnitude in three locations was compared across three computational grids: a coarse mesh with 543,903 elements, a medium mesh with 765,062 elements, and a fine mesh containing 1,599,412 elements. As shown in Fig. 3, the percent error between the medium and fine meshes is less than 0.6% for the three areas of interest.
Fig. 3.
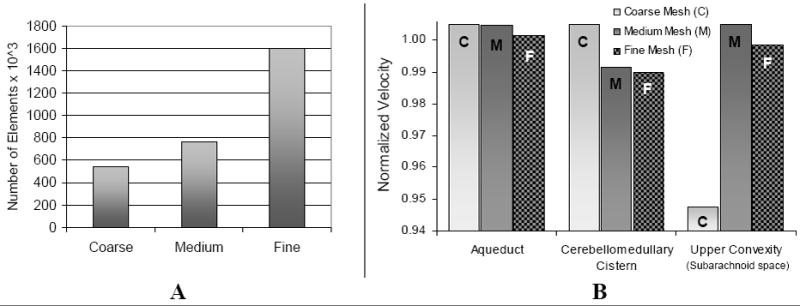
Frame A: the three grid sizes used in the mesh independence study. Frame B: comparison of the predicted maximum velocity magnitude in the aqueduct, cerebellomedullary cistern, and upper convexity of the subarachnoid space for the three grids. Percent error between the medium grid and fine grid is less than 0.6% for the three locations. Velocity values were obtained at mid-systole and normalized with respect to the maximum velocity at each location.
This small change justifies the choice of the medium size grid for subsequent simulations. A fully implicit Euler scheme, using ADINA, with a step-size of 0.01 seconds was adequate to capture the CSF dynamics sufficiently; computer experiments with smaller step sizes showed no differences in the simulation results.
3. Results
3.1. Geometrical properties of normal and diseased brains
Table 3 summarizes the geometrical dimensions of the normal and hydrocephalic brains obtained from the image reconstruction technique. Although the main brain dimensions were similar for the normal and hydrocephalic case, the lateral ventricle volume was almost 18 times larger in the hydrocephalic case. This difference in ventricular size corresponds to a much smaller parenchyma volume in the hydrocephalic case compared to normal: 1120 ml hydrocephalic, 1388 ml normal. Because this patient was diagnosed with communicating hydrocephalus, we conjecture that the decrease in brain tissue volume was due to tissue compression coupled with decreased brain water content. This process occurring in hydrocephalus is different from ventricular enlargement due to brain atrophy [17]. The brain model cortical surface area is also given in Table 3. The values of the computational meshes are smaller than those typically reported for the brain cortical surface area, which can range from 1,500cm2 to 2,500cm2 [18–21]. The significance of this discrepancy will be addressed in the Discussion section.
Table 3.
Geometric details of three-dimensional reconstructed normal and diseased brains.
| Normal | Hydrocephalic | ||
|---|---|---|---|
| Dimension [mm] | Crnm | 163.1 AP | 170.6 AP |
| 157.0 SI | 168.2 SI | ||
| 150.3 RL | 160.0 RL | ||
| LV | 73.3 APa | 103.4 APa | |
| 59.9 RLb | 48.6 RLb | ||
| Volume [mL] | BT | 1388.0 | 1120.3 |
| SAS | 101.1 | 104.0 | |
| LV | 16.5 | 290.1 | |
| 3V | 4.5 | 9.9 | |
| 4V | 7.2 | 6.2 | |
| Surface area [cm2] | CS | 783.8 | 851.9 |
| VS | 108.7 | 317.4 | |
| Womersley number | A-V3 | 5.0 | 10.7 |
| AS | 4.2 | 9.2 | |
| A-4V | 8.0 | 35.2 | |
APa measured from the left posterior horn to the left anterior horn; RLb measured from left posterior horn to right posterior horn; Crnm, cranium; AP, anterior to posterior length; SI, superior to inferior length; RL, length from right to left; LV, lateral ventricle; BT, brain tissue; SAS, subarachnoid space; 3V, third ventricle; 4V, fourth ventricle; CS, cortical surface; VS, ventricular surface; A-V3, junction of aqueduct and third ventricle; AS, aqueduct of Sylvius; A-4V, junction of aqueduct and fourth ventricle
3.2. Model predictions of CSF flow and pressures
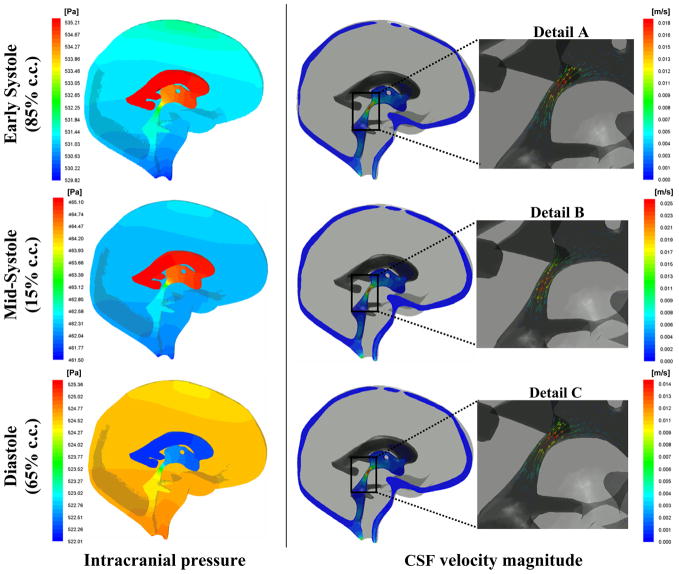
Fig. 4 compares the predicted CSF flow rate with CINE-MRI measurements obtained from a mid-coronal cross section in the third ventricle. The model predictions are in close agreement with the in vivo flow measurements. Computing the positive area under the curve in Fig. 4 yielded a CSF stroke volume of 0.028 ml. Fig. 5 shows early systolic, mid-systolic, and diastolic pressure and velocity profiles. The model predicts that velocity magnitude is largest in the aqueduct of Sylvius and at mid-systole reaches a maximum of 25 mm/s. The pressure contours indicate a reversal in the pressure gradient during the course of the cardiac cycle. This pressure sign change corresponds to a reversal of CSF flow, from caudal to rostral, seen in Details A–C.
Fig. 4.
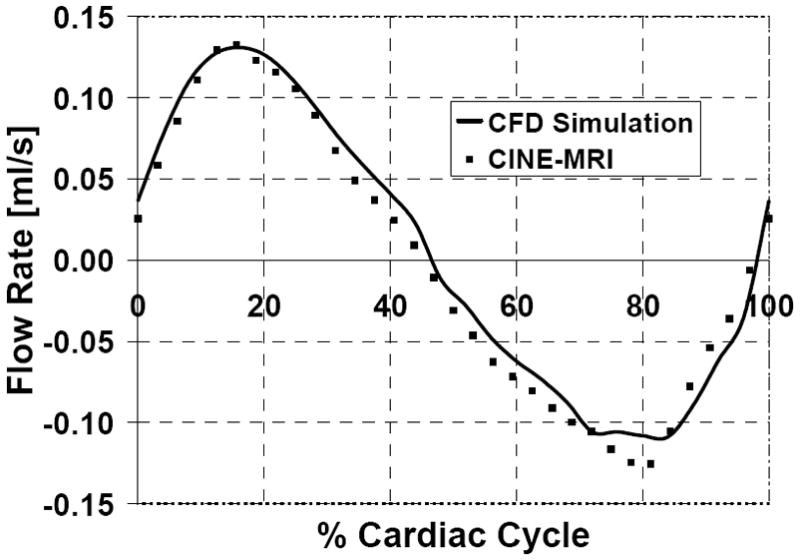
Simulated and measured CSF flow rates in the third ventricle of a normal subject. The model predictions (solid line) agree closely with the patient-specific data (squares).
Fig. 5.
Predicted CSF pressure and velocity magnitude in the ventricles and subarachnoid space. Left panel shows the pressure contours at 15%, 65%, and 85% of the cardiac cycle. Pressure is highest in the ventricles at early systole with flow in the rostral direction shown in Detail A. Flow rate reaches a maximum in mid-systole with flow out of the ventricles shown in Detail B. During diastole, the pressure gradient reverses, being higher in the subarachnoid space compared to the ventricles. Accordingly, CSF flows back to the ventricles as shown in Detail C.
Velocity magnitude in the pontine cistern and in three points in the ventricular system is plotted over one cardiac cycle in Fig. 6. Peak caudal CSF velocity magnitude slightly exceeds peak rostral CSF velocity magnitude. This difference reflects the small net flow due to constant CSF production. Fig. 6 also shows that CSF flow in the pontine cistern becomes caudal before ventricular flow becomes caudal. The phase difference is about 10% of the cardiac cycle.
Fig. 6.
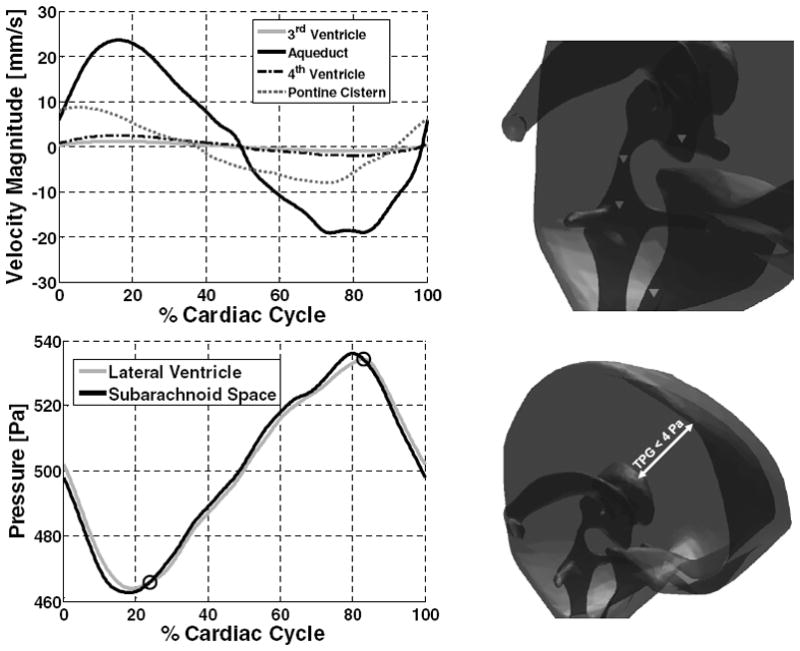
Velocity magnitude and pressure in the ventricular system and subarachnoid space. Velocity magnitude in third ventricle, cerebral aqueduct, fourth ventricle, and pontine cistern (downward pointing triangles, upper figure right) is plotted. Positive values correspond to caudal flow; negative values rostral. Bottom graph: pressure trajectories in the lateral ventricle and subarachnoid space.
Pressure levels in the lateral ventricle and the upper convexity of the subarachnoid space are shown in the lower panel of Fig. 6. The difference in pressure between the lateral ventricles and the upper convexity of the subarachnoid space is called the transmantle pressure gradient; the transmantle pressure gradient does not exceed 4 Pa at any point in the cardiac cycle. The pressure profile shows two time instances during the cardiac cycle in which the pressure gradient between the lateral ventricles and the subarachnoid space reverses. These events occur at about 23% and 82% of the cardiac cycle and are indicated by open circles in the figure. The simulations predict that when the pressure gradient reverses, that is when lateral ventricle pressure begins to exceed subarachnoid pressure, CSF flow does not immediately change from rostral to caudal. For example, at 82% of the cardiac cycle lateral ventricle pressure surpasses the subarachnoid pressure, but CSF flow does not become entirely caudal until 98% of the cardiac cycle. Thus, the change in predominant flow direction lags 58 degrees behind the transmantle pressure sign reversal.
3.3. Disease simulation
The analysis of velocity and pressure dynamics can also be performed for abnormal intracranial dynamics. The brain geometry of a 50 year old hydrocephalic patient was reconstructed. As indicated in Table 3, the ventricular space was eleven times larger than normal. Snapshots of the pressure and velocity fields at 15% of the cardiac cycle are shown in Fig. 7, Frames A and B. Peak caudal CSF velocity in the aqueduct was 41.3 mm/s in systole; peak rostral CSF velocity was 39.9 mm/s in diastole. Intracranial pressure trajectories in the lateral ventricle and the upper convexity of the subarachnoid space, Frame C, reveal that the transmantle pressure gradient in the hydrocephalic case remains small throughout the cardiac cycle, not exceeding 11 Pa in this subject. The predicted pressure amplitude in the lateral ventricles is 69 Pa. This pressure amplitude is almost twice the normal case. Frame D shows the excellent agreement between the measured and predicted CSF flow rates in the third ventricle. The CSF stroke volume in the ventricles (for this particular patient) is about eight times larger compared to the normal case we studied.
Fig. 7.
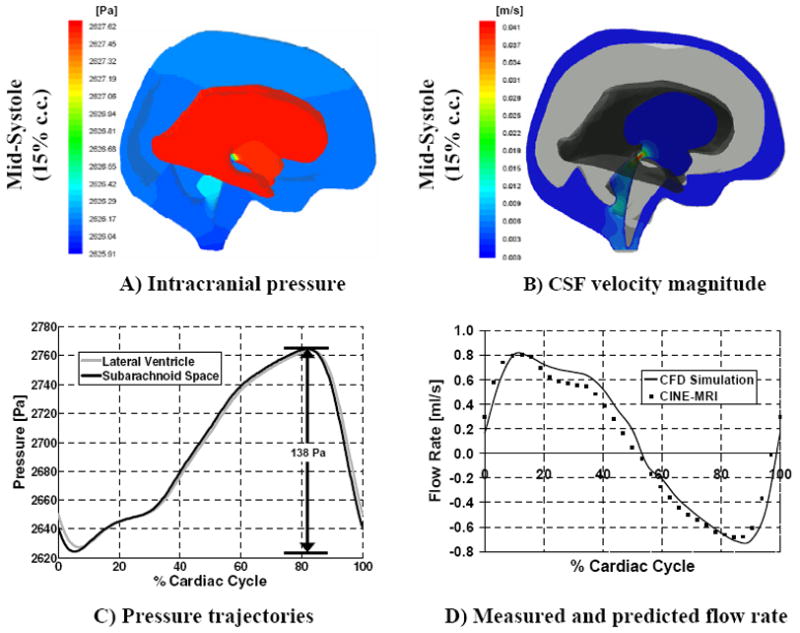
Predicted CSF pressure and velocity magnitude in the ventricles and subarachnoid space for the hydrocephalic case; the right hemisphere is hidden in these figures for easier visualization. Frame A: band plot of intracranial pressure at 15% of the cardiac cycle. Frame B: velocity magnitude in a two-dimensional cross section containing the aqueduct of Sylvius. Frame C: intracranial pressure in the lateral ventricles and upper convexity of the subarachnoid space during a cardiac cycle. Frame D: comparison between measured and predicted CSF flow rate in the third ventricle.
4. Discussion
4.1. CSF flow patterns and pressure dynamics
Fig. 6 displayed the CSF velocity magnitude in the ventricular system and pontine cistern over the course of the cardiac cycle. The maximum velocity magnitude in the pontine cistern precedes the maximum velocity magnitudes in the ventricles by about 10% of the cardiac cycle. This finding is in good agreement with recent clinical measurements also showing a phase lag of 10% between maximum pontine flow and ventricular flow [11,13,22–23]. In the human brain, blood traverses the Circle of Willis at the base of the brain before reaching the microvasculature. Because the Circle of Willis is near the pontine cistern, large arterial expansion in this region is likely to displace CSF out of the subarachnoid space before microvasculature expansion in the brain tissue causes CSF flow out of the ventricles. This explanation is consistent with in vivo CSF flow measurements indicating extracerebral expansion precedes brain expansion by about 8% of the cardiac cycle [16,24]. Cerebral vasculature relaxation leading to volumetric contraction of the large arterial vessels causes CSF flow reversal about mid-way into the cardiac cycle. Simultaneously, CSF refills the lateral ventricles to make up for the contracting parenchyma volume in the diastole.
4.2. Non-dimensional analysis of the Navier-Stokes equations
When the lateral ventricle pressure exceeds subarachnoid pressure, CSF flows out of the ventricles into the subarachnoid space. The flow reverses when subarachnoid pressure exceeds ventricular pressure. The change in flow direction is not directly in phase with the pressure sign change. Fig. 6 shows a transmantle pressure sign reversal at about 82% of the cardiac cycle where lateral ventricular pressure begins to exceed the pressure in the subarachnoid space. CSF however, begins to flow out of the ventricles only at about 98% of the cardiac cycle. We conclude that this is a delayed flow response with a phase lag of 58 degrees. The phase lag can be explained in terms of the Womersley number, a non-dimensional number derived from the unsteady Navier-Stokes equations.
The Womersley number, abbreviated Wo, relates flow pulsatility (unsteady or inertial forces) to fluid viscosity (viscous forces), and has been used to characterize flow and pressure dynamics in blood vessels and the cranial fluid space [11,25]. Experimental and theoretical studies have shown that when viscous forces are much larger than inertial forces the flow profile is parabolic and its direction immediately follows the instantaneous pressure gradient. In this case the flow is well represented by the Hagen–Poiseuille equation [26]. When inertial forces dominate viscous forces the flow profile is flat or plug-like. In this case, the flow direction is also governed by the pressure gradient, but some time is required to overcome the inertial forces and for the fluid direction to align with the instantaneous pressure gradient. In general, for Wo <1, the fluid velocity profile is parabolic and the flow is in phase with the pressure gradient. The fluid profile loses its parabolic shape when Wo > 1, and a phase lag between pressure and flow becomes more pronounced as Wo reaches ten or more [26–27]. Womersley numbers were calculated using eq. (5) in which ω is the pressure pulsation frequency, ν is the kinematic fluid viscosity, and R is characteristic length.
| (5) |
For a cylindrical fluid domain, the parameter R is simply the tube radius. For more complex geometry such as the brain ventricles, the characteristic length needs to be defined locally. Accordingly, local Womersley numbers were computed at three locations in the ventricular system as shown in Fig. 2. At these locations, the characteristic length, R, is the average radius of a circular cross section, the pressure pulsation frequency is 2π /T (with T = 1 s), and the kinematic viscosity is v = 10−6 m2s−1. Table 3 lists the Womersley numbers for the aqueduct-third ventricle junction, aqueduct, and aqueduct-fourth ventricle junction. The aqueductal Womersley number of our model differs by about 12% from the value reported in [11], indicating slight anatomical variations between normal subjects. All sites analyzed in the ventricular system had Womersley values greater than one. Our computational results show that as a consequence, noticeable phase separation is observed between the pressure gradient and the flow response. In summary, the phase lag can be attributed to highly pulsatile CSF flow within the ventricles where the Womersley numbers are much greater than unity.
4.3. Specific contributions
Early in this report, prior three-dimensional flow studies of the CSF spaces were reported. The premise of this and prior studies were that by studying the flow dynamics in the human brain diseases like hydrocephalus can be better understood, and perhaps better treatments for this disease can be devised. To this end, this report presents our most recent advancement in computational fluid flow analysis of the human brain. The main contributions from this particular study are the following:
The fluid motion in the entire subarachnoid space and ventricular system was modeled.
The pulsating CSF flow was set in motion by deforming tissue boundaries.
The three-dimensional analysis of normal dynamics was extended to a pathological case.
We believe these three contributions constitute a significant advancement over previous work. The first main contribution reflects our continued progress toward more complete and spatially accurate computational models of the central nervous system. The second main contribution stems from a concerted effort in our group to make system wide CSF models physiologically consistent. Clinical evidence points to the cerebral vasculature expansion as the driving force for CSF motion. Rather than imposing CSF motion directly as an inflow boundary condition, our model allows for fluid and tissue boundary interaction. Tissue boundary motion deforms the CSF space and drives CSF motion in a pulsatile, cyclical fashion. Finally, the third major contribution is the analysis of the CSF motion in a patient with communicating hydrocephalus. There is still a need for improving the diagnosis of hydrocephalus [16]. Improvements in diagnosing hydrocephalus may be possible once the differences between normal and hydrocephalic CSF flow patterns are satisfactorily quantified. The computational fluid dynamics results reported in this article foster a better fundamental understanding of flow principles, which will eventually lead to better diagnosis.
4.4. Model limitations, and future model refinement
In this extensive, yet preliminary investigation, some details of the cranial fluid space were not addressed. For example, the gyrated cortical surface was not resolved and the resistance posed by the arachnoid trabeculae was neglected. However, in view of the small pressure drops that occur in the CSF spaces, we believe these omissions will not significantly affect the flow field. The trabeculae may increase the flow resistance, but the large cortical surface area will decrease the resistance. Overall, resolving aspects of the geometric domain for which there is little data available does not yet seem to be warranted.
Also, lacking in our current model of intracranial dynamics is an accurate implementation for brain tissue stress. More research of brain tissue properties, and in particular tissue stiffness, is needed before mathematical models of the brain can provide accurate stress predictions. Recently, researchers have used magnetic resonance elastography (MRE) to measure brain tissue stiffness non-invasively [28–30]. To calculate the tissue shear modulus, Kruse et al. assume a Hookean, linear elastic relationship between stress and strain [28]. Green et al. [29] and Sack et al. [30] have used MRE to derive shear and shear-viscosity moduli to fit their proposed viscoelastic model of brain tissue. In the study conducted by Green et al., differences in white and gray matter are accounted for, whereas in the Sack et al. study, the tissue is assumed homogenous. Unfortunately, MRE is highly dependent on these underlying tissue property assumptions, and as such the literature values are often inconsistent qualitatively and quantitatively. For example, Kruse et al. report that white matter shear stiffness is higher than that of gray matter—13.6 kPa and 5.22 kPa, respectively. Conversely, Green et al. find that gray matter is stiffer than white matter—3.1 kPa and 2.7 kPa, respectively. Sack et al. does not differentiate between white and gray matter in their study, and is difficult to compare quantitatively. However, their overall tissue shear stiffness, ~1.2 kPa is closer to the value reported by Green et al. Complicating all these findings is the fact that shear stiffness is dependent on the excitation frequency applied to the tissue; typically anywhere between 25Hz to 100Hz. How the findings derived from high level excitations can be extrapolated for much smaller frequencies which naturally occur in the brain (~1Hz) has not been quantified. However, the MRE results seem to suggest a trend in the overall magnitude of the shear modulus. Thus, our implemented value of 3.4 kPa is on the same order of magnitude as that reported in the literature.
As a final note, accurate prediction of pathological brain dynamics will require model refinement. For the prediction of hydrocephalus, we propose to treat the brain tissue as poroelastic. This treatment will allow prediction of fluid transport in the brain as well as predict more accurately brain tissue stress induced by vasculature expansion or ventricular dilation. Modeling normal and diseased CSF dynamics may even be improved with the inclusion of the spinal canal because the tissues surrounding the spinal subarachnoid space provide the greatest region of compliance in the entire CNS. Although including the spinal canal in this three-dimensional model was beyond the scope of this study, we have addressed the impact on brain dynamics due to a compliant spinal canal in previous publications using a physiological compartmental model [31]. More advanced models accounting for the spinal canal are expected to elucidate the pressure-volume relationship and compensatory mechanisms of the CSF system, which has received much attention in hydrocephalus research [32–33].
5. Conclusions
In this study, experimental data was obtained from a normal subject and compared with a three-dimensional computational model of intracranial dynamics. Developed from subject-specific MR images, and using physiological boundary conditions as input, the model reproduces pulsatile CSF motion and predicts intracranial pressures and flow rates. CSF flow predictions agreed quantitatively with actual human CINE-MRI measurements. Small pressure gradients and amplitudes were predicted by the model. Based on the close match between model and experimental measurements, we conclude that the predicted pressure gradients and CSF flow fields are representative of those in the human brain.
Acknowledgments
The authors would like to gratefully acknowledge NIH for their partial financial support of this project, NIH-5R21EB004956, as well as a grant from the Stars Kids Foundation. We are grateful to Materialise Inc. for providing a free research trial license of the Mimics image reconstruction software. Laura Zitella was supported by an REU stipend from NSF Grant EEC 0754590. The study sponsors had no involvement in study design, data collection, analysis, interpretation of data, writing of the manuscript, or in the decision to submit the manuscript for publication.
Appendix
This appendix summarizes the equations in vector form and boundary conditions for the solution of the fluid-structure interaction problem of intracranial dynamics.
CSF flow
| (A1) |
| (A2) |
CSF boundary, and interface conditions and source terms
On non-deformable interfaces a no-slip boundary condition is applied for the fluid
| (A3) |
A baseline ICP pressure is applied on the upper subarachnoid space:
| (A4) |
Fluid-structure interaction constraints are applied along the upper wall of the lateral ventricle to ensure: (i) displacements of the fluid and solid domain are compatible; (ii) stresses at this boundary are at equilibrium, and (iii) no-slip condition for the fluid.
| (A5) |
| (A6) |
| (A7) |
where σ, d⃗,u⃗, n⃗ are the stress tensor, the vector of displacement, the velocity vector and the normal vector on the boundary [34].
| (A8) |
Tissue displacement
| (A9) |
Tissue boundary conditions and source terms
| (A10) |
The subscripts s, f indicate the solid and the fluid.
Footnotes
Conflict of interest statement
None declared.
Publisher's Disclaimer: This is a PDF file of an unedited manuscript that has been accepted for publication. As a service to our customers we are providing this early version of the manuscript. The manuscript will undergo copyediting, typesetting, and review of the resulting proof before it is published in its final citable form. Please note that during the production process errors may be discovered which could affect the content, and all legal disclaimers that apply to the journal pertain.
References
- 1.Nolte J, Sundsten JW. The human brain: an introduction to its functional anatomy. 5. Mosby; St. Louis: 2002. [Google Scholar]
- 2.Koyanagi I, Iwasaki Y, Hida K, Houkin K. Clinical features and pathomechanisms of syringomyelia associated with spinal arachnoiditis. Surg Neurol. 2005;63:350–355. doi: 10.1016/j.surneu.2004.05.038. discussion 355–356. [DOI] [PubMed] [Google Scholar]
- 3.Milhorat TH, Chou MW, Trinidad EM, Kula RW, Mandell M, Wolpert C, Speer MC. Chiari I malformation redefined: clinical and radiographic findings for 364 symptomatic patients. Neurosurgery. 1999;44:1005–1017. doi: 10.1097/00006123-199905000-00042. [DOI] [PubMed] [Google Scholar]
- 4.Linninger AA, Sweetman B, Penn R. Normal and hydrocephalic brain dynamics: the role of reduced cerebrospinal fluid reabsorption in ventricular enlargement. Ann Biomed Eng. 2009;37:1434–1447. doi: 10.1007/s10439-009-9691-4. [DOI] [PubMed] [Google Scholar]
- 5.Linninger AA, Xenos M, Zhu DC, Somayaji MR, Kondapalli S, Penn RD. Cerebrospinal fluid flow in the normal and hydrocephalic human brain. IEEE Trans Biomed Eng. 2007;54:291–302. doi: 10.1109/TBME.2006.886853. [DOI] [PubMed] [Google Scholar]
- 6.Jacobson EE, Fletcher DF, Morgan MK, Johnston IH. Computer modelling of the cerebrospinal fluid flow dynamics of aqueduct stenosis. Med Biol Eng Comput. 1999;37:59–63. doi: 10.1007/BF02513267. [DOI] [PubMed] [Google Scholar]
- 7.Jacobson EE, Fletcher DF, Morgan MK, Johnston IH. Fluid dynamics of the cerebral aqueduct. Pediatr Neurosurg. 1996;24:229–236. doi: 10.1159/000121044. [DOI] [PubMed] [Google Scholar]
- 8.Fin L, Grebe R. Three dimensional modeling of the cerebrospinal fluid dynamics and brain interactions in the aqueduct of sylvius. Comput Method Biomec. 2003;6:163–170. doi: 10.1080/1025584031000097933. [DOI] [PubMed] [Google Scholar]
- 9.Kurtcuoglu V, Soellinger M, Summers P, Boomsma K, Poulikakos D, Boesiger P, Ventikos Y. Computational investigation of subject-specific cerebrospinal fluid flow in the third ventricle and aqueduct of Sylvius. J Biomech. 2007;40:1235–1245. doi: 10.1016/j.jbiomech.2006.05.031. [DOI] [PubMed] [Google Scholar]
- 10.Cheng S, Tan K, Bilston LE. The effects of the interthalamic adhesion position on cerebrospinal fluid dynamics in the cerebral ventricles. J Biomech. 2010;43:579–582. doi: 10.1016/j.jbiomech.2009.10.002. [DOI] [PubMed] [Google Scholar]
- 11.Gupta S, Soellinger M, Boesiger P, Poulikakos D, Kurtcuoglu V. Three-dimensional computational modeling of subject-specific cerebrospinal fluid flow in the subarachnoid space. J Biomech Eng. 2009;131:1–11. doi: 10.1115/1.3005171. [DOI] [PubMed] [Google Scholar]
- 12.Linge SO, Haughton V, Lovgren AE, Mardal KA, Langtangen HP. CSF flow dynamics at the craniovertebral junction studied with an idealized model of the subarachnoid space and computational flow analysis. AJNR Am J Neuroradiol. 2010;31:185–192. doi: 10.3174/ajnr.A1766. [DOI] [PMC free article] [PubMed] [Google Scholar]
- 13.Zhu DC, Xenos M, Linninger AA, Penn RD. Dynamics of lateral ventricle and cerebrospinal fluid in normal and hydrocephalic brains. J Magn Reson Imaging. 2006;24:756–770. doi: 10.1002/jmri.20679. [DOI] [PubMed] [Google Scholar]
- 14.Hansen GA, Douglass RW, Zardecki A. Mesh enhancement: selected elliptic methods, foundations and applications. Imperial College Press; London: 2005. [Google Scholar]
- 15.Segal MB. Transport of nutrients across the choroid plexus. Microscopy Research and Technique. 2001;52:38–48. doi: 10.1002/1097-0029(20010101)52:1<38::AID-JEMT6>3.0.CO;2-J. [DOI] [PubMed] [Google Scholar]
- 16.Greitz D. Radiological assessment of hydrocephalus: new theories and implications for therapy. Neurosurg Rev. 2004;27:145–167. doi: 10.1007/s10143-004-0326-9. [DOI] [PubMed] [Google Scholar]
- 17.Charney DS, Nestler EJ. Neurobiology of mental illness. 2. Oxford University Press; New York: 2004. [Google Scholar]
- 18.Peters A, Jones EG. Cerebral cortex. Plenum Press; New York: 1984. [Google Scholar]
- 19.Blinkov SM, Glezer II. The human brain in figures and tables; a quantitative handbook. Basic Books; New York: 1968. pp. 173–174. [Google Scholar]
- 20.Hutsler JJ, Loftus WC, Gazzaniga MS. Individual variation of cortical surface area asymmetries. Cereb Cortex. 1998;8:11–17. doi: 10.1093/cercor/8.1.11. [DOI] [PubMed] [Google Scholar]
- 21.Tramo MJ, Loftus WC, Thomas CE, Green RL, Mott LA, Gazzaniga MS. Surface-Area of Human Cerebral-Cortex and Its Gross Morphological Subdivisions - in-Vivo Measurements in Monozygotic Twins Suggest Differential Hemisphere Effects of Genetic-Factors. J Cognitive Neurosci. 1995;7:292–302. doi: 10.1162/jocn.1995.7.2.292. [DOI] [PubMed] [Google Scholar]
- 22.Baledent O, Henry-Feugeas MC, Idy-Peretti I. Cerebrospinal fluid dynamics and relation with blood flow: a magnetic resonance study with semiautomated cerebrospinal fluid segmentation. Invest Radiol. 2001;36:368–377. doi: 10.1097/00004424-200107000-00003. [DOI] [PubMed] [Google Scholar]
- 23.Enzmann DR, Pelc NJ. Normal flow patterns of intracranial and spinal cerebrospinal fluid defined with phase-contrast cine MR imaging. Radiology. 1991;178:467–474. doi: 10.1148/radiology.178.2.1987610. [DOI] [PubMed] [Google Scholar]
- 24.Greitz D, Franck A, Nordell B. On the pulsatile nature of intracranial and spinal CSF-circulation demonstrated by MR imaging. Acta Radiol. 1993;34:321–328. [PubMed] [Google Scholar]
- 25.Ku DN. Blood flow in arteries. Annu Rev Fluid Mech. 1997;29:399–434. [Google Scholar]
- 26.Womersley JR. Method for the calculation of velocity, rate of flow and viscous drag in arteries when the pressure gradient is known. J Physiol. 1955;127:553–563. doi: 10.1113/jphysiol.1955.sp005276. [DOI] [PMC free article] [PubMed] [Google Scholar]
- 27.Loudon C, Tordesillas A. The use of the dimensionless Womersley number to characterize the unsteady nature of internal flow. J Theor Biol. 1998;191:63–78. doi: 10.1006/jtbi.1997.0564. [DOI] [PubMed] [Google Scholar]
- 28.Kruse SA, Rose GH, Glaser KJ, Manduca A, Felmlee JP, Jack CR, Jr, Ehman RL. Magnetic resonance elastography of the brain. NeuroImage. 2008;39:231–237. doi: 10.1016/j.neuroimage.2007.08.030. [DOI] [PMC free article] [PubMed] [Google Scholar]
- 29.Green MA, Bilston LE, Sinkus R. In vivo brain viscoelastic properties measured by magnetic resonance elastography. NMR Biomed. 2008;21:755–764. doi: 10.1002/nbm.1254. [DOI] [PubMed] [Google Scholar]
- 30.Sack I, Beierbach B, Hamhaber U, Klatt D, Braun J. Non-invasive measurement of brain viscoelasticity using magnetic resonance elastography. NMR Biomed. 2008;21:265–271. doi: 10.1002/nbm.1189. [DOI] [PubMed] [Google Scholar]
- 31.Linninger AA, Xenos M, Sweetman B, Ponkshe S, Guo X, Penn R. A mathematical model of blood, cerebrospinal fluid and brain dynamics. J Math Biol. 2009;59:729–759. doi: 10.1007/s00285-009-0250-2. [DOI] [PubMed] [Google Scholar]
- 32.Czosnyka ZH, Cieslicki K, Czosnyka M, Pickard JD. Hydrocephalus shunts and waves of intracranial pressure. Med Biol Eng Comput. 2005;43:71–77. doi: 10.1007/BF02345125. [DOI] [PubMed] [Google Scholar]
- 33.Meier U, Bartels P. The importance of the intrathecal infusion test in the diagnosis of normal pressure hydrocephalus. Journal of Clinical Neuroscience. 2002;9:260–267. doi: 10.1054/jocn.2001.1004. [DOI] [PubMed] [Google Scholar]
- 34.Valencia A, Morales H, Rivera R, Bravo E, Galvez M. Blood flow dynamics in patient-specific cerebral aneurysm models: the relationship between wall shear stress and aneurysm area index. Med Eng Phys. 2008;30:329–340. doi: 10.1016/j.medengphy.2007.04.011. [DOI] [PubMed] [Google Scholar]


