Abstract
Stapedial annular ligament (SAL) provides a sealed but mobile boundary between the stapes footplate and oval window bony wall. Mechanical properties of the SAL affect the transmission of ossicular movement into the cochlea in sound conduction. However, the mechanical properties of this tissue have never been investigated due to its complexity. In this paper, we report measurement of the viscoelastic properties of SAL on human cadaver temporal bones using a micro-material testing system with digital image correlation analysis. The measured load-deformation relations of SAL samples were converted into shear stress-shear strain relationship, stress relaxation function, and ultimate shear stress and shear strain of the SAL. The hyperelatic Ogden model was used to describe constitutive behavior of the SAL and a 3D finite element model of the experimental setup with SAL was created for assessing the effects of loading variation and measurement errors on results. The study demonstrates that the human SAL is a typical viscoelastic material with hysteresis, nonlinear stress-strain relationship and stress relaxation function. The shear modulus changes from 3.6 to 220 kPa when the shear stress increases from 2 to 140 kPa. These results provide useful information on quasi-static behavior of the SAL.
Key Terms: Stapedial annular ligament, viscoelastic properties, biomechanics, ear soft tissue
INTRODUCTION
The stapedial annular ligament (SAL) lies in the gap between the stapes footplate and the margin of the oval window [1, 2]. SAL provides a sealed but mobile boundary for transmission of ossicular movement into cochlear fluid [3, 4]. Histology and scanning or transmission electron microscopy studies on the SAL show a lattice-like structure consisted of peripheral mantle of microfibrils and transverse thick fibers across the SAL [5].
The motion of the stapes footplate has been identified as piston and hinge-like motions measured on human temporal bones by von Bekesy and Gyo et al. [6, 7]. The piston-like and rotational forms of stapes motion induce shear deformation of the SAL, and the mechanical properties of SAL directly affect the acoustic-mechanical transmission from the middle ear to cochlea. It is well known that otosclerosis of the stapes footplate and abnormal ossification of the SAL reduce the movement of the stapes and cause conductive hearing loss [8, 9]. Studies on effect of middle ear static pressure or inner ear pressure on umbo and stapes vibration conducted by Murakami et al. [10, 11] and Gan et al. [12] in temporal bones indicated that one mechanism behind those effects on sound transmission through the middle ear was due to the SAL stiffness changes. Research on the influence of middle ear on otoacoustic emission by Büki et al. [13, 14] suggested that evoked otoacoustic emission changes might be caused by an increase in the stiffness of the SAL, which was expected to reflect hydrostatic intracranial pressure changes as well. Moreover, since the transmission of sound energy from the middle ear to the cochlear fluid is largely dependent on SAL mechanical behavior, the properties of SAL have affected the outcomes of stapedotomy and stapesplasty surgical approaches with different prostheses or SAL grafts [15–17]. Therefore, understanding the mechanical properties of the SAL is one of the important research subjects in middle ear biomechanics.
Mechanical properties of the SAL have never been reported in the literature because of its location, small size and extremely complex geometry. This deficiency directly impacts a fully understanding of sound transmission from the middle ear to cochlea in normal and pathological conditions. In particular, mechanical properties and geometric configuration of the SAL are important to the development of an accurate finite element (FE) model of the ear. All FE models of the human ear to date estimate mechanical properties of the SAL through the cross-calibration process, and a constant elastic modulus varying from 0.065 to 5.5 MPa was used for some FE models, for example, Gan et al. and Wada et al. [18–20]. There is an urgent need to develop the techniques needed to measure SAL mechanical properties and biomechanical behavior so that accuracy of FE model of the human ear can be improved.
Recently mechanical properties of three middle ear soft tissues: tensor tympani tendon, stapedial tendon and anterior malleolar ligament, were reported by Cheng and Gan, using a micro-material testing system (MTS) with the aid of digital image correlation (DIC) analysis. The results show that the middle ear ligament and tendons are viscoelastical materials with stress relaxation and hysteresis behavior, and the Young’s modulus varies with stress level [21–23]. Cheng and Gan’s work demonstrates that experimental methods with MTS and DIC are a reliable and useful approach for measuring mechanical properties of soft tissues in the ear.
In this study, we employ a similar method on the stapes and oval window complex to measure the mechanical properties of the SAL. Our aim is to characterize the shear stress and shear strain relationship of the SAL in response to normal function of the stapes at quasi-static state. The load-deformation relation, stress relaxation function, and ultimate loading and deformation of the SAL specimen within a human temporal bone, as well as the geometry of the SAL, were directly measured in MTS first. The shear stress-shear strain relationship was derived using the Ogden hyperelastic model. Finally, the effect of variations in experimental setup on measurement results was assessed using a 3D FE model of the SAL with the stapes attached. It is expected that the mechanical properties of the human SAL reported in this study for the first time will have significant impact on advancing our knowledge of SAL and improving the accuracy of FE model of the human ear.
METHODS
I. Specimen preparation
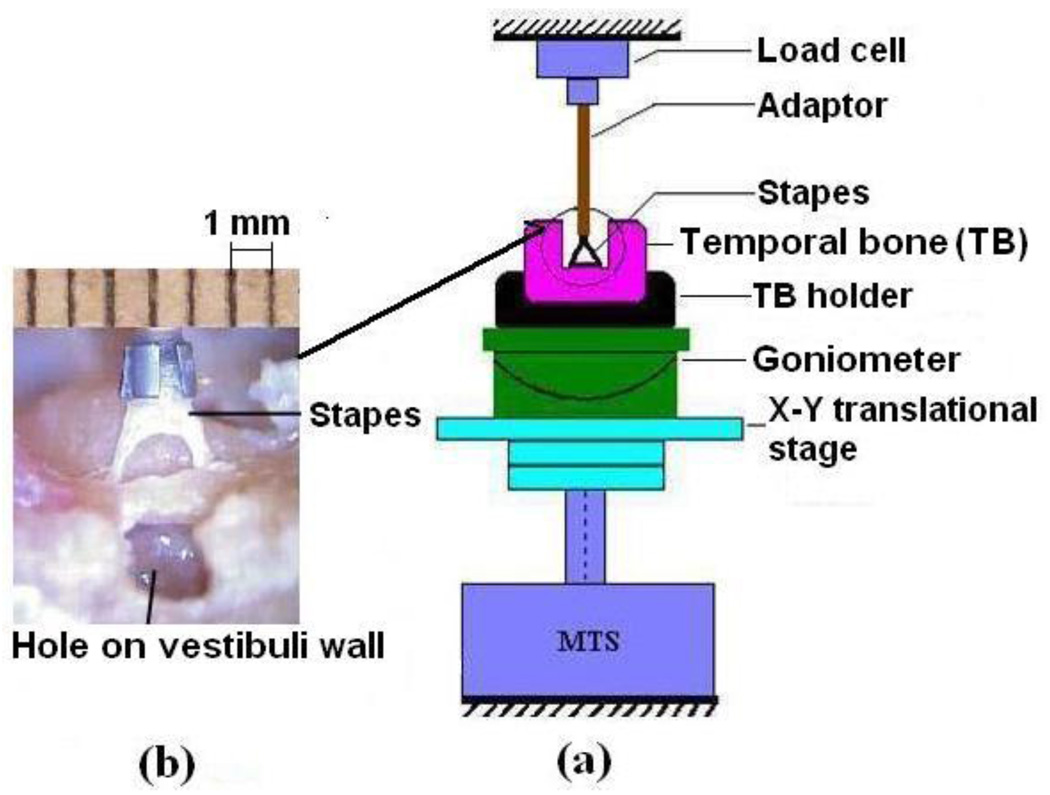
Nine fresh human temporal bones obtained through the Willed Body Program at the University of Oklahoma Health Sciences Center were used for this study. The average age of donors was 72 (ranging from 50 to 86 years, three male and six female). To maintain soft tissue compliance and hydration within 5 days before the experiment, the bones were immersed in 0.9% saline solution mixed with providine (i.e., 15% amount of providine in saline solution) at 5°C until use. The bone was checked under the microscope for degradation or abnormality before experiments. After opening the tegmen and removing the tympanic membrane together with the malleus and incus, the temporal bone was cut into a 3 cm×3 cm×1.5 cm cube to expose the stapes with attached SAL and surrounding bony wall. The scala vestibuli wall near the oval window was opened to release cochlear pressure and add saline solution to maintain the physiological condition for the tissue. The SAL sample block was then placed in a X-Y micro-translational stage in the MTS (Model 100R, TestResources, MN) as shown in Fig. 1a. A titanium partial ossicular-replacement prosthesis (PORP, Gyrus ENT, LLC, Memphis, TN) was used as a mounting fixture/adaptor. The stapes head was fixed to the metal cap of the PORP with a tiny drop of cyanoacrylate gel glue and attached to the load cell. Care was taken to not allow the glue to reach the ligament. The oval window bony wall was fixed to the temporal bone holder and placed on the X-Y translational stage. A ruler was attached to the top of the adaptor as a reference for dimension measurement (Fig. 1b). A preload of 0.001 N was applied to the specimen through the load cell to adjust the zero load state which is the same as that used in our previous tests on soft tissues [21–24]. However, the position of the footplate in the oval window was not visible during preloading and was only indicated by the load reading in MTS.
FIGURE 1.
(a) Schematic of the experiment setup for SAL test in MTS. The stapes head was fixed to the mounting fixture and the oval window bony wall with temporal bone was fixed on the rotational and translational stations. (b) A picture of the SAL specimen with the stapes and temporal bone structure taken during the experiment. The ruler was attached to the metal cap or the fixture at the load cell side as a dimensional reference.
II. Mechanical testing
The MTS with SMT-1, 10.0 Newton capacity load cell (Interface, Inc.) was used to measure the load-deformation relation, stress relaxation function, and ultimate load and deformation of the SAL. The load was applied to the stapes head through the fixture and metal cap. The preconditioning was performed first to reach the steady state for each specimen [25]. The MTS was programmed to perform five cycles of elongation to the maximum displacement of 0.02 mm at the rate of 0.02 mm s−1. Based on published experimental measurements on middle-ear soft tissues by Cheng et al. [21–24], this rate is appropriate for internal structure changes of the tissue and eventually reaching a steady state without further change. After preconditioning, the specimen was subjected to three tests: tensile, stress relaxation and failure tests. At the end of a tensile or stress relaxation test, the specimen was returned to the initial state and 2 to 3 minutes were allowed for recovery from the previous deformation until the live load reading from the load cell was zero. The deformation process for each specimen was recorded simultaneously using a digital CCD camera. MTS and CCD camera were electronically synchronized so that the load and deformation data on images could be correlated simultaneously. Displacement measured by MTS and images of deformation acquired by CCD camera were collected to compute the shear strain. The protocols for three tests in MTS were described as follows.
1. Tensile test
The displacement rate was set at 0.002 mm s−1 to a specific displacement at 0.2 mm. Three parameters: load, deformation and time, were recorded with a resolution level of 1 mN in force and 10−3 mm in displacement. These data were further used to calculate the shear stress-strain relationship of the ligament.
2. Stress relaxation test
An approximate step function of elongation 0.2 mm displacement was applied to the specimen at the beginning (t=0) with a displacement rate of 0.4 mm s−1. The corresponding load force including the initial load F0 at t=0 and the relaxed load F(t) at time t, were recorded over a period of time until the rate of loading change was less than 0.1 % s−1, or fully relaxed. Then, the MTS data recording program was stopped manually and the specimen was returned to the initial unstressed state for the failure test.
3. Failure test
The displacement rate was set at 0.002 mm s−1. The SAL was under shear deformation until it was broken and the stapes footplate moved out from the oval window. The entire failure process including the load and displacement was recorded, and the breaking situation of the specimen was observed. Note that all the specimens were maintained in physiological condition by maintaining the normal amount of saline solution for the specimen during the test.
III. Digital image correlation method
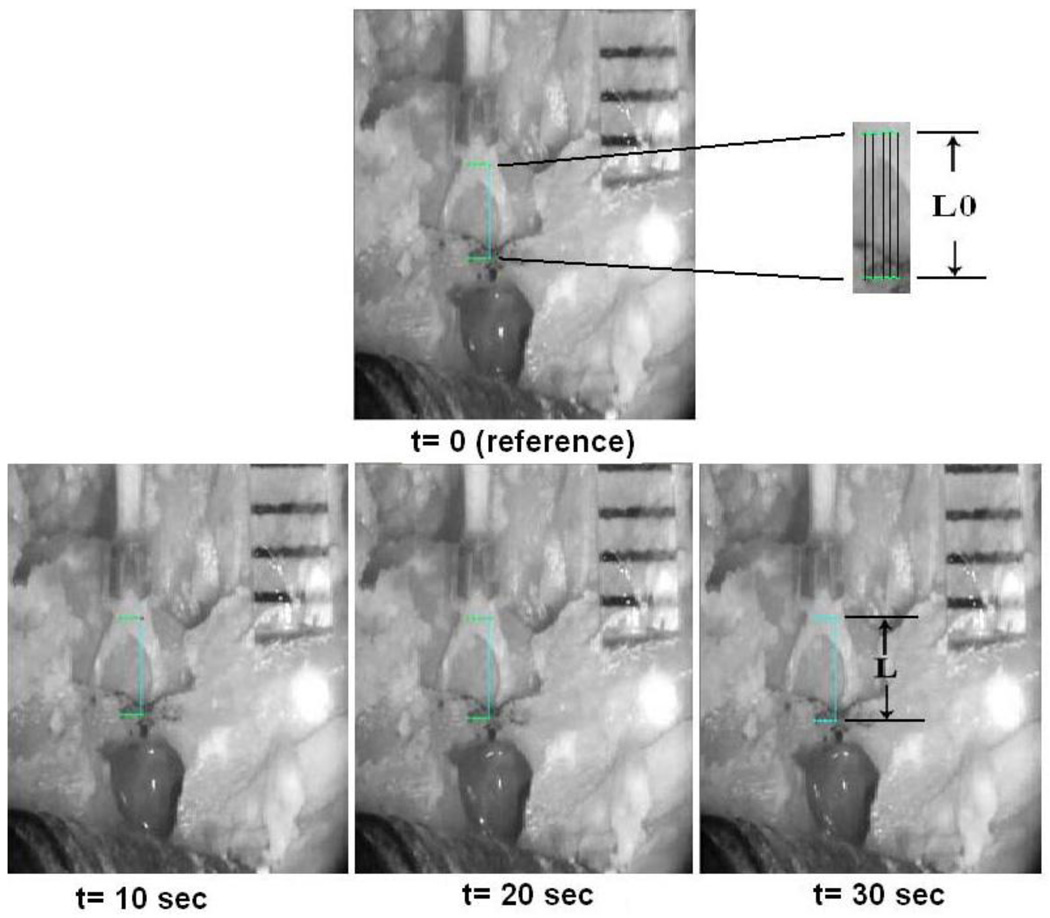
To verify the boundary effect of the loading in mechanical test of the SAL specimen, digital image correlation (DIC) method was employed to capture the displacement of the SAL during the loading process in the tensile test. Simultaneously recorded images from the tensile test were analyzed based on a grayscale pattern of pixels in the image. In this study, 22 steps of specimen images at a constant time interval over the loading process were obtained from the CCD camera and installed into the DIC software (WinDOC_LS 2.0). A 5×2 grid of 10 nodes was generated around the center of the first image (t=0), or the reference image, in the stapes near the head and the bony wall of the oval window (Fig. 2). Five points were selected on each side (stapes and bony wall) and two horizontal lines along the top (stapes) and bottom (bony wall) points were identified along with five vertical lines connecting grid nodes on the horizontal lines. The length of each vertical line was used as the original length (L0) in the reference image, and was traced in deformed images as the deformed length (L). The average displacement distribution of five locations between the moving stapes and fixed bony wall from the beginning to the end of a loading-unloading process at each of the 22 steps was compared with the displacement measured in MTS. Specimen with comparable average displacement from the DIC and MTS was used to derive the displacement of the SAL, and the same process was applied to every specimen. Detailed procedure of DIC can be found in a published paper on the tympanic membrane viscoelastic properties by Cheng et al. [24].
FIGURE 2.
Digital image correlation (DIC) method for calculating the strain of the SAL under loading process. The image at time t=0 was used as reference image and three images of the specimen at constant time intervals (t=10, 20, 30 s) were used as deformed images. A grid was generated at the stapes head (moving part) and bony wall (fixed part). The horizontal and vertical lines were identified by connecting five points horizontally and two points vertically. The length of the vertical line in reference image is measured as the original length (L0) and the length of the vertical line in deformed images is the deformed length (L).
IV. Measurement of SAL dimensions
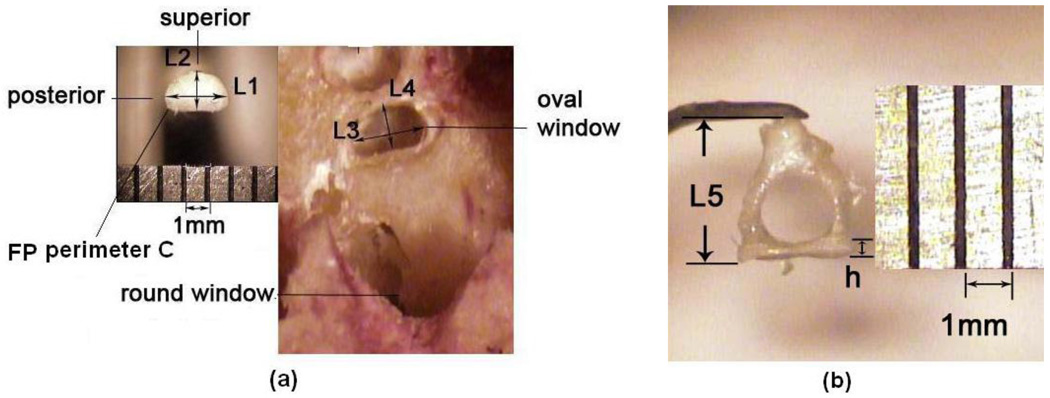
Upon completion of the failure test, the stapes footplate was moved out of the oval window. Still images of the stapes footplate and oval window were captured using a digital CCD camera for calculation of the SAL dimensions as the gap between the stapes footplate and oval window bony wall. The Measure Tool in Adobe Photoshop 7.0 and MATLAB 7.1 were used to measure the thickness, width and perimeter of the SAL specimen. Figure 3a shows the measurements of stapes footplate length L1 and width L2, and oval window length L3 and width L4. The length or width difference between the stapes footplate and oval window, L3-L1 or L4-L2, was measured at several locations and the average of these measurements was used for calculation of the SAL thickness d, defined as the gap between the stapes footplate and oval window and assumed to be uniform along the perimeter of the footplate. The SAL height, which was considered to be the same as the stapes footplate height h, and the stapes height L5 were measured from the captured image of the specimen shown in Fig. 3b. The perimeter of the SAL inner rim or footplate perimeter C was calculated from the transferred binary image of the stapes footplate in MATLAB 7.1. The same measurement was applied to each specimen after failure test. Table 1 lists the dimensions of SAL specimens (N=9) with mean and standard deviation.
FIGURE 3.
Images of the stapes footplate (FP) and oval window (a) and stapes (b) obtained after experiments on one SAL temporal bone specimen. L1: FP length; L2: FP width; L3: oval window length; L4: oval window width; L5: stapes height; h: FP height (assumed as the SAL height); C: FP perimeter.
Table 1.
Dimensions of SAL measured from nine specimens with mean and S.D.
| SAL1 | SAL2 | SAL3 | SAL4 | SAL5 | SAL6 | SAL7 | SAL8 | SAL9 | Mean | S.D. | |
|---|---|---|---|---|---|---|---|---|---|---|---|
| FP length L1 (mm) | 2.7 | 2.78 | 2.78 | 2.44 | 2.31 | 2.75 | 2.11 | 2.67 | 2.54 | 2.56 | 0.24 |
| FP width L2 (mm) | 1.2 | 1.27 | 1.23 | 1.19 | 1.06 | 1.15 | 1.05 | 1.22 | 1.11 | 1.16 | 0.08 |
| OW length L3 (mm) | 2.83 | 3.09 | 2.97 | 2.66 | 2.44 | 2.91 | 2.31 | 2.82 | 2.75 | 2.75 | 0.25 |
| OW width L4 (mm) | 1.31 | 1.35 | 1.3 | 1.29 | 1.21 | 1.24 | 1.11 | 1.28 | 1.21 | 1.26 | 0.07 |
| SAL thickness d (mm) | 0.06 | 0.09 | 0.06 | 0.08 | 0.07 | 0.07 | 0.07 | 0.05 | 0.08 | 0.07 | 0.01 |
| SAL (FP) height h (mm) | 0.2 | 0.21 | 0.31 | 0.21 | 0.2 | 0.25 | 0.16 | 0.22 | 0.22 | 0.22 | 0.04 |
| SAL (FP) perimeter C (mm) | 9.04 | 7.79 | 7.72 | 8.85 | 7.73 | 8.69 | 7.75 | 7.1 | 7.01 | 7.96 | 0.73 |
| Stapes height L5 (mm) | 3.14 | 2.94 | 3.1 | 2.81 | 3.1 | 3.24 | 3.14 | 2.76 | 3.1 | 3.04 | 0.16 |
Note: FP denotes footplate; OW denotes oval window.
V. Shear stress and shear strain calculation
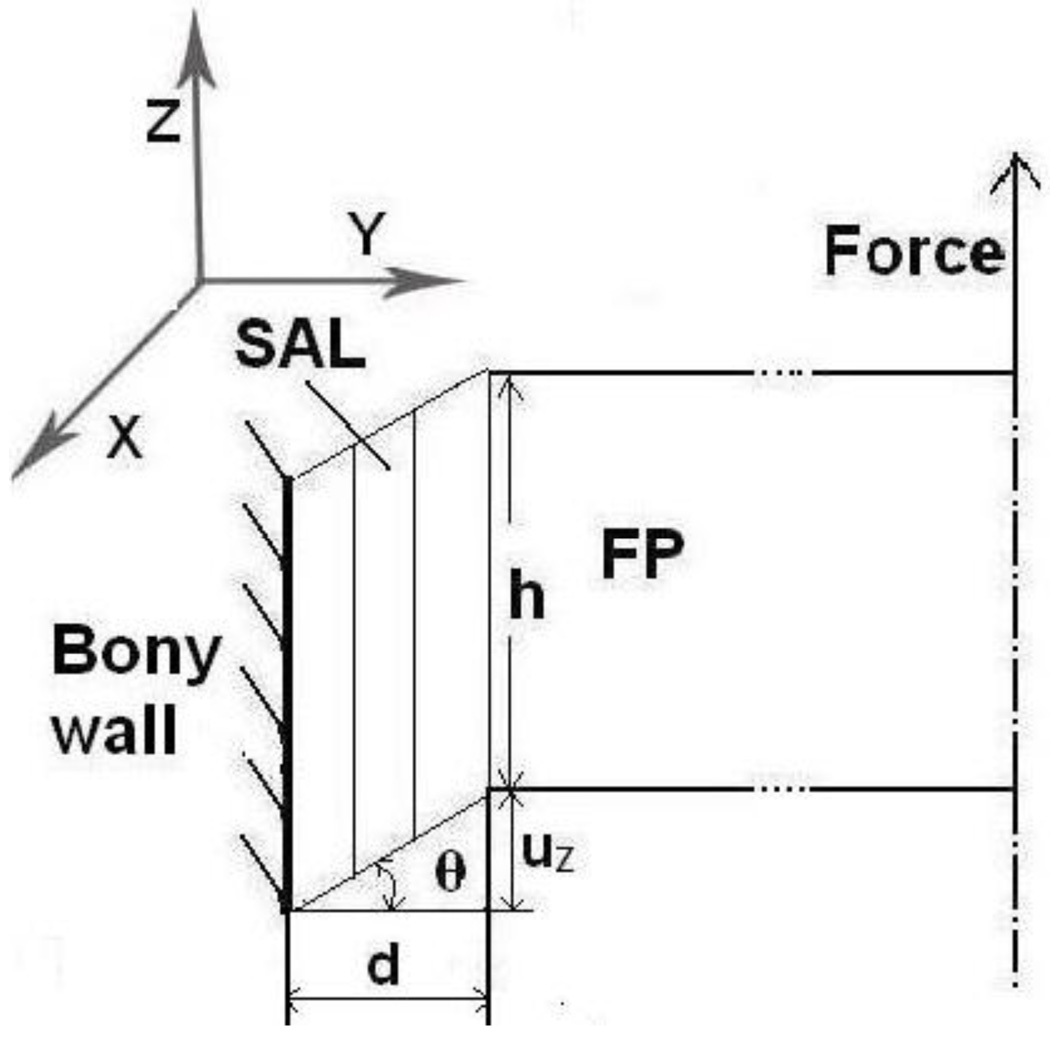
During the tensile test in MTS, the deformation of the SAL tissue was assumed under simple shear as shown in Fig. 4 schematically. The outer rim of the SAL connected to oval window bony wall was fixed, and the inner rim attached to the stapes footplate was subjected to the loading force F. The ligament was assumed to be incompressible and the shear stress generated in the SAL, τ, was defined as force divided by contact area:
| (1) |
where the loading force F was measured from MTS, both C and h were measured from specimens as listed in Table 1. The shear strain γ was expressed as
| (2) |
where uZ was the displacement measured from MTS or DIC method. The results presented in this paper were based on the measurements from DIC.
FIGURE 4.
Schematic of shear deformation configuration of SAL during tensile test. FP denotes footplate; F: loading force; h: FP or SAL height; d: thickness of SAL, the gap between the FP and oval window; θ: angle deformation; uZ: displacement along the Z-axis or loading force direction. (b) The image of the SAL from the FE model under the tensile test. The SAL was deformed uniformly along the perimeter in x2 direction.
The Ogden hyperelastic model was used as the constitutive relation for the SAL with a strain energy function W [26],
| (3) |
where λ1, λ2 , λ3 are the principle stretch ratios along the principle axes, and α1 and μ1 are Ogden material constants. In simple shear deformation of SAL, the principle stretch ratios in relation to shear strain γ are given by [26]
| (4) |
Thus, the shear stress τ, can be expressed as a function of stretch ratio λ (e.g., λ1) and the constitutive equation of the SAL can be expressed as
| (5) |
Parameters α1 and μ1 are determined through data iteration process in MATLAB by fitting the experimental τ-γ curves. Once these two parameters are determined, differentiating Eq. (5) with respect to γ gives the shear modulus (dτ/dγ) as a function of shear strain γ. By simply converting shear strain γ into shear stress using Eq. (5), shear modulus can be plotted against shear stress to derive the shear modulus-shear stress relationship of the SAL. This curve will show nonlinearity of SAL material properties.
RESULTS
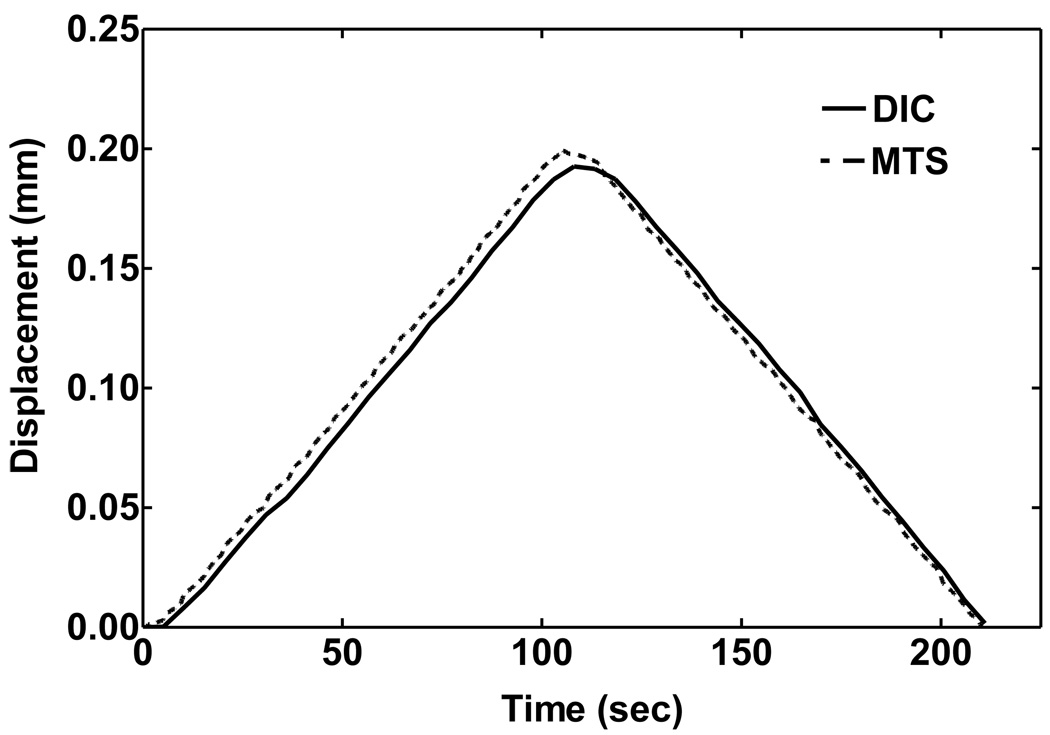
Figure 5 shows the displacement curves of a SAL specimen obtained from DIC analysis (solid line) and MTS measurement (broken line) during the tensile test under loading and unloading processes. The displacement measured from MTS and calculated from the DIC images are in general agreement, although the displacement from DIC is slightly lower than that from MTS in the loading process, and slightly higher than MTS in unloading. These differences may be induced by geometric and structural non-uniformity of the SAL tissue and sensitivity of the DIC method in calculating the local deformation of the tissue. Note that deformation of the stapes could be involved in MTS measurements during loading, but generally is not involved in DIC measurements. However, considering the large difference of material strength between the bone and soft tissue (4 orders of magnitude), the stapes deformation was not considered in MTS and DIC measurement. Table 2 lists the DIC results of vertical displacement distribution at five locations (see Fig. 2) over four time steps during the tensile test. The horizontal distance between two points was 0.1 mm, and the maximum tilting angle of the SAL specimen in two neighboring points over four time steps was 0.28° across the specimen. The results indicated that the bending component was small enough to be neglected. The grid displacements of five points from left to right shown in Fig. 2 distributed uniformly across the specimen.
FIGURE 5.
Comparison of the displacement curves of a SAL specimen obtained from MTS measurement and DIC analysis under loading and unloading process.
Table 2.
Displacement distribution during the tensile test from DIC analysis. There are five points along the horizontal lines in stapes and fixed bony wall (Fig. 2).
| Time | Point 1(mm) | Point 2 (mm) | Point 3(mm) | Point 4 (mm) | Point 5(mm) | Mean (mm) |
|---|---|---|---|---|---|---|
| 50s | 0.0753 | 0.0756 | 0.0758 | 0.0771 | 0.0773 | 0.0762 |
| 100s | 0.1853 | 0.1857 | 0.1835 | 0.1839 | 0.1852 | 0.1847 |
| 150s | 0.1114 | 0.1124 | 0.1108 | 0.1112 | 0.1115 | 0.1115 |
| 200s | 0.0125 | 0.0122 | 0.0134 | 0.0134 | 0.0137 | 0.0130 |
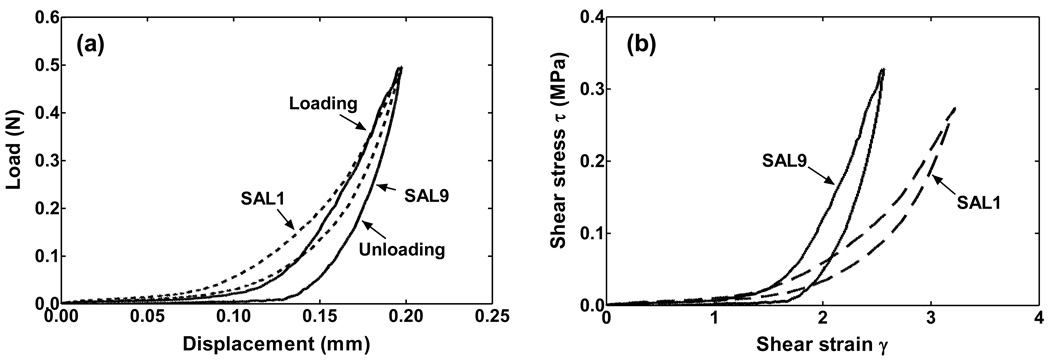
Figure 6a shows the original force-displacement data obtained from the tensile test on two SAL specimens, SAL1 and SAL9. Figure 6b shows the shear stress-shear strain curves of these two specimens with their geometry measurements based on Eqs. (1) and (2). There is an obvious difference of the shear stress-shear strain curves between individual specimens, which may represent the influence of SAL geometry on the stress-strain relationship measured from experiments. It is also observed that the hysteresis loop of the stress-strain curve shown in Fig. 6 is consistent with that of other specimens, with the unloading curve below the loading curve. Mechanical properties of the SAL presented in this study were all from the loading curves.
FIGURE 6.
(a) Original force-displacement curves of two SAL specimens obtained from tensile tests after preconditioning. The dash line denotes specimen SAL1 and the solid line denotes specimen SAL9. (b) Shear stress-shear strain curves of two SAL specimens transformed from the force-displacement curves in (a).
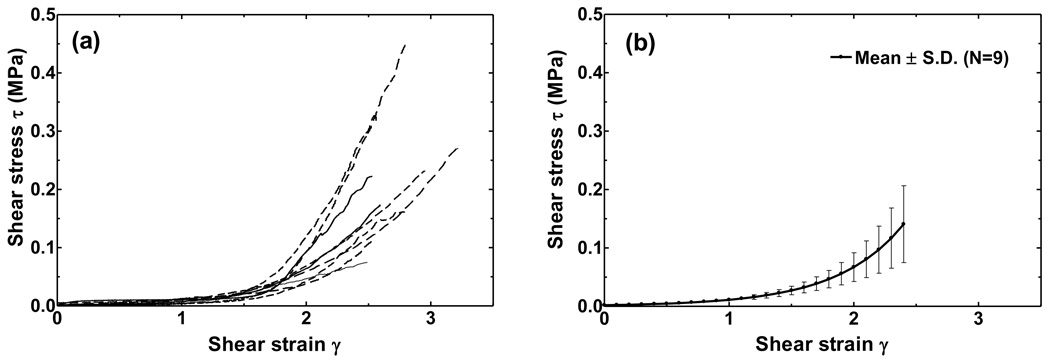
Figure 7a shows the shear stress-shear strain curves of nine SAL specimens. The shear stress varies from 0 to 450 kPa as the shear strain γ changes from 0 to 3. The curves are almost flat at strains below 1.2 and the nonlinear stress-strain relationship is clearly shown here. Figure 7b displays the mean stress-strain curve with standard deviation. The standard deviation increases with stress, but the relative standard deviation remained at 0.45, which indicated that the variation between individual specimens was not changing with the stress level. As can be seen in Figs. 6 and 7, there are variations among individual specimens which may be due to differences in age, sex, health, variations of the geometric parameters, and post-mortem effects.
FIGURE 7.
(a) Shear stress-shear strain curves of nine SAL specimens obtained from tensile tests. (b)The mean value of stress-strain relationship of nine SAL specimens with standard deviation bars.
Material constants μ1 and α1 of the Ogden model obtained individually through the data iteration process in MATLAB from nine specimens are listed in Table 3. The mean values of μ1 and α1 from nine specimens are 3.28 kPa and 5.9, respectively. The parameters μ1 and α1 derived from the mean shear stress-shear strain curve shown in Fig. 7b are 3.6 kPa and 5.75, respectively. This result shows that these two approaches to obtain the Ogden model material constants were consistent and we used the mean stress-strain curve or μ1=3.6 kPa and α1=5.75 to obtain the constitutive equation for the SAL from Eq. (5):
| (6-1) |
and
| (6-2) |
Table 3.
Ogden model parameters fitted individually from nine specimens in tensile tests.
| SAL1 | SAL2 | SAL3 | SAL4 | SAL5 | SAL6 | SAL7 | SAL8 | SAL9 | Mean | |
|---|---|---|---|---|---|---|---|---|---|---|
| μ1 (kPa) | 5.08 | 4.87 | 2.93 | 1.78 | 1.64 | 5.93 | 2.02 | 2.7 | 2.61 | 3.28 |
| α1 | 4.97 | 4.61 | 5.39 | 6.96 | 6.28 | 4.99 | 7.02 | 6.02 | 6.85 | 5.9 |
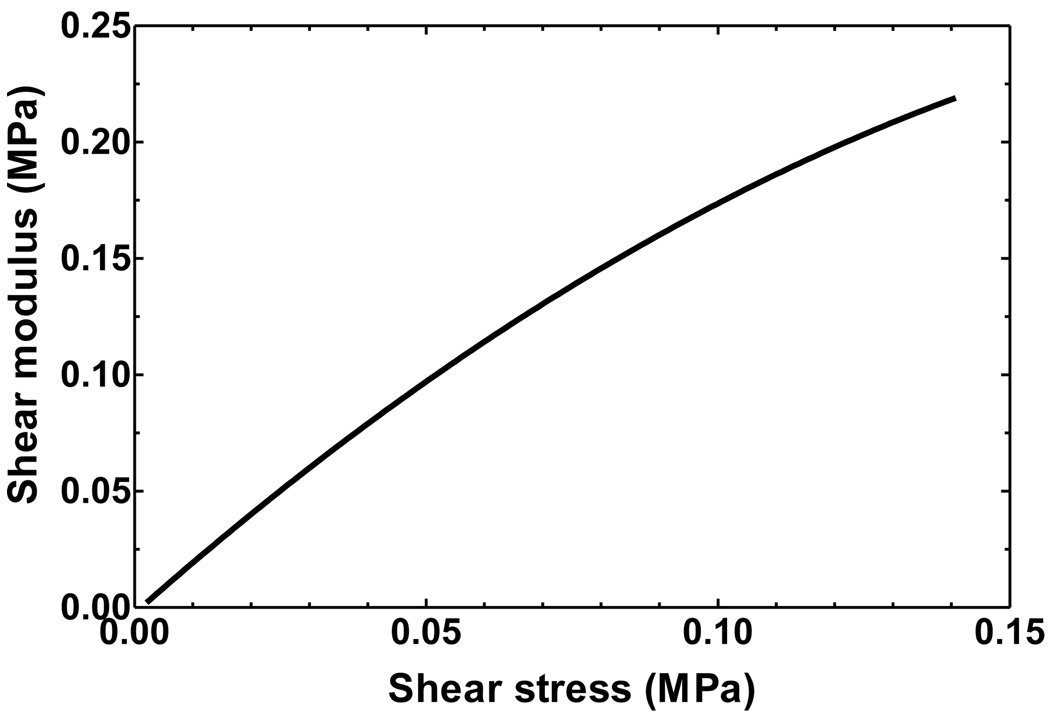
Figure 8 shows the shear modulus (dτ/dγ) and shear stress (τ) relationship obtained from the mean shear stress and shear strain curve. Shear modulus increases with shear stress and the shear modulus-shear stress relationship for 2 ≤ τ ≤ 140 kPa can be expressed as
| (7) |
The shear modulus rises from 3.6 to 220 kPa when shear stress increases from 2 to 140 kPa. The shear modulus increases faster at low stress levels than at high stress levels.
FIGURE 8.
The shear modulus-shear stress relationship of the SAL over stress range of 2 to 140 kPa. The shear modulus increases from 3.6 to 220 kPa over the stress range.
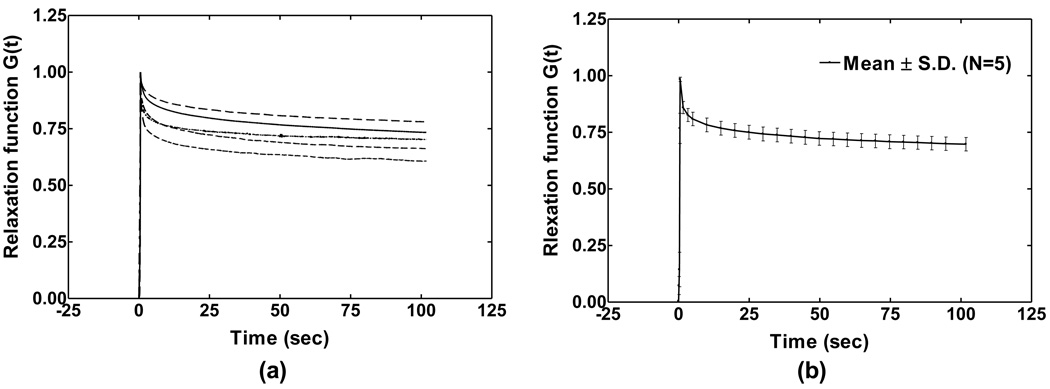
The stress relaxation test of the SAL was conducted in five specimens as shown in Fig. 9 (the relaxation test was not performed in the first four specimens). The specimen was initially stressed at a strain rate of 0.4 mm s−1, 200 times faster than the tensile test, to reach a step elongation of 0.2 mm. Then, the moving head of the testing machine was suddenly stopped, the sample deformation was maintained constant afterward, and the stress in the specimen was recorded with the time. The curves in Fig. 9 show quasi-linear viscoelastic properties of SAL. The stress relaxation function G(t) is defined as the normalization of stress at time t (t>0) with respect to the initial elastic response at t=0. Note that a step increase in elongation on the specimen was assumed in the experiment and the correction for the ramp loading was not conducted in this study [27].
FIGURE 9.
(a) Normalized stress relaxation function G(t) curves measured from five SAL specimens. (b) The mean curve of stress relaxation function G(t) of five specimens with standard deviation bars.
G(t) decreased with time and finally reached a stable state at 100 s, or the change rate of stress was less than 0.1% s−1. The stress was considered fully relaxed after 100 s. The individual specimen shown in Fig. 9a relaxed 29.6%, 39.3%, 21.8%, 33.7% and 29.7% of the initial stress after 100s, respectively. The mean value of G(t) with standard deviation is displayed in Fig. 9b. An average of 30.4% of the initial stress was totally relaxed after 100s. The mathematical expression of relaxation function G(t) of SAL was obtained using Prony series based on quasi-linear viscoelastic theory [25]:
| (8) |
where τ1 is the first Prony retardation time constant and p1 is the first Prony constant which represents the ratio between the relaxed stress and initial stress. The one-term Prony series for SAL was selected for this study, which satisfied the accuracy for simulation of the experimental data. The two coefficients τ1 and p1 were determined through data iteration in MATLAB. The stress relaxation function G(t) from the mean curve of five SAL samples was determined as
| (9) |
where p1 = 0.278 and τ1 =5.102 s. Considering that the loading time of 0.5 s was much smaller than the relaxation time of 100 s, the stress relaxation function derived from the tests was accepted as a close approximation of the real relaxation function of the SAL.
The ultimate shear stress and shear strain of nine SAL specimens obtained from failure tests are listed in Table 4. The mean ultimate shear stress is 0.4 MPa, and all specimens were broken under shear strain of 3.81 on average.
Table 4.
Ultimate shear stress and shear strain of SAL measured from nine specimens in failure tests.
| SAL1 | SAL2 | SAL3 | SAL4 | SAL5 | SAL6 | SAL7 | SAL8 | SAL9 | Mean | S.D. | |
|---|---|---|---|---|---|---|---|---|---|---|---|
| Ultimate τ (MPa) | 0.33 | 0.11 | 0.71 | 0.28 | 0.22 | 0.39 | 0.86 | 0.47 | 0.27 | 0.4 | 0.24 |
| Ultimate γ | 3.66 | 3.1 | 4.48 | 4.37 | 3.44 | 4.01 | 3.92 | 4.29 | 3 | 3.81 | 0.54 |
DISCUSSION
I. Assessment of experimental setup
Due to the small size and complex geometry of SAL, specimen was harvested with the stapes and surrounding bone to preserve physiological boundary conditions of the ligament. To simulate the piston-like motion of stapes at low frequencies, loading force was applied on the stapes head to stretch the stapes footplate and resulted in shear deformation of the SAL. Variations of loading direction and specimen geometry in experiments affect measurement data. To assess these effects, we created a 3D finite element model of the SAL with stapes attached and performed FE analysis as well as error estimation of experimental measurements.
I-1. Finite element model of SAL
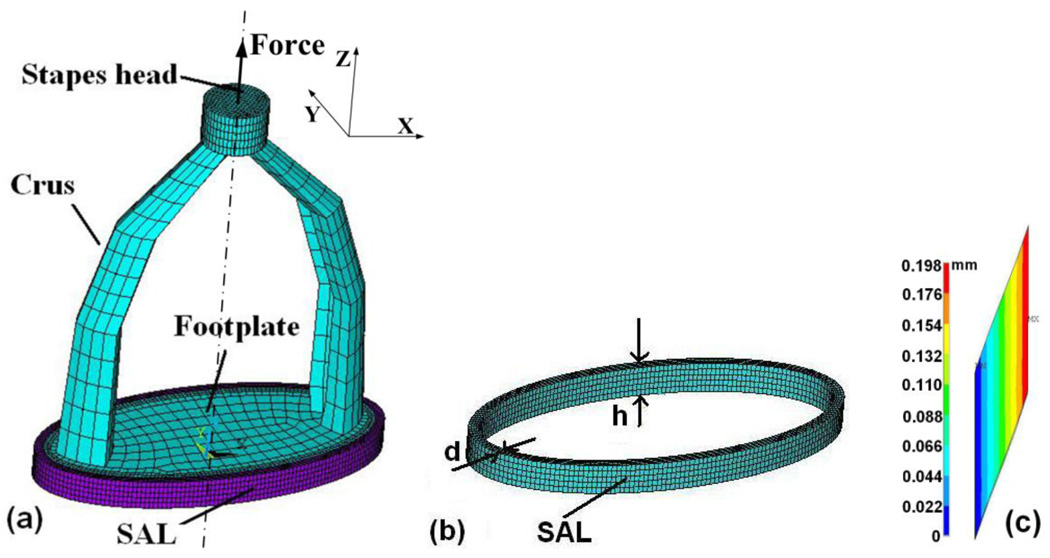
A 3D FE model of the SAL with the stapes attached based on mean dimensions of nine SAL specimens is shown in Fig. 10. The SAL was simulated as an elliptic shape in ANSYS (ANSYS Inc., Canonsburg, PA). The inner rim of the SAL attached to the footplate had major axis (L1) of 2.56 mm and minor axis (L2) of 1.16 mm from Table 1 (mean values). The thickness d and height h were 0.07 mm and 0.22 mm, respectively. The stapes with a height of 3.04 mm was meshed by 8-node hexahedral solid element (Solid 45) with a total of 4,860 elements and 7,308 nodes. The SAL was meshed by 8-node hexahedral nonlinear solid element (Solid 185) with a total of 4,000 elements and 6,000 nodes.
FIGURE 10.
(a) 3D FE model of SAL (purple in color) with the stapes attached (blue in color), constructed from the mean geometry measurements of nine samples. (b) 3D FE model of SAL with thickness d and height h. (c) Cross-sectional image of the displacement (uZ) distribution in the SAL at the left edge of the stapes footplate.
The density of the stapes was assumed to be 2200 kg m−3 and that of the SAL was 1200 kg m−3. The Young’s modulus of the stapes as bone material was approximated as 1.41×10¹⁰ N m−2 [18, 19]. SAL was assumed to be isotropic and defined by Ogden hyperelastic model with two material constants μ1 and α1 which were determined from experimental measurements in Table 3. Fixed boundary condition was applied at the outer rim of the SAL to simulate the oval window bony wall. Footplate with surrounding SAL was placed in the X-Y plane, and force was applied at the center of stapes head along the Z-axis to simulate tensile experiment in MTS. Elongation was accomplished by 20 substeps to reach a maximum of 0.2 mm used in the tensile test.
I-2. Assessment of simple shear deformation
Deformation of SAL under tensile test in MTS was assumed to be simple shear. Both outer and inner rims of the SAL were fixed and the tissue was under shear deformation across its thickness d. Figure 10c shows the distribution of displacement uZ across the SAL at the left edge of the stapes footplate when force was applied and a maximum displacement 0.2 mm of the footplate was induced. As shown in this figure, the displacement component uZ was linearly distributed across the SAL. The edge of the dark blue line is the fixed bony wall with zero displacement. The edge of the bright red line is connected to the footplate with maximum displacement of 0.198 mm. There is no mixed pattern between different color lines or no displacement components along the X or Y direction were observed. The FE modeling results indicate that simple shear dominated the deformation of SAL in tensile test in MTS.
I-3. Assessment of off-axis component to the experimental setup
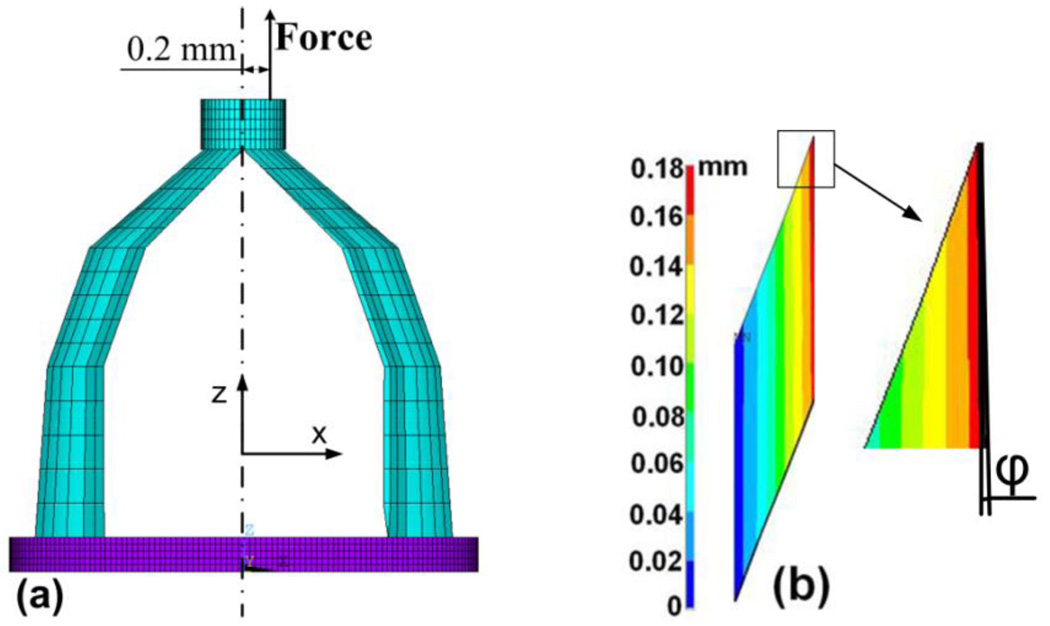
It is possible that the force or load applied on the stapes head may not be exactly along the central line (Z-axis) and a bending could be applied on the SAL specimen. To estimate the effect of bending component on experimental measurements, a force of 0.38 N (a large force selected from the experiments) offset from the central Z-axis at radius of 0.2 mm was applied in the stapes head as shown in Fig. 11a. The off-set force resulted in a bending moment which caused tilting of the footplate with respect to the central axis. The bending induced normal strains εX (X-direction) and εZ (Z-direction), and shear strain εZX (X-Z plane) in the cross-sectional SAL element. The calculated shear strain εZX was 92 times larger than normal strain εX and 52 times larger than εZ, which indicated that the shear deformation of SAL was dominant even if the maximum bending component was considered in the experimental setup.
FIGURE 11.
(a) FE model analysis of deformation distribution of the specimen under off-axis loading. A force of 0.38 N was applied on the stapes head with an offset of 0.2 mm from the central line. (b) Cross-sectional image of the displacement (uZ) distribution in the SAL at the left edge of the stapes footplate under the off-axis loading. A tilting angle of inner rim of the SAL 0.59° was observed.
Furthermore, Fig. 11b shows the distribution of displacement uZ in a cross-section of the SAL from the same location as in Fig. 10c. Compared with Fig. 10c, the off-axis force resulted in a tilting angle ϕ of inner rim about 0.59°. The maximum displacement was 0.180 mm, smaller than 0.198 mm in Fig. 10(c) due to the off-axis load condition. At the opposite or right edge of the footplate, the maximum displacement increased from 0.198 to 0.207 mm. Under the off-axis load condition, the variation of SAL deformation was about 1% and the displacement component uZ was still linearly distributed across the SAL. The tilting angle was small enough to neglect the bending component. Thus, the assumption that the SAL was under simple shear was accepted and the experimental method developed in this study was reasonable for shear stress and shear strain calculation on SAL samples.
I-4. Estimation of experimental measurement error
The measurement error of shear stress comes from the force (F), SAL perimeter (C) and height (h) measurement errors based on Eq. (1) of shear stress calculation. The error of shear strain comes from displacement (uz) and SAL thickness (d) measurements based on Eq. (2) of shear strain definision. Thus, the absolute measurement errors of shear stress eτ and shear strain eγ can be calculated as:
| (10) |
| (11) |
where eF, euz , eC, eh, and ed are the measurement errors for force (F), displacement (uz), SAL perimeter (C), height (h), and thickness (d), respectively. The load or force precision of MTS is 0.001 N or eF = 0.001 N. The controlled displacement precision of MTS is 0.001 mm or euz = 0.001 mm. The dimensional parameters of SAL were measured on digital images using pixel calculation method and the resolution of the images was 50 pixels/mm. Thus, the precision of SAL dimension measurements (C, h, and d) was 0.02 mm (equal to 1 mm divided by 50) for eC = 0.02 mm, eh = 0.02 mm, and ed = 0.02 mm, respectively.
Using Eq. (10), the absolute shear stress error of 20.79 kPa was calculated at force level of 0.4 N which was the mean maximum force/load applied on SAL samples in tensile tests. Dividing eF by full force range (0.4 N), we obtained the relative error of force (F) as 0.25%. Similarly, the relative errors of SAL perimeter (C) and height (h): 0.25% and 9.09%, respectively, were obtained by dividing eC and eh by their mean values in Table 1. Finally, the relative error of stress was determined to be 9.1% which was mainly coming from the SAL height measurement. The absolute shear strain error of 0.816 was calculated using Eq. (11) at 0.2 mm which was the largest displacement in tensile tests. The relative error of displacement (uZ) was calculated to be 0.5% by dividing euz by full displacement range (0.2 mm). The relative error of SAL thickness (d) was calculated to be 28.57% by dividing ed by its mean value in Table 1. Thus, the relative error of strain 28.6% was mainly due to the SAL thickness measurement.
In summary, assessments of experimental setup and measurements demonstrated that the assumption that SAL specimen is under simple shear deformation in our experimental setup is reasonable for measuring mechanical properties of the SAL. The off-axis bending component does not have a significant effect on the measurement data, but dimensional values of SAL thickness and height may have major effect on the shear stress and shear strain measurements.
II. Application of measured SAL material properties
The hysteresis phenomenon (Fig. 6) and stress relaxation behavior (Fig. 9) observed from SAL specimens demonstrate that the stapedial annular ligament is a typical viscoelastic material. The nonlinear shear stress-shear strain relationship and the shear modulus varying with stress level are shown in Figs. 7 and 8, respectively. The SAL quickly becomes stiffer as footplate displacement increases. This mechanical behavior can be used to explain experimental measurements by Price and Kalb [28]. In their experiment on cat, the stapes footplate was in small movement bounded by the SAL for normal range of hearing, while large displacement was lagged and slowly increased when the ear exposed to intense sounds. The nonlinear behavior of the SAL reported in this study could explain its function in protecting the ear from intense sounds. It should be noted that the middle ear ossicular chain with suspensary ligaments and muscles is responding to intense sounds, but the SAL plays a unique role in transmission of acoustic energy to the cochlea.
The Ogden hyperelastic model was chosen to analyze the nonlinear material properties of the SAL in this study [26]. The Ogden model has been popularly used for studying rubber-like biological soft tissues instead of the Mooney-Rivlin and Yeoh models in the literature [29]. A series of soft tissues in the ear, such as the stapedial tendon, tympanic membrane, anterior mallear ligament and tensor tympani tendon, were successfully analyzed with the first-order Ogden model to describe nonlinear and viscoelastic behaviors by Cheng et al. [21–24]. The Ogden material constants μ1 and α1 of the SAL determined from nine SAL specimens in this study provide the mechanical properties of the SAL necessary for modeling human hearing mechanics such as response to static pressurization in the middle ear [30, 31].
As an example, the shear modulus-shear stress relationship derived in Fig. 8 can be used to evaluate elastic modulus of the SAL under different static stress levels. The static stress-dependent modulus will be converted into the elastic modulus for dynamic analysis using the empirical formula reported by Wang et al. [32]. The dynamic elastic moduli of all the middle-ear soft tissues can be finally employed into 3D FE model of the human ear to analyze the middle ear transfer function when large static pressure is built in the middle ear. This will be part of our future studies on application of the measured mechanical properties of the SAL.
In the present study, the thickness of SAL is assumed to be uniformly distributed along the stapes footplate circumference. However, the thickness of the SAL in the anterior side may be different from that in the posterior side as observed in histological sections by Hagr et al. [33]. This structural variation may affect material property measurements of the SAL in transmitting vibration from middle ear ossicles into cochlear fluid. The asymmetric geometry of the SAL associated with nonlinear material property needs further studies.
We also acknowledged that due to the limitation of temporal bone source, the samples used for this study were mostly from elderly donors. The material parameters obtained from the measurements may not be appropriate for the entire population if tissue mechanical properties change with age. More measurements on different age groups are needed in the future study. Moreover, the microstructure of SAL observed under scanning electron microscopy was reported as a lattice-like structure with transverse microfibrils across thick ligament fibers [5]. In our future studies, the fiber structure of the SAL will be modeled with interactions between fibers and ground substances. Particularly, the SAL has been regarded as the site of predilection of otosclerosis or abnormal ossification between the footplate and oval window which causes severe conductive hearing loss in humans.
CONCLUSION
We report, for the first time, measured mechanical properties of the human stapedial annular ligament. The experimental methods used in measuring SAL mechanical properties further demonstrate the combined material testing in MTS with DIC is a useful approach to measure mechanical properties of ear soft tissues. The results obtained in this study demonstrate that the stapedial annular ligament is a viscoelastic material with nonlinear shear stress-shear strain relationship. The hyperelastic Ogden model provides a good description of nonlinear behavior of the SAL. The effect of off-axis loading on mechanical properties of the sample was estimated using the 3D FE model of the SAL with stapes attached. Comparison of experimental measurements and FE modeling results shows that the experimental methods developed in this study are suitable to measure the mechanical behavior of SAL. Thus, the mechanical properties of SAL reported here will have significant impact on advancing our knowledge about SAL and improving the accuracy of FE model of the human ear for prediction of sound energy transmission through the ear.
ACKNOWLEDGEMENT
The authors thank the assistance on experiments from Wei Li, graduate student in our BME lab, at University of Oklahoma and Dr. Chenkai Dai, former PhD student in BME lab and currently at Johns Hopkins University. This work was supported by NIH/NIDCD R01DC006632 and NSF/CMMI-0510563 grants.
Footnotes
Publisher's Disclaimer: This is a PDF file of an unedited manuscript that has been accepted for publication. As a service to our customers we are providing this early version of the manuscript. The manuscript will undergo copyediting, typesetting, and review of the resulting proof before it is published in its final citable form. Please note that during the production process errors may be discovered which could affect the content, and all legal disclaimers that apply to the journal pertain.
REFERENCES
- 1.Bolz EA, Lim DJ. Morphology of the stapediovestibular joint. Acta Otolaryngol. 1972;73:10–17. doi: 10.3109/00016487209138188. [DOI] [PubMed] [Google Scholar]
- 2.Brunner H. Attachment of the stapes to the oval window in man. Archiv. Otolaryngol. 1954;59:18–29. doi: 10.1001/archotol.1954.00710050030002. [DOI] [PubMed] [Google Scholar]
- 3.Whyte JR, Gonzalez L, Cisneros AI, Yus C, Torres A, Sarrat R. Fetal development of the human tympanic osscular chain articulations. Cells Tissues Organs. 2002;171:241–249. doi: 10.1159/000063124. [DOI] [PubMed] [Google Scholar]
- 4.Wolff D, Bellucci R. The human ossicular ligaments. Ann. Otol. Rhinol. Laryngol. 1956;65:895–909. doi: 10.1177/000348945606500401. [DOI] [PubMed] [Google Scholar]
- 5.Ohashi M, Ide S, Kimitsuki T, Komune S, Suganuma T. Three-dimensional regular arrangement of the annular ligament of the rat stapediovestibular joint. Hearing Research. 2006;213:11–16. doi: 10.1016/j.heares.2005.11.007. [DOI] [PubMed] [Google Scholar]
- 6.Bekesy G. Experiments in hearing. New York: McGraw-Hill Book Co; 1960. [Google Scholar]
- 7.Gyo K, Aritomo H, Goode RJ. Measurement of the ossicular vibration ratio in human temporal bones by use of a video measuring system. Acta. Otolaryngology. 1987;103:87–95. doi: 10.3109/00016488709134702. [DOI] [PubMed] [Google Scholar]
- 8.Merchant N, Incesulu A, Glynn RJ. Histologic studies of the posterior stapediovestibular joint in otosclerosis. J Otol Neurotol. 2001;22:305–310. doi: 10.1097/00129492-200105000-00006. [DOI] [PubMed] [Google Scholar]
- 9.Schuknecht H, Barber W. Histologic variants in otosclerosis. Laryngoscope. 1985;95:1307–1377. doi: 10.1288/00005537-198511000-00003. [DOI] [PubMed] [Google Scholar]
- 10.Murakami S, Gyo K, Goode RL. Effect of middle ear pressure change on middle ear mechanics. Acta Otolaryngol. 1997;117(3):390–395. doi: 10.3109/00016489709113411. [DOI] [PubMed] [Google Scholar]
- 11.Murakami S, Gyo K, Goode RL. Effect of increased inner ear pressure on middle ear mechanics. Otolaryngol Head Neck Surg. 1998;118(5):703–708. doi: 10.1177/019459989811800528. [DOI] [PubMed] [Google Scholar]
- 12.Gan RZ, Dai C, Wood MW. Laser interferometry measurements of middle ear fluid and pressure effects on sound transmission. J Acoust Soc Am. 2006;120(6):3799–3810. doi: 10.1121/1.2372454. [DOI] [PubMed] [Google Scholar]
- 13.Büki B, Chomicki A, Dordain M, Lemaire JJ, Wit HP, Chazal J, Avan P. Middle-ear influence on otoacoustic emissions. II: contributions of posture and intracranial pressure. Hear Res. 2000;140(1–2):202–211. doi: 10.1016/s0378-5955(99)00202-6. [DOI] [PubMed] [Google Scholar]
- 14.Büki B, Avan P, Lemaire JJ, Dordain M, Chazal J, Ribári O. Otoacoustic emissions: a new tool for monitoring intracranial pressure changes through stapes displacements. Hear Res. 1996;94(1–2):125–139. doi: 10.1016/0378-5955(96)00015-9. [DOI] [PubMed] [Google Scholar]
- 15.Lopez A, Juberthie L, Olivier JC, Causse JB, Robinson J. Survival and evolution of vein grafts in otosclerosis surgery: structural and ultrastructural evidence. Am J Otol. 1992;13(2):173–184. [PubMed] [Google Scholar]
- 16.Causse JB, Lopez A, Juberthie L, Olivier JC. Stapedotomy: the JB Causse technique. Ann Acad Med Singapore. 1991;20(5):618–623. [PubMed] [Google Scholar]
- 17.Hüttenbrink KB. Biomechanics of stapesplasty: a review. Otol Neurotol. 2003;24(4):548–557. doi: 10.1097/00129492-200307000-00004. [DOI] [PubMed] [Google Scholar]
- 18.Gan RZ, Sun Q, Feng B, Wood MW. Acoustic–structural coupled finite element analysis for sound transmission in human ear—Pressure distributions. Medical Engineering & Physics. 2006;28:395–404. doi: 10.1016/j.medengphy.2005.07.018. [DOI] [PubMed] [Google Scholar]
- 19.Gan RZ, Reeves BP, Wang X. Modeling of sound transmission from ear canal to cochlea. Ann Biomedical Eng. 2007;35(12):2180–2195. doi: 10.1007/s10439-007-9366-y. [DOI] [PubMed] [Google Scholar]
- 20.Wada H, Metoki T, Kobayashi T. Analysis of dynamic behavior of human middle ear using a finite-element method. J Acoust Soc Am. 1992;92(6):3157–3168. doi: 10.1121/1.404211. [DOI] [PubMed] [Google Scholar]
- 21.Cheng T, Gan RZ. Mechanical properties of anterior malleolar ligament from experimental measurement and material modeling analysis. Biomech Model Mechanobiol. 2008;7:387–394. doi: 10.1007/s10237-007-0094-x. [DOI] [PMC free article] [PubMed] [Google Scholar]
- 22.Cheng T, Gan RZ. Experimental measurement and modeling analysis on mechanical properties of tensor tympani tendon. Medical Engineering & Physics. 2008;30:358–366. doi: 10.1016/j.medengphy.2007.04.005. [DOI] [PubMed] [Google Scholar]
- 23.Cheng T, Gan RZ. Mechanical properties of stapedial tendon in human middle ear. J. Biomechanical Engineering. 2007;129:913–918. doi: 10.1115/1.2800837. [DOI] [PubMed] [Google Scholar]
- 24.Cheng T, Dai C, Gan RZ. Viscoelastic properties of human tympanic membrane. Ann Biomedical Eng. 2007;35(2):305–314. doi: 10.1007/s10439-006-9227-0. [DOI] [PubMed] [Google Scholar]
- 25.Fung YC. Biomechanics: Mechanical properties of living tissues. New York: Springer; 1993. [Google Scholar]
- 26.Ogden R. Non-linear elastic deformations. Chichester: Ellis Harwood Ltd.; 1984. [Google Scholar]
- 27.Guedes RM, Marques AT, Carton A. Analytical and Experimental Evaluation of Nonlinear Viscoelastic-Viscoplastic Composite Laminates under Creep, Creep-Recovery, Relaxation and Ramp Loading. Mechanics of Time-Dependent Materials. 1998;2(2):113–128. [Google Scholar]
- 28.Price RG, Kalb JT. Insights into hazard from intense impulses from a mathematical model of the ear. J. Acoust. Soc. Am. 1991;90(1):219–227. doi: 10.1121/1.401291. [DOI] [PubMed] [Google Scholar]
- 29.Sarma PA, Pidaparti RM, Moulik PN, Meiss RA. Nonlinear material models for tracheal smooth muscle tissue. Biomed. Mater. Eng. 2003;13(3):235–245. [PubMed] [Google Scholar]
- 30.Hüttenbrink KB. The mechanics of the middle-ear at static air pressures: the role of the ossicular joints, the function of the middle-ear muscles and the behavior of stapedial prostheses. Acta Oto-Laryngologica. Supplementum. 1988 Suppl. 451:1–35. doi: 10.3109/00016488809099007. [DOI] [PubMed] [Google Scholar]
- 31.Dirckx JJ, Decraemer WF, von Unge M, Larsson C. Volume displacement of the gerbil eardrum pars flaccida as a function of middle ear pressure. Hearing Research. 1998;118(1–2):35–46. doi: 10.1016/s0378-5955(98)00025-2. [DOI] [PubMed] [Google Scholar]
- 32.Wang X, Cheng T, Gan RZ. Finite-element analysis of middle-ear pressure effects on static and dynamic behavior of human ear. J. Acoust. Soc. Am. 2007;122(2):906–917. doi: 10.1121/1.2749417. [DOI] [PubMed] [Google Scholar]
- 33.Hagr AA, Funnell WR, Zeitouni AG, Rappaport JM. High-resolution x-ray CT scanning of the human stapes footplate. Annual Meeting of the Canadian Society of Otolaryngology-Head and Neck Surgery; Calgary. 2003. [DOI] [PubMed] [Google Scholar]


